Are we heading for a major stock market decline? Warnings about a crash of the financial markets are quite common these days, and usually they don’t materialize. But this time may be different. A number of top analysts are pointing out the fact that the biggest cluster of “Hindenburg Omens” has appeared since the last stock market crash. And those that have studied this insist that the more “Hindenburg Omens” there are in a cluster, the stronger the signal is. Meanwhile, another very disturbing sign is the fact that the yield on 10 year U.S. Treasuries is starting to soar again. On Tuesday it shot up from 2.62% to 2.727%. As I have written about previously, the yield on 10 year U.S. Treasuries is the most important number in the U.S. economy right now. If that number continues to rise, it is going to be very, very bad news for the financial system.
But before I discuss rising interest rates any further, I want to talk about this unusual cluster of Hindenburg Omens that we have just witnessed. In a previous article, I shared a list of the criteria that are commonly used to determine whether a Hindenburg Omen has appeared or not…
1. The daily number of NYSE new 52 Week Highs and the daily number of new 52 Week Lows must both be greater than 2.2 percent of total NYSE issues traded that day.
2. The smaller of these numbers is greater than or equal to 69 (68.772 is 2.2% of 3126). This is not a rule but more like a checksum. This condition is a function of the 2.2% of the total issues.
3. That the NYSE 10 Week moving average is rising.
4. That the McClellan Oscillator ( a market breadth indicator used to evaluate the rate of money entering or leaving the market and interpretively indicate overbought or oversold conditions of the market)is negative on that same day.
5. That new 52 Week Highs cannot be more than twice the new 52 Week Lows (however it is fine for new 52 Week Lows to be more than double new 52 Week Highs).
When the Hindenburg Omen makes an appearance, it is supposedly a signal that the U.S. stock market will likely experience a significant decline within the next 40 days.
But of course this has not always happened when a Hindenburg Omen has appeared. However, what we are seeing right now is a highly concentrated cluster of Hindenburg Omens. According to SentimenTrader’s Jason Goepfert, the last time such a cluster appeared was before the last stock market crash…
Sometimes a topic in the market takes hold and it’s hard to shake it off. One of those is the technical “market crash” signal called the Hindenburg Omen.
It has its boosters and its detractors, and we’re not going to get caught up in debating its merits. We’ve discussed it for 12 years, always with the same arguments.
On June 10th, we outlined the market’s historical performance after suffering at least 5 signals from the Hindenburg Omen within a two-week period. Stocks were consistently weak afterward, and proved to be so again, at least for a while.
With the latest market rally, the Omens are flaring up again.There have been 5 Omens triggered out of the past 8 trading sessions (your data may vary—we’re using the same sources we’ve always used for historical data). That’s actually the closest-grouped cluster since early November 2007.
It’s extremely rare to see as many Omens occurring together as we’ve seen over the past 50 days. The last time was prior to the bear market in 2007.
The time before that was prior to the bear market in 2000.
Will the pattern hold up this time?
We’ll see.
But without a doubt we have been witnessing some very unusual activity in the markets over the past couple of weeks. In fact, according to Tyler Durden of Zero Hedge, we have now seen a Hindenburg Omen occur five times in the last seven trading days…
For the 5th time in the last 7 days, equity market internals have triggered an anxiety-implying Hindenburg Omen. Based on our data, this is the most concentrated cluster of new highs, new lows, advancing/declining based confusion on record. The last few occurrences have not ended well (though obviously not disastrously) but as the creator of the ‘Omen’ notes, the more occurrences that cluster, the stronger the signal.
But the Hindenburg Omen is not the only sign that a stock market crash may be coming. Marc Faber, the publisher of the Gloom, Boom & Doom Report, says that the markets are repeating the exact same pattern that we saw just before the stock market crash of 1987…
“In 1987, we had a very powerful rally, but also earnings were no longer rising substantially, and the market became very overbought,” Faber said on Thursday’s “Futures Now.” “The final rally into Aug. 25 occurred with a diminishing number of stocks hitting 52-week highs. In other words, the new-high list was contracting, and we have several breaks in different stocks.”
Faber says that’s exactly where we find ourselves this August.
Faber is projecting a stock market decline of “20 percent, maybe more” in the month ahead.
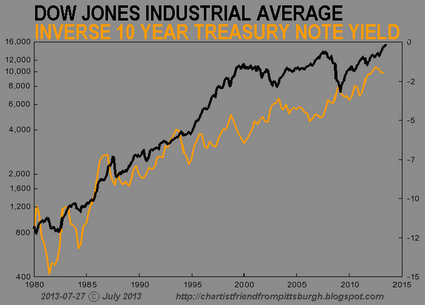
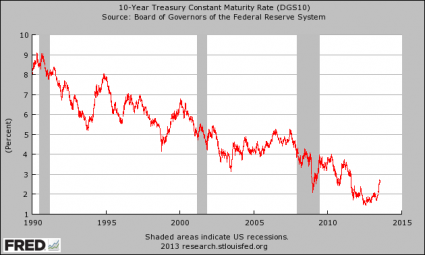
Meanwhile, as I mentioned at the top of the article, the yield on 10 year U.S. Treasuries shot up to 2.727% today. The Federal Reserve is starting to lose control of long-term interest rates, and the only way that Fed officials are going to be able to get control back is to substantially raise the level of quantitative easing that they are doing, but of course that would create a whole bunch of other problems.
For now, the Fed keeps dropping hints that “tapering” is coming. But if the Fed does “taper”, there might not be any support for bond prices from the private sector. BAML credit strategist Hans Mikkelsen recently detailed why this is the case…
Since the financial crisis, Treasuries have been supported by numerous types of investors, including mutual funds/ETFs, banks, [emerging market] central banks and the foreign official sector (in addition to the Fed of course). However, these four sources of Treasury demand are unlikely to support the market in the short term going forward.
First, with continued outflows from non-short term high grade bond funds, money managers are unlikely to provide support for Treasuries any time soon.
Second, with increasing loan demand reducing the need for banks to support profitability by buying Treasuries, as well as significant mark-to-market losses in [available-for-sale] portfolios that in the future will count against capital, banks are unlikely to add long-duration assets in a rising interest rate environment.
Third, in light of continued depreciation of [emerging market] currencies, it appears unlikely that [emerging market] countries are experiencing inflows that need to be reinvested in Treasuries.
Finally, custody holdings of Treasuries continue to decline, suggesting foreign official sales of Treasuries.
If the yield on 10 year U.S. Treasuries continues to rise sharply over the coming months, that could potentially cause the 441 trillion dollar interest rate derivatives bubble to implode. As John Embry recently told King World News, that would be “disastrous” for the global financial system…
Interest rates have already risen dramatically, so any tapering will simply throw gasoline on that fire and torch the banking system which is up to its eyeballs in interest rate derivatives. This would be disastrous for the entire financial system.
Someone recently suggested that there was already a $4 trillion hole in the European banking system. If we look at the Japanese situation, that is totally unstable as well. So the destruction of paper money will only accelerate, and this is what you are seeing reflected today in the prices of gold and silver.
We also have this shortage of physical gold, which is reflected by the fact that the gold lease rates have been negative for 25 consecutive days. We then had the revelation that the Bank of England had dumped a staggering 1,300 tons of physical gold into the market that they were supposed to be safely storing for other countries. The Bank of England wouldn’t even comment, they just pleaded the 5th.
Hopefully these Hindenburg Omens will pass and nothing will happen.
Hopefully the yield on 10 year U.S. Treasuries will not continue to rise.
But you know what they say – hope for the best but prepare for the worst.
I hope that you are getting prepared for the worst while you still can.