Copper, China And World Trade Are All Screaming That The Next Economic Crisis Is Here

Screaming Smiley - Public DomainIf you are looking for a “canary in a coal mine” type of warning for the entire global economy, you have a whole bunch to pick from right now.  “Dr. Copper” just hit a six year low, Morgan Stanley is warning that this could be the worst oil price crash in 45 years, the Chinese economy is suddenly stalling out, and world trade is falling at the fastest pace that we have seen since the last financial crisis.  In order not to see all of the signs that are pointing toward a global economic slowdown, you would have to be willingly blind.  In recent months, I have been writing article after article detailing how the exact same patterns that happened just before the stock market crash of 2008 are playing out once again.  We are watching a slow-motion train wreck unfold right before our eyes, and things are only going to get worse from here.

Copper is referred to as “Dr. Copper” because it does such an excellent job of indicating where economic conditions are heading next.  We saw this in 2008, when the price of copper started crashing big time in the months leading up to the stock market implosion.

Well, now copper is crashing again.  Just check out this chart.  The price of copper plunged again on Wednesday, and it is now the lowest that it has been since the last financial crisis.  Unfortunately, the forecast for the months ahead is not good.  The following is what Goldman Sachs is saying about copper…

“Though we have been bearish on copper on a 12-mo forward basis for the past two and a half years, we have maintained a more bullish medium to long-term stance on the assumption of Chinese copper demand growth of 4% per annum and a major slowing in supply growth around 2017/2018 … we substantially lower our short, medium, and long-term copper price forecasts, on the back of lower Chinese copper demand growth forecasts (we have been highlighting that the risk has been skewed to the downside for some time), increased conviction in copper supply growth over the next three years, and increased conviction in the outlook for mining cost deflation in dollar terms.”

It is funny that Goldman mentioned China so prominently.  Even though China’s fake GDP figures say that everything is fine over there, other numbers are painting a very dismal picture.

For instance, Chinese electrical consumption in June grew at the slowest pace that we have seen in 30 years, and capital outflows from China have reached a level that is “frightening”

Robin Brooks at Goldman Sachs estimates that capital outflows topped $224bn in the second quarter, a level “beyond anything seen historically”.

The Chinese central bank (PBOC) is being forced to run down the country’s foreign reserves to defend the yuan. This intervention is becoming chronic. The volume is rising. Mr Brooks calculates that the authorities sold $48bn of bonds between March and June.

Charles Dumas at Lombard Street Research says capital outflows – when will we start calling it capital flight? – have reached $800bn over the past year. These are frighteningly large sums of money.

Just last month, the Chinese stock market started to crash, but the crash was interrupted when the Chinese government essentially declared a form of financial martial law.

And I don’t think that “financial martial law” is too strong of a term to use in this case.  Just consider the following excerpt from a recent article in the Telegraph

Half the shares traded in Shanghai and Shenzhen were suspended. New floats were halted. Some 300 corporate bosses were strong-armed into buying back their own shares. Police state tactics were used hunt down short sellers.

We know from a vivid account in Caixin magazine that China’s top brokers were shut in a room and ordered to hand over money for an orchestrated buying blitz. A target of 4,500 was set for the Shanghai Composite by Communist Party officials.

So a stock market crash was halted, but in doing so Chinese officials have essentially destroyed the second largest stock market in the world.  China’s financial markets have lost all legitimacy, and foreigners are going to be extremely hesitant to put any money into Chinese stocks from now on.

Meanwhile, there is no hiding the fact that trade activity in China and in most of the rest of the planet is slowing down.  In fact, world trade volume has now dropped by the most that we have seen since the last global recession.  The following comes from Zero Hedge

As goes the world, so goes America (according to 30 years of historical data), and so when world trade volumes drop over 2% (the biggest drop since 2009) in the last six months to the weakest since June 2014, the “US recession imminent” canary in the coalmine is drawing her last breath

World Trade Volume - Zero Hedge

As Wolf Street’s Wolf Richter adds, this isn’t stagnation or sluggish growth. This is the steepest and longest decline in world trade since the Financial Crisis. Unless a miracle happened in June, and miracles are becoming exceedingly scarce in this sector, world trade will have experienced its first back-to-back quarterly contraction since 2009.

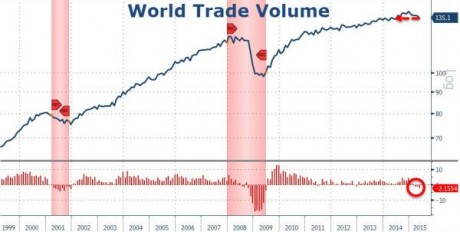
As you probably noted in the chart above, a decline in world trade is almost always associated with a recession.

That was certainly the case back in 2008 and 2009.

Another similarity between the last crisis and what is happening now is a crash in the price of oil.

According to Business Insider, we have just officially entered a brand new bear market for oil…

Oil is officially in a bear market.

On Thursday, West Texas Intermediate crude oil futures fell more than 1% to settle near $48.55 per barrel in New York.

A bear market is roughly defined as a 20% drop from highs. Crude has now fallen by about 20% in the last six weeks.

So what does all of this mean?

All of these signs are indicating that another great economic crisis is here, and that a global financial implosion is just around the corner.

At this point, even many of the “bulls” are sounding the alarm.  For example, just consider what Henry Blodget of Business Insider is saying…

As regular readers know, for the past ~21 months I have been worrying out loud about US stock prices. Specifically, I have suggested that a decline of 30% to 50% would not be a surprise.

I haven’t predicted a crash. But I have said clearly that I think stocks will deliver returns that are way below average for the next seven to 10 years. And I certainly won’t be surprised to see stocks crash. So don’t say no one warned you!

For those that don’t know, Henry Blodget is definitely not a bear.  In fact, he is one of Wall Street’s biggest cheerleaders.

So for Blodget to suggest that we could see the stock market drop by half is a really big deal.

The closer that we get to this next crisis, the clearer that everything is becoming.

Where are things going to go from here?  Please feel free to add to the discussion by posting a comment below…

Birth Pangs Of The Coming Great Depression

Birth PangsThe signs of the times are everywhere – all you have to do is open up your eyes and look at them.  When a pregnant woman first goes into labor, the birth pangs are usually fairly moderate and are not that close together.  But as the time for delivery approaches, they become much more frequent and much more intense.  Economically, what we are experiencing right now are birth pangs of the coming Great Depression.  As we get closer to the crisis that is looming on the horizon, they will become even more powerful.  This week, we learned that the Baltic Dry Index has fallen to the lowest level that we have seen in 29 years.  The Baltic Dry Index also crashed during the financial collapse of 2008, but right now it is already lower than it was at any point during the last financial crisis.  In addition, “Dr. Copper” and other industrial commodities continue to plunge.  This almost always happens before we enter an economic downturn.  Meanwhile, as I mentioned the other day, orders for durable goods are declining.  This is also a traditional indicator that a recession is approaching.  The warning signs are there – we just have to be open to what they are telling us.

And of course there are so many more parallels between past economic downturns and what is happening right now.

For example, volatility has returned to the markets in a big way.  On Tuesday the Dow was down about 300 points, on Wednesday it was down another couple hundred points, and then on Thursday it was up a couple hundred points.

This is precisely how markets behave just before they crash.  When markets are calm, they tend to go up.  When markets get really choppy and start behaving erratically, that tells us that a big move down is usually coming.

At the same time, almost every major global currency is imploding.  For much more on this, see the amazing charts in this article.

In particular, I am greatly concerned about the collapse of the euro.  The Swiss would not have decoupled their currency from the euro if it was healthy.  And political events in Greece are certainly not going to help things either.  Economic conditions across Europe just continue to get worse, and the future of the eurozone itself is very much in doubt at this point.  And if the eurozone does break up, a European economic depression is almost virtually assured – at least in the short term.

And I haven’t even mentioned the oil crash yet.

There is only one other time in all of history when the price of oil collapsed by more than 60 dollars, and that was just prior to the horrific financial crisis of 2008.

Since the last financial crisis, the oil industry has been a huge source for job growth in this country.  The following is an excerpt from a recent CNN article

The oil sector has added over a half million jobs — many of them high paying — since the recession ended in June 2009. That’s 13% of all US job growth over that period.

Now energy companies and related sectors are laying off thousands. Expect that trend to continue, bears say.

But losing good jobs is just the tip of the iceberg of this oil crisis.

At this point, the price of oil has already dropped to a catastrophically low level.  The longer it stays at this level, the more damage that it is going to do.  If the price of oil stays at this level for all of 2015, we are going to have a complete and total financial nightmare on our hands

For the first time in 18 years, oil exporters are pulling liquidity out of world markets rather than putting money in. The world is now fast approaching a world reserve currency shift. If we see 8 to 12 months at these oil prices; U.S. shale industry will be wiped out. The effect on junk bonds will cascade to the rest of the stock market and U.S. economy.

…and this time there will be nothing left to catch the falling knife before it hits the American economy right in the heart. Not the FED nor the U.S. government can stop what’s coming. Liquidity will freeze up, our credit will be downgraded, the stock market will start to collapse, and then we can expect the FED to come in and hyper-inflate the dollar. This will cause the world to finish abandoning the world reserve currency in the last rungs of trade. This will be the end of the petrodollar.

Something that I have not discussed so far this year is the looming crisis in emerging market debt.

As economic problems spread around the world, a number of “emerging markets” are in danger of having their debt downgraded.  And many investment funds have rules that prohibit them from holding any debt that is not “investment grade”.  Therefore, we could potentially see some of these giant funds dumping massive amounts of emerging market debt if downgrades happen.

This is a really big deal.  As a Business Insider article recently detailed, we could be talking about hundreds of billions of dollars…

Russia this week became the first of the major economies to lose its investment grade status from Standard & Poor’s, falling out off the top ratings category for credits deemed to have a low risk of default for the first time in a decade.

If Moody’s and Fitch follow, conservative investors barred from owning junk securities must sell their holdings. JPMorgan estimates this means they may ditch $6 billion in Russian government rouble and dollar debt.

Russia may have company. Almost $260 billion worth of sovereign and corporate bonds – nearly a tenth of outstanding emerging market (EM) debt – is in danger of being relegated to junk, according to David Spegel, head of emerging debt at BNP Paribas, who calls such credits “falling angels”.

And no article of this nature would be complete without mentioning derivatives.

I could not possibly overemphasize the danger that the 700 trillion dollar derivatives bubble poses to the global financial system.

As we enter the coming Great Depression, derivatives are going to play a starring role.  Wall Street has been pumped full of funny money by global central banks, and our financial markets have been transformed into the greatest casino in the history of the world.  When this house of cards comes crashing down, and it will, it is going to be a financial disaster unlike anything that the planet has ever seen.

And yes, global central banks are very much responsible for setting the stage for what we are about to experience.

I really like the way that David Stockman put it the other day…

The global financial system is literally booby-trapped with accidents waiting to happen owing to six consecutive years of massive money printing by nearly every central bank in the world.

Over that span, the collective balance sheet of the major central banks has soared by nearly $11 trillion, meaning that honest price discovery has been virtually destroyed. This massive “bid” for existing financial assets based on credit confected from thin air drove long-term bond yields to rock bottom levels not seen in 600 years since the Black Plague; and pinned money market costs at zero—-for 73 months running.

What is the consequence of this drastic financial repression along the entire yield curve? The answer is bond prices which keep rising regardless of credit risk, inflation or taxes; and rampant carry trade speculation that can’t get out of its own way because  central banks have made the financial gamblers’ cost of goods—the “funding” cost of their trades—-essentially zero.

Of course I am not the only one warning that a new Great Depression is coming.  For instance, just consider what British hedge fund manager Crispin Odey is saying…

British hedge fund manager Crispin Odey thinks we’ve entered an economic downturn that is “likely to be remembered in a hundred years,” and central banks won’t be able to stop it.

In his Odey Asset Management investor letter dated Dec. 31, Odey writes that the shorting opportunity “looks as great as it was in 07/09.”

“My point is that we used all our monetary firepower to avoid the first downturn in 2007-09,” he writes, “so we are really at a dangerous point to try to counter the effects of a slowing China, falling commodities and EM incomes, and the ultimate First World Effects. This is the heart of the message. If economic activity far from picks up, but falters, then there will be a painful round of debt default.”

Even though most average citizens are completely oblivious to what is happening, many among the elite are heeding the warning signs and are feverishly getting prepared.  As Robert Johnson told a stunned audience at the World Economic Forum the other day, they are “buying airstrips and farms in places like New Zealand“.  They can see the horrifying storm forming on the horizon and they are preparing to get out while the getting is good.

It can be very frustrating to write about economics, because things in the financial world can take an extended period of time to play out.  Sadly, most people these days have extremely short attention spans.  We live in a world of iPhones, iPads, YouTube videos, Facebook updates and 48 hour news cycles.  People no longer are accustomed to thinking in long-term time frames, and if something does not happen right away we tend to get bored with it.

But the economic world is not like a game of “Angry Birds”.  Rather, it is very much like a game of chess.

And unfortunately for us, checkmate is right around the corner.


Is “Dr. Copper” Foreshadowing A Stock Market Crash Just Like It Did In 2008?

Stock Market Decline - Photo by NodulationIs the price of copper trying to tell us something?  Traditionally, “Dr. Copper” has been a very accurate indicator of where the global economy is heading next.  For example, back in 2008 the price of copper dropped from nearly $4.00 to under $1.50 in just a matter of months.  And now it appears that another big decline in the price of copper is starting to happen.  So far this year, the price of copper has dropped from a high of $3.40 back in January to a price of $2.95 as I write this article, and many analysts are warning that this is just the beginning.  By itself, this should be quite alarming to investors, but as you will see below there are a whole host of other signs that a stock market crash may be rapidly approaching.

But before we get to those other signs, let us discuss copper a bit more first.  I cannot remember a time since 2008 when there has been such an overwhelming negative consensus about where the price of copper is heading.  The following is from a CNBC article that was posted this week…

Cascading copper prices have multiple root causes that lead to one conclusion: The anticipated global economic recovery may not be all it’s cracked up to be.

Consequently, analysts are in virtual unison that the extended-term trajectory is lower for the metal often used as a growth barometer. Copper futures are off more than 12 percent in 2014 and 7 percent over just the past three days, though they rose less than 1 percent in Wednesday trading.

A slowdown in the global economy, forced selling by Chinese banks and technical factors have converged in multiple calls for more weakness in a commodity known by traders and economists as “Dr. Copper” for its ability to accurately make economic prognoses.

Of course there are some out there that are trying to claim that “this time is different” and that the price of copper is no longer a useful indicator for the global economy as a whole.

We shall see.

Meanwhile, there are lots of other signs that the financial markets are repeating patterns that we have seen in the past.  For instance, the level of margin debt on Wall Street just soared to another brand new record high

The amount of money investors borrowed from Wall Street brokers to buy stocks rose for a seventh straight month in January to a record $451.3 billion, a potential warning sign that in the past has coincided with irrational exuberance and stock market tops.

We saw margin debt spike dramatically like this just prior to the crash of the dotcom bubble in 2000 and just before the great financial crisis of 2008.  Just check out the chart in this article.

Shouldn’t we be alarmed that it is happening again?

If you listen carefully, there are many prominent voices in the financial world that are trying to warn us about this.  Here is one example

“One characteristic of getting closer to a market top is a major expansion in margin debt,” says Gary Kaltbaum, president of Kaltbaum Capital Management. “Expanding market debt fuels the bull market and is an investors’ best friend when stocks are rising. The problem is when the market turns (lower), it is the market’s worst enemy.

And of course margin debt is far from the only sign that indicates that we are in a massive stock market bubble that is about to crash.  The following is a list of 10 signs that comes from a recent article by Lance Roberts of STA Wealth Management

I was recently discussing the market, current sentiment and other investing related issues with a money manager friend of mine in California. (Normally, I would include a credit for the following work but since he works for a major firm he asked me not to identify him directly.)  However, in one of our many email exchanges he sent me the following note detailing the 10 typical warning signs of stock market exuberance.

(1) Expected strong OR acceleration of GDP and EPS  (40% of 2013’s EPS increase occurred in the 4th quarter)

(2) Large number of IPOs of unprofitable AND speculative companies

(3) Parabolic move up in stock prices of hot industries (not just individual stocks)

(4) High valuations (many metrics are at near-record highs, a few at record highs)

(5) Fantastic high valuation of some large mergers (e.g., Facebook & WhatsApp)

(6) High NYSE margin debt

Margin debt/gdp (March 2000: 2.7%, July 2007: 2.6%, Jan 2014: 2.6%)

Margin debt/market cap (March 2000: 1.8%, July 2007: 2.3%, Jan 2014: 2.0%)

(7) Household direct holdings of equities as % of total financial assets at 24%, second-highest level (data back to 1953, highest was 1998-2000)

(8) Highly bullish sentiment (down slightly from year-end peaks; still high or near record high, depending on the source)

(9) Unusually high ratio of selling to buying by corporate senior managers (the buy/sell ratio of senior corporate officers is now at the record post-1990 lows seen in Summer 2007 and Spring 2011)

(10) Stock prices rise following speculative press releases (e.g., Tesla will dominate battery business after they get partner who knows how to build batteries and they build a big factory.  This also assumes that NO ONE else will enter into that business such as GM, Ford or GE.)

All are true today, and it is the third time in the last 15 years these factors have occurred simultaneously which is the most remarkable aspect of the situation.

And for even more technical indicators such as these, please see Charles Hugh Smith’s excellent article entitled “Why 2014 Is Beginning to Look A Lot Like 2008“.

So do all of these numbers and charts actually prove that something is about to happen?

Not necessarily.

But if we do not learn from the past then we are doomed to repeat it.

At this point, even representatives from the big Wall Street banks are warning about the “euphoria” on Wall Street…

The stock market entered “euphoria mode” late last year and has remained there, except for a week in February, as “speculative froth” bubbles around the market’s hottest sectors, Citi’s chief equity strategist told CNBC on Tuesday.

And even market cheerleader Jim Cramer is warning that the stock market is now exhibiting “top behavior“…

The parabolic moves of stocks such as Plug Power and FuelCell Energy have the stock market exhibiting “top behavior,” CNBC’s Jim Cramer said Wednesday.

Cramer said he has tracked the fuel cells stocks since his days as a hedge fund manager. Runups in Freddie Mac and Fannie Mae also had him worried.

None of what you just read above guarantees that the stock market will crash this week, this month or even this year.

And nobody knows the exact date when the next stock market crash will happen.

But one thing is for certain – this massive stock market bubble will burst at some point, and when it does our economy is far less equipped to handle it than it was the last time.

Based on my research, I am entirely convinced that the coming economic crisis is going to be substantially worse than the last one, and that is very bad news for the United States.

So what do you think?

Do you agree or do you think that I am nuts?

Please feel free to share your opinion by posting a comment below…

Stock Prices Have Fallen For Six Weeks In A Row

The Price Of Copper And 11 Other Recession Indicators That Are Flashing Red

Red LightThere are a dozen significant economic indicators that are warning that the U.S. economy is heading into a recession.  The Dow may have soared past the 15,000 mark, but the economic fundamentals are telling an entirely different story.  If historical patterns hold up, the economy is heading for a very rocky stretch.  For example, the price of copper is called “Dr. Copper” by many economists because it so accurately forecasts the future direction of the U.S. economy.  And so far this year the price of copper is way down.  But that is not the only indicator that is worrying economists.  Home renovation spending has fallen dramatically, retail spending is crashing in a way not seen since the last recession, manufacturing activity and consumer confidence are both declining, and troubling economic data continues to come pouring out of Asia and Europe.  So why do U.S. stocks continue to skyrocket?  Will U.S. financial markets be able to continue to be divorced from reality?  Unfortunately, as we have seen so many times in the past, when stocks do catch up with reality they tend to do so very rapidly.  So you better put on your seatbelts because a crash is coming at some point.

But most average Americans are not that concerned with the performance of the stock market.  They just want to be able to go to work, pay the bills and provide for their families.  During the last recession, millions of Americans lost their jobs and millions of Americans lost their homes.  If we have another major recession, that will happen again.  Sadly, it appears that another major recession is quickly approaching.

The following are 12 recession indicators that are flashing red…

#1 The price of copper has traditionally been one of the very best indicators of the future performance of the U.S. economy.  The fact that it is down nearly 20 percent so far this year has many analysts extremely concerned

Copper’s downward trend foreshadows a stock market collapse, according to Societe Generale’s famously bearish strategist Albert Edwards, who said equity markets will riot “Japan-style.”

“Copper is acting exactly as it did when I wrote about the impotence of liquidity in the face of the (then imminent) 2007 recession. Once again it is giving us an early warning that liquidity will not save risk assets: time to get out of equities,” Edwards wrote in his latest research note, on Thursday.

#2 Home renovation spending has fallen back to depressingly-low 2010 levels.

#3 As Zero Hedge recently pointed out, U.S. retail spending is repeating a pattern that we have not seen since the last recession…

Retail sales of clothing is growing at the slowest pace since 2010; but while major store sales are about to drop negative YoY for the first time in over 3 years, the utter collapse in general merchandise sales is worse that at the peak of the last recession at -5%. It seems tough to see how a nation with an economy built on 70% consumption is not in a recessionary environment. And while this alone is a dismal signal for the discretionary upside of the US economy/consumer; as Gluskin Sheff’s David Rosenberg points out real personal income net of transfer receipts plunged at a stunning 5.8% annual rate in Q1. The other seven times we have seen such a collapse, the economy was either in recession of just coming out of one.

#4 Manufacturing activity all over the country is showing signs of slowing down.  In fact, Chicago PMI has dipped below 50 (indicating contraction) for the first time since the last recession.

#5 In April, consumer confidence unexpectedly fell to a nine-month low

The Thomson Reuters/University of Michigan preliminary index of consumer sentiment declined to 72.3 in April from 78.6 a month earlier. This month’s reading was lower than all 69 estimates in a Bloomberg survey that called for no change from the March number.

#6 NYSE margin debt peaked right before the recession that began in 2002, it peaked right before the financial crisis of 2008, and it is peaking again.

#7 The S&P 500 usually mirrors the performance of Chinese stocks very closely.  That is why it is so alarming that Chinese stocks peaked months ago.  Will the S&P 500 soon follow?

#8 The economic data coming out of the Chinese economy lately has been mostly terrible

For starters, China’s recent economic data, as massaged as it is to the upside, is downright awful. China’s PMI numbers were the worst in two years. Staffing levels in the Chinese service sector decreased for the first time since January 2009 (remember that year).

China’s LEI also shows no sign of recovery. If anything, it indicates China is heading towards an economic slowdown on par with that of 2008. And if you account for the rampant debt fueling China’s economy you could easily argue that China is posting 0% GDP growth today.

#9 Things just continue to get even worse over in Europe.  Unemployment in both Greece and Spain is now about 27 percent, and the unemployment rate in the eurozone as a whole has just set a brand new all-time record high.

#10 Crude inventories have soared to a record high as demand for energy continues to decline.  As I have written about previously, this is a clear sign that economic activity is slowing down.

#11 Casino spending is usually a strong indicator of the overall health of the U.S. economy.  That is why it is so noteworthy that casino spending is now back to levels that we have not seen since the last recession.

#12 The impact of the sequester cuts is starting to kick in.  According to the Congressional Budget Office, the sequester cuts will cost the U.S. economy about 750,000 jobs this year.

Do you have any other recession indicators that you would add to this list?

I invite you to share your thoughts by posting a comment below…

A Recession Is Coming - Photo by Angie from Sawara, Chiba-ken, Japan