
 When an economic crisis is coming, there are usually certain indicators that appear in advance. For example, commodity prices usually start to plunge before a recession begins. And as you can see from the Bloomberg Commodity Index which you can find right here, this has already been happening. In addition, I have previously written about how the U.S. dollar went on a great run just before the financial collapse of 2008. This is something that has also been happening over the past few months. Some people would have you believe that nobody can anticipate the next great economic downturn and that to try to do so is just an exercise in “guesswork”. But that is not the case at all. We can look back over history and see patterns that keep repeating. And a lot of the exact same patterns that happened just before previous stock market crashes are happening again right now.
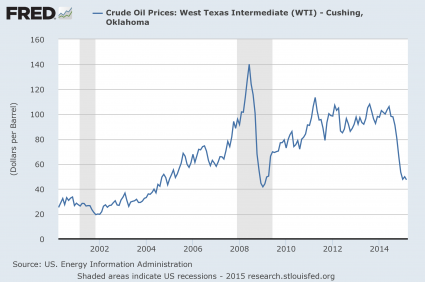
For example, let’s talk about the price of oil. There are only two times in history when the price of oil has fallen by more than 50 dollars in a six month time period. One was just before the financial crisis in 2008, and the other has just happened…
As a result of crashing oil prices, we are witnessing oil rigs shut down in the United States at a blistering pace. In fact, almost half of all oil rigs in the U.S. have already shut down. The following commentary and chart come from Wolf Richter…
In the latest week, drillers idled another 41 oil rigs, according to Baker Hughes. Only 825 rigs were still active, down 48.7% from October. In the 23 weeks since, drillers have idled 784 oil rigs, the steepest, deepest cliff-dive in the history of the data:
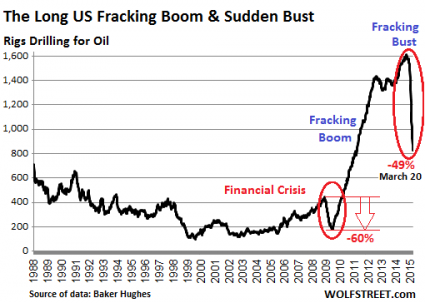
We are looking at a full-blown fracking bust, and this bust is already having a dramatic impact on the economies of states that are heavily dependent on the energy industry.
For example, just check out the disturbing number that just came out of Texas…
The crash in oil prices is hammering the Texas economy.
The latest manufacturing outlook index from the Dallas Fed plunged again in March, to -17.4 from -11.2 in February, indicating deteriorating business conditions in the state.
Ouch.
But this pain is going to be felt far beyond Texas. In recent years, Wall Street banks have made a massive amount of money packaging up energy industry loans, bonds, etc. and selling them off to investors.
If that sounds similar to the kind of behavior that preceded the subprime mortgage meltdown, that is because it is.
Now those loans, bonds, etc. are going bad as the fracking bust intensifies, and whoever is left holding all of this worthless paper at the end of the day is going to lose an extraordinary amount of money. Here is more from Wolf Richter…
It suited Wall Street just fine: according to Dealogic, banks extracted $31 billion in fees from the US oil and gas industry and its investors over the past five years by handling IPOs, spin-offs, “leveraged-loan” transactions, the sale of bonds and junk bonds, and M&A.
That’s $6 billion in fees per year! Over the last four years, these banks made over $4 billion in fees on just “leveraged loans.” These loans to over-indebted, junk-rated companies soared from about $40 billion in 2009 to $210 billion in 2014 before it came to a screeching halt.
For Wall Street it doesn’t matter what happens to these junk bonds and leveraged loans after they’ve been moved on to mutual funds where they can decompose sight-unseen. And it doesn’t matter to Wall Street what happens to leverage loans after they’ve been repackaged into highly rated Collateralized Loan Obligations that are then sold to others.
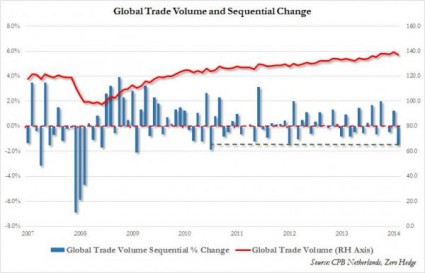
At the same time, we are also witnessing a slowdown in global trade. This usually happens when economic conditions are about to turn sour, and that is why it is so alarming that the total volume of global trade in January was down 1.4 percent from December. According to Tyler Durden of Zero Hedge, that was the largest drop since 2011…
Presenting the latest data from the CPB Netherlands Bureau for Economic Policy Analysis, according to which in January world trade by volume dropped by a whopping 1.4% from December: the biggest drop since 2011!
We are seeing some troubling signs in the U.S. as well.
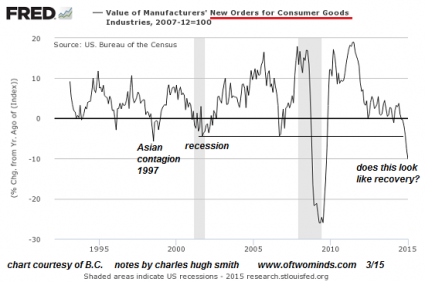
I shared the following chart in a previous article, but it bears repeating. It comes from Charles Hugh Smith, and it shows that new orders for consumer goods are falling at a rate not seen since the last recession…
Well, what about the stock market? It was up more than 200 points on Monday. Isn’t that good news?
Yes, but the euphoria on Wall Street will not last for long.
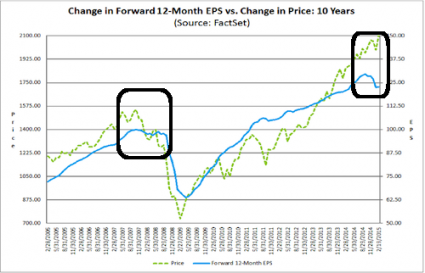
When corporate earnings per share either start flattening out or start to decline, that is a huge red flag. We saw this just prior to the stock market crash of 2008, and it is happening again right now. The following commentary and chart come from Phoenix Capital Research…
Take a look at the below chart showing current stock levels and changes in forward Earnings Per Share (EPS). Note, in particular how divergences between EPS and stocks tend to play out (hint look at 2007-2008).
We all know what came next.
And guess what?
According to CNBC, a lot of the “smart money” is pulling their money out of the stock market right now while the getting is good…
Recent market volatility has sent stock market investors rushing for the exits and into cash.
Outflows from equity-based funds in 2015 have reached their highest level since 2009, thanks to a seesaw market that has come under pressure from weak economic data, a stronger dollar and the the prospect of monetary tightening.
Funds that invest in stocks have seen $44 billion in outflows, or redemptions, year to date, according to Bank of America Merrill Lynch. Equity funds have seen outflows in five of the last six weeks, including $6.1 billion in just the last week.
It doesn’t matter if you are a millionaire “on paper” today.
What matters is if the money is going to be there when you really need it.
At the moment, a whole lot of people have been lulled into a false sense of complacency by the soaring stock market and by the bubble of false economic stability that we have been enjoying.
But under the surface, there is a whole lot of turmoil going on.
Those that are looking for the signs are going to see the next crisis approaching well in advance.
Those that are not are going to get absolutely blindsided by what is coming.
Don’t let that happen to you.