
 If the bond market is correct, the U.S. economy is definitely heading into a recession. Over the past 50 years, there have been six previous occasions when the yield on three-month Treasury bonds has risen above the yield on ten-year Treasury bonds, and in each of those instances a recession has followed. Now it has happened again, and this comes at a time when a whole host of other economic indicators are screaming that a recession is coming. Of course we have seen recession indicators triggered at other times in recent years, and the Federal Reserve was able to intervene and successfully extend this cycle on multiple occasions. But now that the global economy is clearly the weakest it has been since the last recession, have we finally reached a breaking point?
Many on Wall Street are taking what happened at the end of last week extremely seriously. According to CNBC, we have not seen a yield curve inversion of this nature in 3,009 trading days…
Short-term government fixed income yields are now ahead of the longer part of the curve, delivering a strong recession indication that hasn’t happened since 2007.
The spread, or yield curve, between the 3-month and 10-year Treasury notes just broke the longest streak ever of being above 10 basis points, or 0.1 percentage point. The two maturities were last below that level in September 2007, a run of 3,009 trading days, according to Bespoke Investment Group.
3,009 trading days is a very, very long time.
And now we will see how inverted the curve becomes, because as Zero Hedge has aptly pointed out, the more inverted the curve become the “higher the odds of a recession”…
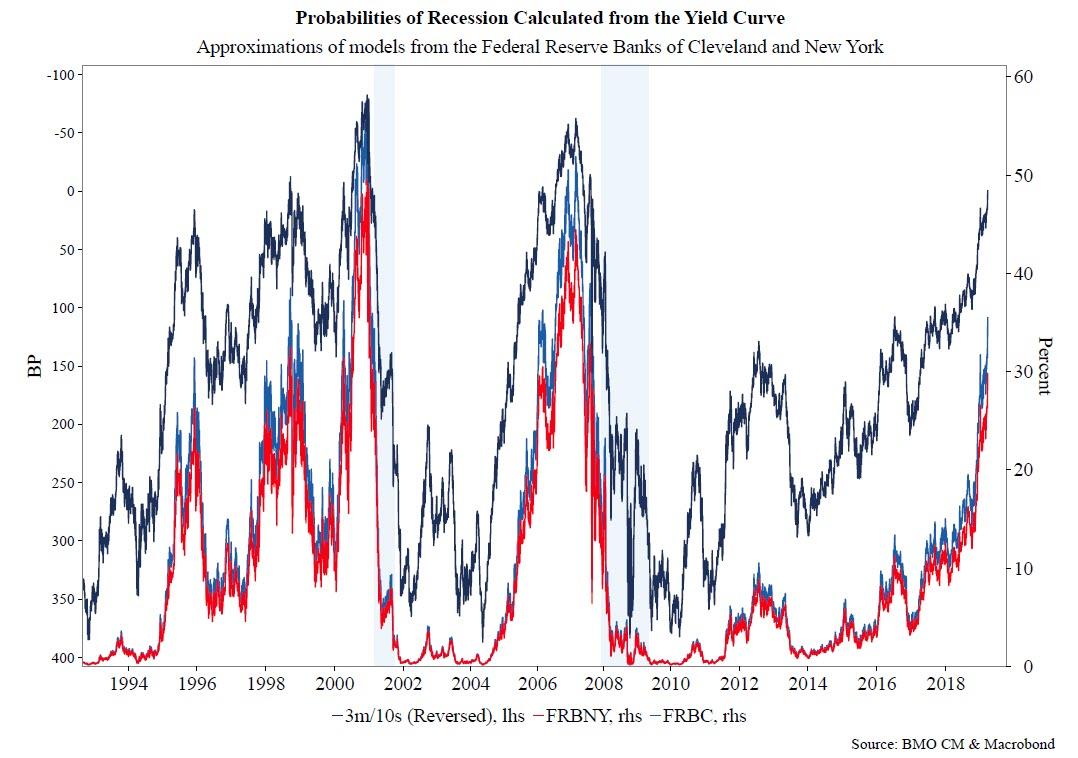
Why is the inversion of the 3 Month-10 Year curve – the first since 2007 – such a momentous occasion? Because not only is said inversion the most accurate recession leading indicator, having correctly “predicted” the last 6 recessions with no false positives, most recently inverting in 1989, in 2000 and in 2006, with recessions prompting starting in 1990, 2001 and 2008….
… it also feeds directly into every Wall Street recession model: the more inverted it is, the higher the odds of a recession.
To get an idea of what the models are currently showing, just check out this chart. At this moment, the odds of another recession are the highest they have been since the last one.
Many investors were hoping that the bond market would have better news for us on Monday, but instead things got even worse…
On Friday, markets were spooked when the yield curve inverted, a reliable recession signal though usually not an immediate one. That means the rate on a lower duration instrument rose above a longer duration security’s yield. In this case, it was the yield on the 3-month bill, at 2.44 percent Monday, moving above the 10-year yield, which sank as low as 2.38 percent, a more than 2-year low.
I know that just about everybody in America is writing about the Mueller Report right now, and I just posted an article about it too, but the outcome of that investigation is not going to change the trajectory of the global economy. It has been slowing down for quite some time, and that is the primary reason why we have seen an inversion of the yield curve…
“Yield curves are responding to what they see, to what I believe is a global economic slowdown,” said Peter Boockvar, chief investment officer at Bleakley Advisory Group. “You don’t see this kind of move in curves, not just here but everywhere, unless you get one.”
Global central banks are already jumping into action, and I expect a tremendous amount of intervention as global economic conditions continue to deteriorate.
But there is only so much that they can do, and even though they have pulled a few rabbits out of the hat in recent years, at some point they are going to completely lose control.
Already, we are starting to see things happen that are very reminiscent of the last recession. For example, we are on pace for the worst year for store closings in all of U.S. history, and another major retailer just announced that they will be closing all their stores…
LifeWay Christian Resources announced Wednesday that it will be closing all remaining 170 stores this year and focusing on online sales. Carol Pipes, director of corporate communications for LifeWay, posted the announcement on the company’s website, explaining that it was “a strategic shift of resources to a dynamic digital strategy.”
Communities all over America, especially the more economically-depressed ones, are going to start looking really bleak as the number of empty buildings continues to rise. This is something that I have warned about for a long time, and now it is happening on a massive scale.
As I end this article, I once again want to mention a factor that is going to have an enormous impact on our economy throughout the rest of this year. The flooding in the middle portion of the nation has destroyed thousands of farms, and the National Weather Service is warning that the flooding that we have seen so far is just “a preview of what we expect throughout the rest of the spring”. This is already the worst flooding disaster for U.S. farmers in modern American history, and it is going to get much, much worse.
We are going to see another huge surge in farm bankruptcies, thousands of farmers will not be able to plant crops at all this year, food prices are going to rise dramatically, and a lot of families all over America are going to have a real problem making their food budgets stretch far enough.
There are so many factors hammering our economy right now. If the Federal Reserve is able to pull another rabbit out of the hat this time, it will be nothing short of a major miracle.
We are literally at a critical tipping point, and it is not going to be easy to pull us back from the brink this time.
 About the author: Michael Snyder is a nationally-syndicated writer, media personality and political activist. He is the author of four books including Get Prepared Now, The Beginning Of The End and Living A Life That Really Matters. His articles are originally published on The Economic Collapse Blog, End Of The American Dream and The Most Important News. From there, his articles are republished on dozens of other prominent websites. If you would like to republish his articles, please feel free to do so. The more people that see this information the better, and we need to wake more people up while there is still time.

