Not Just Oil: Guess What Happened The Last Time Commodity Prices Crashed Like This?…

Financial Crisis - Public Domain
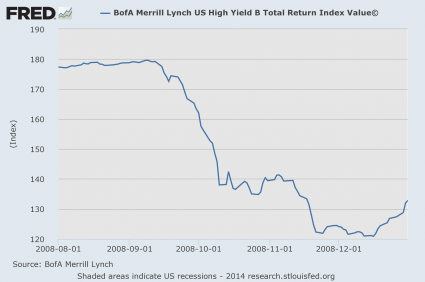
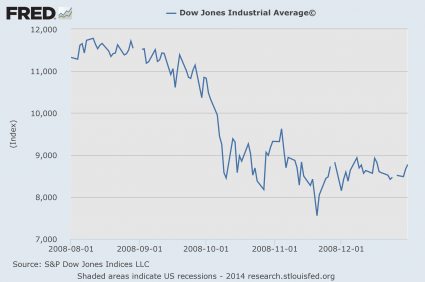
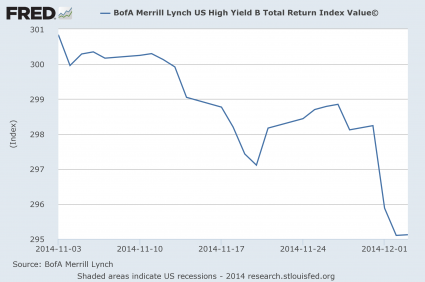
It isn’t just the price of oil that is collapsing.  The last time commodity prices were this low was during the immediate aftermath of the last financial crisis.  The Bloomberg Commodity Index fell to 110.4571 on Monday – the lowest that it has been since April 2009.  Just like junk bonds, industrial commodities are a very reliable leading indicator.  In other words, prices for industrial commodities usually start to move in a particular direction before the overall economy does.  We witnessed this in the summer of 2008 when a crash in commodity prices preceded the financial crisis in the fall by a couple of months.  And right now, we are witnessing what may be another major collapse in commodity prices.  In recent weeks, the price of copper has declined substantially.  So has the price of iron ore.  So has the price of nickel.  So has the price of aluminum.  You get the idea.  So this isn’t just about oil.  This is a broad-based commodity decline, and if it continues it is really bad news for the U.S. economy.

Of course most Americans would much rather read news stories about Kim Kardashian, but what is happening to the prices of these industrial metals at the moment is actually far more important to their daily lives.  For example, when the price of iron ore goes down that is a strong indication that economic activity is slowing down.  And that is why it is so troubling that the price of iron ore has almost sunk to a five year low.  The following comes from an Australian news source

The price of iron ore has held below $US70 a tonne in overnight trade, leaving its five-year low within reach.

At the end of the latest offshore session, benchmark iron ore for immediate delivery to the port of Tianjin in China was trading at $US69.40 a tonne, down 0.4 per cent from its previous close of $US69.70 a tonne and only 2 per cent above the five-year low of $US68 reached a fortnight ago.

This week’s dip back under $US70 a tonne has followed revised forecasts from JPMorgan that suggest the commodity will average just $US67 a tonne next year, about $US20 below the investment bank’s previous expectation.

Copper is probably an even better economic indicator than iron ore is.  Economists commonly refer to it as “Dr. Copper”, and there is a really good reason for that.  Looking back over history, the price of copper often makes a significant move in one direction or the other before the economy does.  And now that the price of copper just hit the lowest level that we have seen since the last financial crash, alarm bells are going off.  The following comes from an article by CNBC contributor Ron Insana

Copper prices are now below $3 a pound and there’s an expression that “the economy is topped with a copper roof.” More simply put, copper tends to top out in price, before it becomes obvious that, in this case, the global economy is about to weaken.

So is the global economy heading for rough waters?

Could 2015 be a very rough year economically?

According to Insana, the signs are all around us…

We already have evidence that the commodity crash has ominous portents for the rest of the world:

* Japan’s recession is deeper than previously thought.

* China’s demand for basic materials, amid a glut of uneconomic construction projects, appears to be plummeting.

* Russia’s ruble has collapsed and the country is on the brink, if not already in, a recession.

* India’s economic recovery is beginning to look shaky.

* Europe’s growth rate and inflation rate, for the next two years, were just revised downward by the European Central Bank, suggesting that Europe’s economic crisis is far from over. In fact, at least one former European leader with whom I recently spoke, believes the crisis in Europe may just be in its early stages.

* Brazil and other emerging market nations are struggling with a variety of issues, from recessions at home, to the rising value of the dollar, which is complicating how emerging markets conduct economic policies at home, given how closely their currencies are tied to the greenback.

In addition, the Baltic Dry Index is now at the lowest point that we have seen at this time of the year since 2008

Simply put, with collapsing commodity prices (iron ore for instance) and massive fleets of credit-driven mal-investment-based vessels, it should surprise no one that the shipping index just plunged back below 1000, now at its lowest for this time of year since 2008. Furthermore, the seasonal bounce always seen in Q3 was among the weakest ever.

What does all of this mean?

It is commonly said that those that do not learn from history are doomed to repeat it.

So many of the exact same patterns that we witnessed leading up to the financial crash of 2008 are happening again.

Unfortunately, very few people saw the last crash coming, and this next crash will take most Americans by surprise as well.

I have written more than 1,200 articles about the economy on my website since 2009, and right now our financial system is more primed for a crash than at any other time since I started The Economic Collapse Blog.

Hopefully we have at least a couple more months of relative stability, but without a doubt 2015 is shaping up to be the most “interesting” year that we have seen in the financial world in a very long time.

All of the signs are there.  But most people choose to believe that everything is going to be okay somehow.  When the next crash comes, those people are going to be absolutely blindsided by it.

When you see storm clouds on the horizon, the logical thing to do is to prepare.  And the number one thing that most people should be working on is an emergency fund.  So don’t be frittering your money away on frivolous things.  In the early stages of this next crisis, you are going to need money to pay the mortgage, to put food on the table and to take care of your family.

Just remember what happened back in 2008.  A lot of middle class families were living on the financial edge every month, and because they didn’t have any cushion to fall back on, millions of those families ended up losing their homes when their jobs disappeared.

You need to have an emergency fund that can cover at least six months of expenses.  You don’t want a job loss or a major emergency to put you into a situation where your family could be put out into the street.

And for those that still have lots of money invested in the stock market – I really hope that you know what you are doing.

The market giveth, and the market taketh away.

And when the market taketh away, the consequences can often be exceedingly cruel.


‘Near Perfect’ Indicator That Precedes Almost Every Stock Market Correction Is Flashing A Warning Signal

Exclamation Marks - Public DomainAre we about to see U.S. stocks take a significant tumble?  If you are looking for a “canary in the coal mine” for the U.S. stock market, just look at high yield bonds.  In recent years, almost every single time junk bonds have declined substantially there has been a notable stock market correction as well.  And right now high yield bonds are steadily moving lower.  The biggest reason for this is falling oil prices.  As I wrote about the other day, energy companies now account for about 20 percent of the high yield bond market.  As the price of oil falls, investors are understandably becoming concerned about the future prospects of those companies and are dumping their bonds.  What is happening cannot be described as a “crash” just yet, but there has been a pretty sizable decline for junk bonds over the past month.  And as I noted above, junk bonds and stocks usually move in tandem.  In fact, junk bonds usually start falling before stocks do.  So does the decline in high yield bonds that we are witnessing at the moment indicate that we are on the verge of a significant stock market correction?

That is a question that CNBC asked in a recent article entitled “Near perfect sell signal says stocks should drop“…

The S&P 500 and the iShares iBoxx High Yield Corporate Bond ETF are a mirror image since the start of the year, but since the end of October, high yield has diverged to the lower right, and yet the S&P 500 has continued to record highs. Since separating in October, the S&P 500 is up 3 percent, while the high-yield ETF is down 4 percent.

On 10 occasions since 2007, the high-yield ETF dropped 5 percent in 30 trading days. During nine of those instances, the S&P 500 fell as well, with an average return of negative 9 percent, according to CNBC analysis using Kensho.

Only once did high yield give a false sell signal. That was last year, when the market was already entranced by the Federal Reserve’s quantitative easing program, which has seemed to elevate stocks with an abnormal consistency. And even then, the S&P 500 managed just a 0.4 percent climb amid the junk debt rout.

Personally, I am convinced that this correlation between junk bonds and stocks is very significant.

Let’s just go back and look at what happened during the financial crash of 2008 for a moment.

In the chart posted below, you can see that high yield bonds began crashing in the middle of September that year…

High Yield Bonds 2008

But U.S. stocks did not crash at the same time.  In fact, the chart below shows that they did not really begin crashing until early October…

Dow Jones Industrial Average 2008

That is why analysts often refer to junk bonds as a “leading indicator”.  What happens to high yield debt is often a really good indicator of what is about to happen to stocks.

Now let’s take a look at what is happening today.

Since the beginning of November, junk bonds have been falling steadily…

High Yield Bonds November

Meanwhile, the Dow has continued to reach new heights…

Dow Jones Industrial Average November

This is not a state of affairs that can persist indefinitely.  Either junk bonds will rebound or U.S. stocks will start falling.

If the U.S. economy was on solid footing, you could perhaps argue that it could go either way.

Unfortunately, that is not the case.  At this point, the stock market has become completely divorced from economic fundamentals.  Price to earnings ratios are at absurd levels, margin debt is hovering near record highs, and the “real economy” continues to fall apart.  We are enjoying a massively inflated standard of living which is being propped up by the largest mountain of debt in world history, and it is only a matter of time before reality starts catching up with us.

And the signs of our long-term economic decline are all around us if you are willing to look at them.  For example, the lead headline on the Drudge Report today was about how China has now overtaken us and has become the largest economy on the planet

Hang on to your hats, America.

And throw away that big, fat styrofoam finger while you’re about it.

There’s no easy way to say this, so I’ll just say it: We’re no longer No. 1. Today, we’re No. 2. Yes, it’s official. The Chinese economy just overtook the United States economy to become the largest in the world. For the first time since Ulysses S. Grant was president, America is not the leading economic power on the planet.

It just happened — and almost nobody noticed.

The International Monetary Fund recently released the latest numbers for the world economy. And when you measure national economic output in “real” terms of goods and services, China will this year produce $17.6 trillion — compared with $17.4 trillion for the U.S.A.

Meanwhile, some of the most iconic companies in the United States continue to struggle deeply.  For instance, Sears has just announced that the number of store closings for this year is going to reach a total of 235 and that the company lost more than half a billion dollars during the third quarter of 2014 alone…

Sears Holdings Corp., posted a disappointing third quarter Thursday that saw revenue, earnings, and sales at stores open at least a year all fall as the retailer tries to salvage its business.

Sears, which owns Kmart, lost $548 million, or $5.15 a share, for the period ended Nov. 1. That’s up from a loss of $534 million, or $5.03 a share, in the year-ago period.

Even though Sears is losing more than 500 million dollars a quarter, banks and investors continue to inject new money into the corporation.  That is a crying shame, because Sears is a company that is going to zero.  Anyone that is investing in Sears at this point is just pouring their money into a black hole.  As Kevin O’Leary would say, they are guilty of murdering money.

And of course what is happening to Sears is just part of the broader “retail apocalypse” that I keep writing about.  In order for retailers to thrive they need healthy consumers, and consumers are not financially healthy because the real economy is a disaster zone.

But these days so many people are in denial.  The stock market has been soaring for so long that many skeptics are now proclaiming that another 2008-style crash will never happen.  Even though the fact that we are in the midst of an absolutely insane financial bubble should be glaringly obvious to anyone with half a brain, these skeptics have convinced themselves that the current state of affairs can persist indefinitely.

Sadly, it looks like what is about to hit us in 2015 is going to serve as a very rude wake up call for them and for the millions of other Americans that currently have their heads in the sand.

Guess What Happened The Last Time The Price Of Oil Crashed Like This?…

Price Of Oil Causes A Junk Bond Crash - Public DomainThere has only been one other time in history when the price of oil has crashed by more than 40 dollars in less than 6 months.  The last time this happened was during the second half of 2008, and the beginning of that oil price crash preceded the great financial collapse that happened later that year by several months.  Well, now it is happening again, but this time the stakes are even higher.  When the price of oil falls dramatically, that is a sign that economic activity is slowing down.  It can also have a tremendously destabilizing affect on financial markets.  As you will read about below, energy companies now account for approximately 20 percent of the junk bond market.  And a junk bond implosion is usually a signal that a major stock market crash is on the way.  So if you are looking for a “canary in the coal mine”, keep your eye on the performance of energy junk bonds.  If they begin to collapse, that is a sign that all hell is about to break loose on Wall Street.

It would be difficult to overstate the importance of the shale oil boom to the U.S. economy.  Thanks to this boom, the United States has become the largest oil producer on the entire planet.

Yes, the U.S. now actually produces more oil than either Saudi Arabia or Russia.  This “revolution” has resulted in the creation of  millions of jobs since the last recession, and it has been one of the key factors that has kept the percentage of Americans that are employed fairly stable.

Unfortunately, the shale oil boom is coming to an abrupt end.  As a recent Vox article discussed, OPEC has essentially declared a price war on U.S. shale oil producers…

For all intents and purposes, OPEC is now engaged in a “price war” with the United States. What that means is that it’s very cheap to pump oil out of places like Saudi Arabia and Kuwait. But it’s more expensive to extract oil from shale formations in places like Texas and North Dakota. So as the price of oil keeps falling, some US producers may become unprofitable and go out of business. The result? Oil prices will stabilize and OPEC maintains its market share.

If the price of oil stays at this level or continues falling, we will see a significant number of U.S. shale oil companies go out of business and large numbers of jobs will be lost.  The Saudis know how to play hardball, and they are absolutely ruthless.  In fact, we have seen this kind of scenario happen before

Robert McNally, a White House adviser to former President George W. Bush and president of the Rapidan Group energy consultancy, told Reuters that Saudi Arabia “will accept a price decline necessary to sweat whatever supply cuts are needed to balance the market out of the US shale oil sector.” Even legendary oil man T. Boone Pickens believes Saudi Arabia is in a stand-off with US drillers and frackers to “see how the shale boys are going to stand up to a cheaper price.” This has happened once before. By the mid-1980’s, as oil output from Alaska’s North Slope and the North Sea came on line (combined production of around 5-6 million barrels a day), OPEC set off a price war to compete for market share. As a result, the price of oil sank from around $40 to just under $10 a barrel by 1986.

But the energy sector has been one of the only bright spots for the U.S. economy in recent years.  If this sector starts collapsing, it is going to have a dramatic negative impact on our economic outlook.  For example, just consider the following numbers from a recent Business Insider article

Specifically, if prices get too low, then energy companies won’t be able to cover the cost of production in the US. This spending by energy companies, also known as capital expenditures, is responsible for a lot of jobs.

“The Energy sector accounts for roughly one-third of S&P 500 capex and nearly 25% of combined capex and R&D spending,” Goldman Sachs’ Amanda Sneider writes.

Even more troubling is what this could mean for the financial markets.

As I mentioned above, energy companies now account for close to 20 percent of the entire junk bond market.  As those companies start to fail and those bonds start to go bad, that is going to hit our major banks really hard

Everyone could suffer if the collapse triggers a wave of defaults through the high-yield debt market, and in turn, hits stocks. The first to fall: the banks that were last hit by the housing crisis.

Why could that happen?

Well, energy companies make up anywhere from 15 to 20 percent of all U.S. junk debt, according to various sources.

It would be hard to overstate the seriousness of what the markets could potentially be facing.

One analyst summed it up to CNBC this way

This is the one thing I’ve seen over and over again,” said Larry McDonald, head of U.S strategy at Newedge USA’s macro group. “When high yield underperforms equity, a major credit event occurs. It’s the canary in the coal mine.

The last time junk bonds collapsed, a major stock market crash followed fairly rapidly.

And those that were hardest hit were the big Wall Street banks

During the last high-yield collapse, which centered around debt tied to the housing sector, Citigroup lost 63 percent of its value in the following 60 days, Kensho shows. Bank of America was cut in half.

I understand that some of this information is too technical for a lot of people, but the bottom line is this…

Watch junk bonds.  When they start crashing it is a sign that a major stock market collapse is right at the door.

At this point, even the mainstream media is warning about this.  Just consider the following excerpt from a recent CNN article

That swing away from junk bonds often happens shortly before stock market downturns.

“High yield does provide useful sell signals to equity investors,” Barclays analysts concluded in a recent report.

Barclays combed through the past dozen years of data. The warning signal they found is a 30% or greater increase in the spread between Treasuries and junk bonds before a dip.

If you have been waiting for the next major financial collapse, what you have just read in this article indicates that it is now closer than it has ever been.

Over the coming weeks, keep your eye on the price of oil, keep your eye on the junk bond market and keep your eye on the big banks.

Trouble is brewing, and nobody is quite sure exactly what comes next.

14 Reasons Why The U.S. Economy’s Bubble Of False Prosperity May Be About To Burst

Bubbles - Public DomainDid you know that a major event just happened in the financial markets that we have not seen since the financial crisis of 2008?  If you rely on the mainstream media for your news, you probably didn’t even hear about it.  Just prior to the last stock market crash, a massive amount of money was pulled out of junk bonds.  Now it is happening again.  In fact, as you will read about below, the market for high yield bonds just experienced “a 6-sigma event”.  But this is not the only indication that the U.S. economy could be on the verge of very hard times.  Retail sales are extremely disappointing, mortgage applications are at a 14 year low and growing geopolitical storms around the world have investors spooked.  For a long time now, we have been enjoying a period of relative economic stability even though our underlying economic fundamentals continue to get even worse.  Unfortunately, there are now a bunch of signs that this period of relative stability is about to end.  The following are 14 reasons why the U.S. economy’s bubble of false prosperity may be about to burst…

#1 The U.S. junk bond market just experienced “a 6-sigma event” earlier this month.  In other words, it is an event that is only supposed to have a chance of 1 in 500 million of happening.  Billions of dollars are being pulled out of junk bonds right now, and that has some analysts wondering if a financial crash is right around the corner.

#2 The last time that we saw a junk bond rout of this magnitude was back during the financial crash of 2008.  In fact, as the Telegraph recently explained, bonds usually crash before stocks do…

The credit market usually leads the equity market during turning points, as happened when credit markets cracked first in 2008.

Will the same thing happen this time around?

#3 Retail sales have missed expectations for three months in a row and we just had the worst reading since January.

#4 Things have gotten so bad that even Wal-Mart is really struggling.  Same-store sales at Wal-Mart have declined for five quarters in a row and the outlook for the future is not particularly promising.

#5 The four week moving average for mortgage applications just hit a 14 year low.  It is now even lower than it was during the worst moments of the financial crisis of 2008.

#6 The tech industry is supposed to be booming, but mass layoffs in the tech industry are actually 68 percent ahead of last year’s pace.

#7 According to the Federal Reserve, 40 percent of all households in the United States are currently showing signs of financial stress.

#8 The U.S. homeownership rate has fallen to the lowest level since 1995.

#9 According to one survey, 76 percent of Americans do not have enough money saved to cover six months of expenses.

#10 Rumblings of a stock market correction have become so loud that even the mainstream media is reporting on it.  For example, just check out this CNN headline from earlier this month: “Is a correction near? Wall Street on edge“.

#11 The civil war in Iraq is spiraling out of control, and Barack Obama has just announced that he is going to send 130 troops to the country in a “humanitarian” capacity.  Iraq is the 7th largest oil producing nation on the entire planet, and if the flow of oil is disrupted that could have serious consequences.

#12 As a result of the conflict in Ukraine, the United States, Canada and the European Union have slapped sanctions on Russia.  In return, Russia has slapped sanctions on them.  Will this slowdown in global trade significantly harm the U.S. economy?

#13 The three day cease-fire between Hamas and Israel is about to end, and Hamas officials are saying that they are preparing for a “long battle“.  If a resolution is not found soon, we could potentially see a full-blown regional war erupt in the Middle East.

#14 The number of Ebola deaths continues to grow at an exponential rate, and if the virus starts spreading inside the United States it has the potential to pretty much shut down our entire economy.

Meanwhile, things look even more dire in much of the rest of the globe.

For example, the economic slowdown has gotten so bad in some nations over in Europe that they are actually experiencing deflation

Portugal has crashed into deep deflation and Italy’s inflation rate has fallen to zero as the eurozone flirts with recession, automatically pushing these countries further towards a debt compound spiral.

The slide comes amid signs of a deepening slowdown in the eurozone core, with even Germany flirting with possible recession. Germany’s ZEW index of investor confidence plunged from 27.1 to 8.6 in July, the sharpest fall since June 2012, during the European sovereign debt crisis. “The European Central Bank has to act now,” said Andrew Roberts, credit chief at RBS.

And in Japan, GDP just contracted at a 6.8 percent annual rate during the second quarter…

Japan’s economy suffered its worst contraction since 2011 in the second quarter as consumer spending on big items slumped in the wake of a sales tax rise.

Gross domestic product shrunk by an annualized 6.8% in the three months ended June, Japan’s Cabinet Office said Wednesday. The result was actually better than the 7% contraction expected by economists.

On a quarterly basis, Japan’s GDP dropped by 1.7% as business and housing investment declined. Japan’s economy last suffered a hit of this magnitude after the 2011 tsunami and nuclear disaster.

There is no way that this bubble of false prosperity was going to last forever.  It was never real to begin with.  It was just based on a pyramid of debt and false promises.  In fact, the condition of the global financial system is now far worse than it was just prior to the financial crisis of 2008.

Sadly, most people do not understand these things.  Most people just assume that our leaders have fixed whatever caused the problems last time.  And when the next crisis arrives, they will be totally blindsided by it.