
 When less stuff is being bought, sold and shipped around the country with each passing month, how in the world can the U.S. economy be in “good shape”? Unlike official government statistics which are often based largely on projections, assumptions and numbers seemingly made up out of thin air, the Cass Freight index is based on real transactions conducted by real shipping companies. And what the Cass Freight Index is telling us about the state of the U.S. economy in 2016 lines up perfectly with all of the other statistics that are clearly indicating that we have now shifted into recession mode.
If you are not familiar with the Cass Freight Index, here is a definition of the index from the official Cass website…
Since 1995, the Cass Freight Index™ has been a trusted measure of North American freight volumes and expenditures. Our monthly Cass Freight Index Report provides valuable insight into freight trends as they relate to other economic and supply chain indicators and the overall economy.
Data within the Index includes all domestic freight modes and is derived from $25 billion in freight transactions processed by Cass annually on behalf of its client base of hundreds of large shippers. These companies represent a broad sampling of industries including consumer packaged goods, food, automotive, chemical, OEM, retail and heavy equipment. Annual freight volume per organization ranges from $1 million to over $1 billion. The diversity of shippers and aggregate volume provide a statistically valid representation of North American shipping activity.
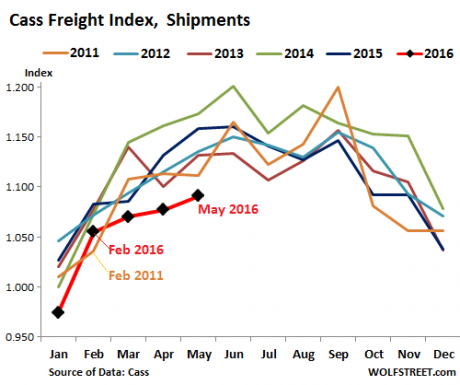
When they say “all domestic freight modes”, that includes air, rail, truck, etc. As you are about to see, the total amount of stuff that is being bought, sold and shipped around the country by all these various methods has now been declining for 15 months in a row.
If it was just one or two months you could say that it was just an anomaly, but how in the world can anyone explain away 15 consecutive months?
Not only that, but the brand new number that just came out for May 2016 is the lowest number that we have seen for the month of May in 6 years.
Of course the number for April was the lowest number that we have seen for that month in 6 years too, and the number for March was also the lowest number that we have seen for that month in 6 years.
Are you starting to get the picture?
Below is some analysis of these numbers and a chart from Wolf Richter…
The Index is not seasonally or otherwise adjusted, so it shows strong seasonal patterns. In the chart below, the red line with black markers is for 2016. The colorful spaghetti above that line represents the years 2011 through 2015. The only month this year that was not the worst month since 2010 was February; only February 2011 was worse. That’s how bad it has gotten in the Freight sector:
“Truck tonnage continues to slide for both linehaul and spot markets,” according to the report. And railroads are also singing the blues.
To me, these numbers are absolutely staggering. How anyone can look at them and then attempt to claim that the U.S. economy is heading for good times is a mystery to me.
And this is especially true considering all of the other news that is pouring in. Just today, we learned that new home sales have fallen by the most in 8 months. If you are trying to sell your home, hopefully you will get that done very quickly, because this latest property bubble is starting to burst in a major way.
Of course there are many, many more numbers that tell us that a new U.S. economic crisis has already begun and has been going on for quite a while. If you doubt this at all, please carefully read my previous article entitled “15 Facts About The Imploding U.S. Economy That The Mainstream Media Doesn’t Want You To See“.
Today, I also came across a stunning IMF report that was just released that criticized the U.S. for our shrinking middle class and our rising levels of poverty…
A rising share of the U.S. labor force is shifting into retirement, basic infrastructure is crumbling, productivity gains are scanty, and labor markets and businesses appear less adept at reallocating human and physical capital. These growing headwinds are overlaid by pernicious secular trends in income: labor’s share of income is around 5 percent lower today than it was 15 years ago, the middle class has shrunk to its smallest size in the last 30 years, the income and wealth distribution are increasingly polarized, and poverty has risen.
If you follow my work on a regular basis, you already know that everything that the IMF said in that paragraph is true.
A little bit later in the report, the IMF shared some absolutely startling facts about the growth of poverty in this country…
There is an urgent need to tackle poverty. In the latest data, 1 in 7 Americans is living in poverty, including 1 in 5 children and 1 in 3 female-headed households. Around 40 percent of those in poverty are working.
This distressing growth in our poverty numbers has taken place during Barack Obama’s so-called “economic recovery”.
So how bad are things ultimately going to get for America’s poor now that a new economic crisis has begun?
Before I wrap up this article, I have to mention the early returns from the Brexit vote. All day on Thursday, global news sources were reporting that the latest polls had “Remain” comfortably in the lead, and global financial markets soared on that news.
But now that the actual votes are being reported, it looks like it is going to be much, much closer than anticipated. In fact, as I write this article “Leave” is ahead by a 54.16 percent to 45.84 percent margin. Only a relatively small fraction of the votes have been counted so far, but global financial markets are already being spooked by these results.
If “Leave” does actually win, that is going to have enormous implications for the markets and for the future of Europe. So let’s keep a close eye on what is happening. If “Leave” does prove to be victorious, that will be one of the biggest things to hit Europe in decades, and I am sure that I will be posting an article about it tomorrow.
We live at a time when global events are beginning to accelerate, and there is much uncertainty in the air. If you do not have a solid foundation on which to stand, the events of the coming months will likely shake you greatly. I encourage everyone to start focusing on the things that really matter, because a lot of the other things that we obsess over will soon become quite insignificant.
—–
UPDATE: It is official – the United Kingdom has voted to leave the European Union. They are to be greatly congratulated for declaring their independence, but without a doubt this vote is going to cause some very serious short-term economic and financial pain. Already we have witnessed the greatest one day crash in the history of the British pound, and stock markets all over the world are crashing. For much more, please see our latest video update…