Are We On The Verge Of A Massive Stock Market Crash?

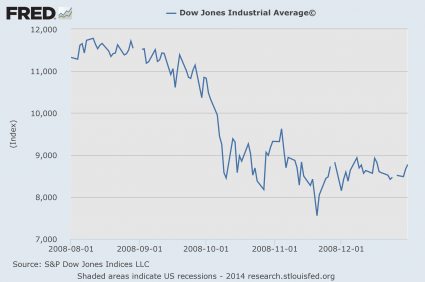
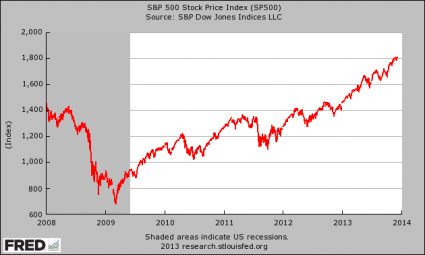
Is time finally running out for “the bubble to end all bubbles”?  Over the past year, we have seen stock prices rise to levels that are completely and utterly absurd, and many have pointed out that we are currently in the largest stock market bubble in the entire history of our nation.  Of course this bubble will end the way that all of our other stock market bubbles eventually ended, and recent market activity has a lot of people wondering if the time for that is drawing near.  Signs of trouble have been percolating on Wall Street for weeks, and on Monday we finally witnessed an eruption of full-blown fear.  The Dow Jones Industrial Average was down 725 points, and that represented the worst day for the index since last October.  But one really bad day is not a crisis, and even though many individual stocks have already plunged into bear market territory, we have a long, long way to go before people start using the word “crash”.  In fact, I don’t think that anyone should even think of using the word “crash” until the Dow drops below 30,000.

But without a doubt, a crash is inevitably coming.

Whether it happens this month, next month or next year, stock prices will plummet from these ridiculously inflated levels.

As for the plunge that happened on Monday, many are blaming it on fears about the “Delta variant”

“It’s a bit of an overreaction, but when you have a market that’s at record highs, that’s had the kind of run we’ve had, with virtually no pullback, it becomes extremely vulnerable to any sort of bad news,” said Randy Frederick, vice president of trading & derivatives at Charles Schwab. “It was just a matter of what that tipping point was, and it seems we finally reached that this morning” with worries about the delta variant.

To me, there are other issues that are of much greater concern, but apparently this is what is spooking investors this week.

According to CNBC, the number of newly confirmed COVID cases per week has more than doubled over the past month…

Covid cases have rebounded in the U.S. this month, with the delta variant spreading among the unvaccinated. The U.S. is averaging nearly 26,000 new cases a day in the last seven days through Sunday, up from a seven-day average of around 11,000 cases a day a month ago, according to CDC data. Cases were already flaring up around the world because of the delta variant.

Now that the market has started to fall, some experts are warning that the drop could be quite substantial.

For example, one Morgan Stanley strategist believes that we could eventually see a “correction” of 10 to 20 percent…

“The market appears ready to take on a more defensive character as we experience a meaningful deceleration in earnings and economic growth,” Morgan Stanley chief U.S. equity strategist Mike Wilson said in a note Monday. “Market breadth has been deteriorating for months and is just another confirmation of the mid-cycle transition, in our view. It usually ends with a material (10-20%) index level correction.”

Actually, if that is the worst that happens we will be quite fortunate.

In recent days, the mood on Wall Street has shifted dramatically.  In fact, the CNN Fear & Greed Index is now sitting at 16 which is considered to be in the “extreme fear” range, and the VIX has been soaring.

As our friends at Zero Hedge have pointed out, the last time we witnessed this much fear on Wall Street the S&P 500 was absolutely plummeting…

With the S&P 500 around 3.5% off its record highs, we note that fear has exploded. The last time fear was this high, the S&P was down 40%!…

We shall watch and see what happens this time around.

Zero Hedge has also pointed out that Goldman Sachs has been aggressively selling off billions of dollars worth of stocks recently…

What is even more remarkable is just how much Goldman has harvested so far in 2021: as shown below, having started with a $20BN equity portfolio which has enjoyed a $5BN increase in market prices, Goldman dumped a whopping $5.5 billion of its equity assets so far (excluding a modest $1.5BN in purchases) or more than a quarter of its entire portfolio as of Dec 31.

This is not normal for Goldman Sachs.

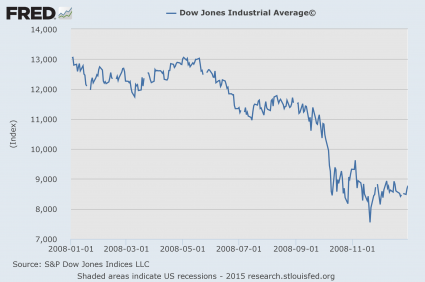
In fact, you have to go all the way back to just before the financial crisis of 2008 to find another time when they did such a thing…

The last time Goldman was “aggressively” selling into a “supportive” market? Well, we have to go back all the way to 2007 and 2008 when Goldman was busy creating the very CDOs which its prop desk would then “aggressively” short.

We all remember how prophetic that particular move turned out to be…

That is “interesting” to say the least.

But as big financial institutions such as Goldman Sachs are dumping stocks, talking heads on television continue to assure all of us that a wonderful new era of great prosperity is just ahead.  Just check out what Bill Ackman told CNBC on Monday

Billionaire investor Bill Ackman said Monday that the spread of the delta variant doesn’t pose a significant threat to the economic reopening, and he sees interest rates rising on the back of the big comeback.

“I hope what it does is that it motivates anyone who doesn’t get the vaccine to get the vaccine. I don’t think it’s going to change behavior to a great extent,” Ackman said in a interview on CNBC’s “Squawk Box.” “You are going to see a massive, my view, economic boom. … We are going to have an extremely strong economy coming in the fall.”

Wouldn’t it be nice if he was right?

I would love to see a “massive” economic boom.

Unfortunately, I don’t believe that is going to happen.  In fact, I believe that we are rapidly approaching some of the most difficult economic times that we have ever seen.

The laws of economics cannot be ignored forever.  The federal government is now 28 trillion dollars in debt, we are in the midst of the greatest corporate debt binge of all time, and U.S. consumers continue to go into debt as if tomorrow will never arrive.

But tomorrow always arrives eventually, and our “tomorrow” is going to be a day of reckoning that is going to be far more painful than most people would dare to imagine.

***It is finally here! Michael’s new book entitled “7 Year Apocalypse” is now available in paperback and for the Kindle on Amazon.***

About the Author: My name is Michael Snyder and my brand new book entitled “7 Year Apocalypse” is now available on Amazon.com.  In addition to my new book I have written five others that are available on Amazon.com including  “Lost Prophecies Of The Future Of America”“The Beginning Of The End”“Get Prepared Now”, and “Living A Life That Really Matters”. (#CommissionsEarned)  By purchasing the books you help to support the work that my wife and I are doing, and by giving it to others you help to multiply the impact that we are having on people all over the globe.  I have published thousands of articles on The Economic Collapse BlogEnd Of The American Dream and The Most Important News, and the articles that I publish on those sites are republished on dozens of other prominent websites all over the globe.  I always freely and happily allow others to republish my articles on their own websites, but I also ask that they include this “About the Author” section with each article.  The material contained in this article is for general information purposes only, and readers should consult licensed professionals before making any legal, business, financial or health decisions.  I encourage you to follow me on social media on Facebook and Twitter, and any way that you can share these articles with others is a great help.  During these very challenging times, people will need hope more than ever before, and it is our goal to share the gospel of Jesus Christ with as many people as we possibly can.

September 2015 Sure Started Off With Quite A Bang, Eh?

Bang Explosion - Public DomainAfter enduring their worst August in 17 years, U.S. stocks are off to their worst start to a September in 13 years.  Just yesterday, I declared that we would be entering the “danger zone” this month, and it didn’t take long for the action to begin.  Historically, this month is the worst month of the year for stocks, and most of the biggest stock market crashes throughout our history have come in the fall.  On Tuesday, the Dow plunged another 469 points, and it is now down more than 10 percent from the peak of the market back in May.  That means that we have officially entered “correction” territory.  Asian stocks also crashed hard on Tuesday, so did European stocks, and the price of oil plummeted about 8 percent.  For a long time, there have been a lot of people out there that have been warning that a financial crisis would happen in the second half of 2015, and they are being proven right.  It is actually happening.

Of course there will be plenty of ups and downs still to come.  I cannot emphasize enough that we should fully expect waves of panic selling and waves of panic buying.  This always happens during any market crash.

For instance, just consider what happened when the tech bubble crashed.  The following analysis comes from Graham Summers

In a six month period, investors moved stocks down 19%, up 8%, then down 27%, then up 21%, then down 22%, then up 34%, then down 17%, then up 16%, then down 28%, then up 16%, and finally down 17%. Only at that point did stocks break their trendline for the bubble (the blue line) and it became obvious that the bubble had burst.

My point with all of this is that even when the bubble was both very specific AND obvious, the collapse was neither quick nor clean. There were several large 20%+ crashes, but overall, it was a roller coaster with jarring rallies that gradually wore its way down.

It was a full-blown market collapse, and yet there were moments when the market absolutely skyrocketed.

The same thing happened in 2008.  In fact, the best two days in stock market history were right in the middle of the last financial crisis.

So don’t be fooled by what happens on any one particular day.  Huge up days and huge down days are both red flags.

If the market is going to recover any time soon, what we need are nice quiet days without much volatility.  Unfortunately, that is not likely to happen any time soon because a tremendous amount of damage has already been done and some massive imbalances have already developed.  I like how Richard Smith put it recently…

Serious damage has been done to the financial markets in the past two weeks – very serious. Don’t let anyone tell you otherwise.

No one should be kidding themselves that what’s happened in the past two weeks is just a little late summer blip – building up some energy to rally into the fall and winter. I’m not saying it couldn’t happen but it isn’t the odds play.

Everywhere I look, technical damage has been done – and it’s like nothing we’ve seen since 2008.

Yes, the mainstream media is telling everyone that they shouldn’t panic and that everything will be just fine, but those that study the charts for a living know what is really happening.  For months, I have been telling you over and over that things were setting up in textbook fashion for another financial crisis, and other experts have been seeing the exact same things that I have been seeing.  For example, just consider what Louise Yamada told CNBC

Looking at a chart of the S&P 500, Louise Yamada noted that momentum has been declining for four months, which by her work, is a “classic” sell signal.

“This is suggesting to me that we are looking at a bear market,” said Yamada said Tuesday on CNBC’s “Futures Now.” Yamada noted that the last two times the market saw a similar shift in momentum were in January 2008 and June 2000.

Right now, a lot of people are very confused about what to do.  Those that told them to buy stocks in the first place are telling them to buy even more stocks.  And of course the mainstream media is telling them that everything is going to be just wonderful after this “correction” runs its course.  But at the same time a lot of people have a gut feeling that things are about to get really bad.

Personally, I think that what John Hussman shared in his recent newsletter contains a lot of wisdom…

“If you’re taking more equity risk than you can actually tolerate if the market goes south, setting your portfolio right isn’t a market call – it’s just sound financial planning. It’s only fun to be reckless if you also turn out to be lucky. Market conditions are now more hostile than at any time since the 2007 peak. If you want to be speculating, and you can tolerate the outcome, then you’re not taking too much equity risk in the first place. But it’s one or the other. Can you tolerate a 40-55% market loss over the next 18 months or so? If not, take this opportunity to set things right. That’s not the worst-case scenario under present conditions; it’s actually the run-of-the-mill historical expectation.”

I also want to point out that we are now less than two weeks away from the end of the Shemitah year.

If you are still not familiar with the concept of the Shemitah year, please see my previous article entitled “The Shemitah: The Biblical Pattern Which Indicates That A Financial Collapse May Be Coming In 2015“.

Even though the stock market crashed in September 2001 at the end of a Shemitah year, and in September 2008 at the end of another Shemitah year, and it is crashing again in September 2015, somehow there are still people out there that do not think that this is real.

Well, I am here to tell you that this is very real.  But if you won’t listen to me, perhaps you will consider the findings of Israeli mathematician Thomas Pound.  The following comes from an outstanding piece that was just published by WND

After a friend told him about the seven-year Sabbatical cycle to the stock market, Pound again set out to see if the theory held up under statistical scrutiny.

Applying the same ANOVA test to the Shemitah cycle, Pound’s research revealed that the sabbatical years were the only group of years in which the market cycle averages consistent significant losses since 1871.

He also found that, in Shemitah years, the difference in loss was greater than that noted in professor Shiller’s decennial cycle.

“Statistically, it appears that the calendar years in which the Sabbatical year ends are worse than the other six years, and that difference is significant based on the data I have,” Pound told Breaking Israel News.

Look, I know that this may not fit with how you currently view the world.

The truth is that a whole bunch of weird stuff is about to happen that may not fit with how you currently view the world.

But if you honestly want to discover the truth, then you have got to go wherever the evidence ultimately leads you.

So what do you think about all of this?  Please feel free to join the discussion by posting a comment below…

The Stock Market In 2015 Is Starting To Look Remarkably Similar To The Stock Market In 2008

Bubble Mirror - Public DomainAre we watching a replay of the last financial crisis?  Over the past six months, the price of oil has collapsed, the U.S. dollar has soared, and a whole bunch of other patterns that we witnessed just before the stock market crash of 2008 are repeating once again.  But what we have not seen yet is the actual stock market crash.  So will there be one this year?  In this article, I am going to compare the performance of the Dow Jones Industrial Average during the first three months of 2008 to the performance of the Dow Jones Industrial Average during the first three months of 2015.  As you will see, there are some striking similarities.  And without a doubt, we are overdue for a major market downturn.  The S&P 500 has risen for six years in a row, but it has never had seven up years consecutively.  In addition, there has not even been a 10 percent stock market “correction” is almost three and a half years.  So will stocks be able to continue to defy both gravity and the forces of economic reality?  Only time will tell.

Below is a chart that shows how the Dow Jones Industrial Average performed during the first three months of 2008.  It was a time of increased volatility, but the market pretty much went nowhere.  This is typical of what we see in the months leading up to a market crash.  The markets start getting really choppy with large ups and large downs…

Dow First 3 Months Of 2008

This next chart shows how the Dow Jones Industrial Average has performed during the first three months of 2015.  Once again, we are witnessing a time of increased volatility, but the market is not really going anywhere.  In fact, after falling about 200 points on Tuesday (not shown on this chart) it is just barely below where it started the year…

Dow First 3 Months Of 2015

When the market becomes quite restless but it doesn’t really move anywhere, that is a sign that we have reached a turning point.  The following is what a recent CNN article had to say about the rising volatility that we have been witnessing…

The Dow fell nearly 3.7% in January, surged 5.6% in February and is down about 2% this month. The S&P 500 and Nasdaq have gone through similar sentiment swings. The Dow ended the quarter slightly in the red while the S&P 500 and Nasdaq were up a little bit.

Charles Schwab chief investment officer Liz Ann Sonders summed up this volatility the best — with a nod to U2. “Running to Stand Still: Wild Swings Taking Market Nowhere” is the title of her most recent market commentary.

What can investors expect for the rest of 2015? Probably a lot more of the same.

Now let’s look at a chart for the entire year of 2008.  After peaking for the year in early May, the Dow started to slide.  Things started to get really crazy in September, and by the end of the year the U.S. economy was plunged into the greatest crisis since the Great Depression…

Dow Full Year Of 2008

Will the rest of 2015 follow a similar pattern?

A lot of investors are actually betting that this will be the case.

Right now, hundreds of millions of dollars are flowing into VXX – an ETF that makes money when the Chicago Board Options Exchange Volatility Index goes up.  In other words, these investors are betting that we are going to see a lot more stock market volatility in the weeks and months to come.

And as I have said so many times before, stocks tend to rise in calm markets and they tend to fall when the markets become volatile.

So essentially these investors are betting that we are headed for a stock market crash.

The following is more on the massive inflow of money into VXX that we have been seeing from the Crux

Ways to speculate on how noisy the stock market will be have exploded in the last decade with the advent of products tied to the Chicago Board Options Exchange Volatility Index. Strategies include relatively simple hedges against equity losses, such as owning a security that aims to mimic the VIX.

VXX, one of the most popular ways to bet on bigger market swings, has absorbed $715 million in seven consecutive weeks of inflows, its longest streak of inflows since one ending in July 2012. The infusion of fresh cash has continued this week, swelling its market value to $1.5 billion, the highest since September 2013.

At the same time, short-sellers in VXX — people effectively betting the bull market will persist — have dropped out. Short interest has slid 35 percent since October, falling to the lowest in more than seven months last week, data compiled by Markit Ltd. show.

And many of the exact same people that warned us about the financial crisis of 2008 in advance are warning that another crisis is rapidly approaching.  For example, check out the following quote from Ann Pettifor that recently appeared in an article in the Guardian

As Janet Yellen’s Federal Reserve prepares to raise interest rates, boosting the value of the dollar, while the plunging price of crude puts intense pressure on the finances of oil-exporting countries, there are growing fears of a new debt crisis in the making.

Ann Pettifor of Prime Economics, who foreshadowed the credit crunch in her 2003 book The Coming First World Debt Crisis, says: “We’re going to have another financial crisis. Brazil’s already in great trouble with the strength of the dollar; I dread to think what’s happening in South Africa; then there’s Malaysia. We’re back to where we were, and that for me is really frightening.”

Pettifor is right on two counts – another major financial crisis is approaching, and it is going to be global in scope.

Before I end this article, there are two more items that I would like to share with you.

Firstly, it is being reported that the IPO market has really cooled off in 2015.  When the number of companies going public starts to decline, that is a clear sign that a stock market bubble is on borrowed time.  The following comes from Business Insider

The number of US companies going public has really dropped off lately.

“After a record year in 2014, the IPO market slowed dramatically in the first quarter of 2015,” Renaissance Capital analysts said.

The first quarter of 2015, which ended Tuesday, was the slowest quarter for IPOs since the first quarter of 2013. While stock prices have been near all-time highs, market volatility has been escalating, turning companies off from trying to unload shares onto the public markets.

Secondly, the San Francisco housing market has been a pretty reliable indicator of previous economic booms and busts.  The San Francisco housing market started to cool off before the dotcom bubble burst, it started to cool off before the stock market crash of 2008, and now it is cooling off once again.  The following chart comes from Zero Hedge

San Francisco - Zero Hedge

The warning signs are there.

But as with so many other things in life, most people are going to end up believing precisely what they want to believe.

So what do you believe about what the rest of the year will bring?  Please feel free to share your thoughts by posting a comment below…

‘Near Perfect’ Indicator That Precedes Almost Every Stock Market Correction Is Flashing A Warning Signal

Exclamation Marks - Public DomainAre we about to see U.S. stocks take a significant tumble?  If you are looking for a “canary in the coal mine” for the U.S. stock market, just look at high yield bonds.  In recent years, almost every single time junk bonds have declined substantially there has been a notable stock market correction as well.  And right now high yield bonds are steadily moving lower.  The biggest reason for this is falling oil prices.  As I wrote about the other day, energy companies now account for about 20 percent of the high yield bond market.  As the price of oil falls, investors are understandably becoming concerned about the future prospects of those companies and are dumping their bonds.  What is happening cannot be described as a “crash” just yet, but there has been a pretty sizable decline for junk bonds over the past month.  And as I noted above, junk bonds and stocks usually move in tandem.  In fact, junk bonds usually start falling before stocks do.  So does the decline in high yield bonds that we are witnessing at the moment indicate that we are on the verge of a significant stock market correction?

That is a question that CNBC asked in a recent article entitled “Near perfect sell signal says stocks should drop“…

The S&P 500 and the iShares iBoxx High Yield Corporate Bond ETF are a mirror image since the start of the year, but since the end of October, high yield has diverged to the lower right, and yet the S&P 500 has continued to record highs. Since separating in October, the S&P 500 is up 3 percent, while the high-yield ETF is down 4 percent.

On 10 occasions since 2007, the high-yield ETF dropped 5 percent in 30 trading days. During nine of those instances, the S&P 500 fell as well, with an average return of negative 9 percent, according to CNBC analysis using Kensho.

Only once did high yield give a false sell signal. That was last year, when the market was already entranced by the Federal Reserve’s quantitative easing program, which has seemed to elevate stocks with an abnormal consistency. And even then, the S&P 500 managed just a 0.4 percent climb amid the junk debt rout.

Personally, I am convinced that this correlation between junk bonds and stocks is very significant.

Let’s just go back and look at what happened during the financial crash of 2008 for a moment.

In the chart posted below, you can see that high yield bonds began crashing in the middle of September that year…

High Yield Bonds 2008

But U.S. stocks did not crash at the same time.  In fact, the chart below shows that they did not really begin crashing until early October…

Dow Jones Industrial Average 2008

That is why analysts often refer to junk bonds as a “leading indicator”.  What happens to high yield debt is often a really good indicator of what is about to happen to stocks.

Now let’s take a look at what is happening today.

Since the beginning of November, junk bonds have been falling steadily…

High Yield Bonds November

Meanwhile, the Dow has continued to reach new heights…

Dow Jones Industrial Average November

This is not a state of affairs that can persist indefinitely.  Either junk bonds will rebound or U.S. stocks will start falling.

If the U.S. economy was on solid footing, you could perhaps argue that it could go either way.

Unfortunately, that is not the case.  At this point, the stock market has become completely divorced from economic fundamentals.  Price to earnings ratios are at absurd levels, margin debt is hovering near record highs, and the “real economy” continues to fall apart.  We are enjoying a massively inflated standard of living which is being propped up by the largest mountain of debt in world history, and it is only a matter of time before reality starts catching up with us.

And the signs of our long-term economic decline are all around us if you are willing to look at them.  For example, the lead headline on the Drudge Report today was about how China has now overtaken us and has become the largest economy on the planet

Hang on to your hats, America.

And throw away that big, fat styrofoam finger while you’re about it.

There’s no easy way to say this, so I’ll just say it: We’re no longer No. 1. Today, we’re No. 2. Yes, it’s official. The Chinese economy just overtook the United States economy to become the largest in the world. For the first time since Ulysses S. Grant was president, America is not the leading economic power on the planet.

It just happened — and almost nobody noticed.

The International Monetary Fund recently released the latest numbers for the world economy. And when you measure national economic output in “real” terms of goods and services, China will this year produce $17.6 trillion — compared with $17.4 trillion for the U.S.A.

Meanwhile, some of the most iconic companies in the United States continue to struggle deeply.  For instance, Sears has just announced that the number of store closings for this year is going to reach a total of 235 and that the company lost more than half a billion dollars during the third quarter of 2014 alone…

Sears Holdings Corp., posted a disappointing third quarter Thursday that saw revenue, earnings, and sales at stores open at least a year all fall as the retailer tries to salvage its business.

Sears, which owns Kmart, lost $548 million, or $5.15 a share, for the period ended Nov. 1. That’s up from a loss of $534 million, or $5.03 a share, in the year-ago period.

Even though Sears is losing more than 500 million dollars a quarter, banks and investors continue to inject new money into the corporation.  That is a crying shame, because Sears is a company that is going to zero.  Anyone that is investing in Sears at this point is just pouring their money into a black hole.  As Kevin O’Leary would say, they are guilty of murdering money.

And of course what is happening to Sears is just part of the broader “retail apocalypse” that I keep writing about.  In order for retailers to thrive they need healthy consumers, and consumers are not financially healthy because the real economy is a disaster zone.

But these days so many people are in denial.  The stock market has been soaring for so long that many skeptics are now proclaiming that another 2008-style crash will never happen.  Even though the fact that we are in the midst of an absolutely insane financial bubble should be glaringly obvious to anyone with half a brain, these skeptics have convinced themselves that the current state of affairs can persist indefinitely.

Sadly, it looks like what is about to hit us in 2015 is going to serve as a very rude wake up call for them and for the millions of other Americans that currently have their heads in the sand.

How Far Will Stocks Fall This Time When The Fed Decides To Slow Down Quantitative Easing?

Bear Market - Photo by Appalachian EncountersWhen QE1 ended there was a substantial stock market correction, and when QE2 ended there was a substantial stock market correction.  And if you will remember, the financial markets threw a massive hissy fit a few months ago when Federal Reserve Chairman Ben Bernanke suggested that the Fed may soon start tapering QE3.  Clearly Wall Street does not like it when their supply of monetary heroin is interrupted.  The Federal Reserve has tricked the American people into supporting quantitative easing by insisting that it is about “stimulating the economy”, but that has turned out to be a massive hoax.  In fact, I just wrote an article that contained 37 statistics that prove that things just keep getting even worse for ordinary Americans.  But quantitative easing has been exceptionally good for Wall Street.  During QE1, the S&P 500 rose by about 300 points.  During QE2, the S&P 500 rose by about 200 points.  And during QE3, the S&P 500 has risen by about 400 points.  The S&P 500 is now in unprecedented territory, and stock prices have become completely and totally divorced from reality.  In essence, we are in the midst of the largest financial bubble this nation has ever seen.  So what is going to happen when the Fed starts pulling back the monetary crack and the bubble bursts?

A lot of people out there are claiming that the Federal Reserve will never end this round of quantitative easing.  They are suggesting that the Fed may hint at tapering from time to time, but that when push comes to shove they will just keep printing more money.

There is just one big problem with that theory.

The rest of the world is watching, and they are very troubled by quantitative easing.  Therefore the Fed must end it at some point because they desperately need the rest of the world to keep playing our game.

Our current economic prosperity greatly depends upon the rest of the planet using our dollars as the reserve currency of the world and lending trillions of dollars to us at ultra-low interest rates.  If the rest of the world decides to stop going along with the program, the system would come crashing down very rapidly.

That is why it was so alarming when China recently announced that they are going to quit stockpiling more U.S. dollars.  For a long time China has been warning us to quit recklessly printing money, and now China is starting to make moves that will make them more independent of us financially.

If the Fed does not bring quantitative easing to an end soon, other nations may start doing the same thing.

So the Fed knows that they are on borrowed time.  Faith in the U.S. financial system is declining very fast.

But the Fed also knows that ending QE3 is going to be very tricky for the financial markets.  The other times that the Fed has ended quantitative easing, it has turned out to be very painful for Wall Street.

So this time, the Fed seems to be trying to do what it can to use the media to mentally prepare investors ahead of time.  For example, the following is what Jon Hilsenrath of the Wall Street Journal wrote just a few days ago

Markets are positioned more to the Fed’s liking today than they were in September, when it put off reducing, or “tapering,” the monthly bond purchases. Most notably, the Fed’s message is sinking in that a wind down of the program won’t mean it’s in a hurry to raise short-term interest rates. Futures markets place a very low probability on Fed rate increases before 2015, in contrast to September, when fed funds futures markets indicated rate increases were expected by the end of 2014. The Fed has been trying to drive home the idea that “tapering is not tightening” for months and is likely to feel comforted that investors believe it as a pullback gets serious consideration.

In case you missed the subtle messages contained in that paragraph, here is a rough translation…

“Don’t worry.  The Federal Reserve is your friend and they say that everything is going to be okay.  Investors believe what the Fed says and you should too.  Pay no attention to the man behind the curtain.  Tapering is not tightening, and when the Federal Reserve does decide to taper the financial markets are going to take it very calmly.”

The Fed (and their messengers) very much want to avoid a repeat of what has happened before.  As you can see from the chart posted below, every round of quantitative easing has driven the S&P 500 much higher.  And when each round has ended, there has been a substantial stock market correction.  The following chart was originally produced by DayOnBay.org

Chart By DayOnBay

And of course the chart above is incomplete.  As you can see below, the S&P 500 is now sitting at about 1,800…

S&P 500

So let’s recap.

From the time that QE1 was announced to the time that it ended, the S&P 500 rose from about 900 to about 1,200.

When QE1 ended, the S&P 500 fell back below 1,100.

In a panic, the Federal Reserve first hinted at QE2 and then finally formally announced it.  That round of QE drove the S&P 500 up to a bit above the 1,300 mark.

Once QE2 ended, there was another market correction.  The S&P 500 fell all the way down to 1,123 at one point.

In another panic, the Federal Reserve first announced “Operation Twist” and then later added QE3.  Since that time, the S&P 500 has been on an unprecedented tear.  At this point, the S&P is sitting at about 1,800.

And of course those massively inflated stock prices have absolutely no relation to what is going on in the U.S. economy as a whole.  In fact, the truth is that economic conditions for most of the country are steadily getting worse.  Just today we found out that for the week ending November 30th, U.S. rail traffic was down 16.3 percent from the same week one year earlier.  That is a hugely negative sign.  It means that the flow of goods is slowing down substantially.

So the Federal Reserve has created this massive financial bubble that is totally disconnected from reality.  The only way that the Federal Reserve can keep this bubble going is to keep printing lots more money, but they also know that they cannot do that indefinitely because the rest of the world is watching.

In essence, the Federal Reserve is caught between a rock and a hard place.

When the Fed does ultimately decide to taper (whether it be December, January, February, etc.), the consequences are likely to be quite dramatic for the financial markets.  The following is a brief excerpt from a recent article by Howard Kunstler

But even in a world of seemingly no consequence, things happen. One pretty sure thing is rising interest rates, especially when, at the same time as a head-fake taper, foreigners send a torrent of US Treasury paper back to the redemption window. This paper is what other nations, especially in Asia, have been trading to hose up hard assets, including gold and real estate, around the world, and the traders of last resort — the chumps who took US T bonds for boatloads of copper ore or cocoa pods — now have nowhere else to go. China alone announced very loudly last month that US Treasury debt paper was giving them a migraine and they were done buying anymore of it. Japan is in a financial psychotic delirium scarfing up its own debt paper to infinity. Who’s left out there? Burkina Faso and the Kyrgystan Cobblers’ Union Pension Fund?

The interest rate on the US 10-year bond is close to bumping up on the ominous 3.0 percent level again. Apart from the effect on car and house loans, readers have pointed out to dim-little-me that the real action will be around the interest rate swaps. Last time this happened, in late summer, the too-big-to-fail banks wobbled from their losses on these bets, providing a glimpse into the aperture of a black hole compressive deflation where cascading chains of unmet promises blow financial systems past the event horizon of universal default and paralysis where money stops moving anywhere and people must seriously reevaluate what money actually is.

What Kunstler is talking about is something that I have written about previously many times.  When QE3 slows down (or ends), that is likely going to cause the yield on 10 year U.S. Treasuries to rise substantially, and that would have a whole host of negative consequences for the U.S. economy.

Most notably, it would threaten to blow up the quadrillion dollar derivatives casino that Wall Street usually manages to keep so delicately balanced.

The truth is that we are going to have massive problems no matter what the Federal Reserve does now.

If the Federal Reserve keeps wildly printing money, our financial system will become a massive joke to the rest of the planet and other nations will stop using our dollars and will stop lending us money.

That would be absolutely disastrous.

If the Federal Reserve stops wildly printing money, the massive financial bubble that Wall Street is enjoying right now will burst and we could have a financial crisis even greater than what we experienced back in 2008.

That would also be absolutely disastrous.

So does anyone out there see an easy way out of this under the current system?  If you think that you have such a plan, please feel free to share it below…