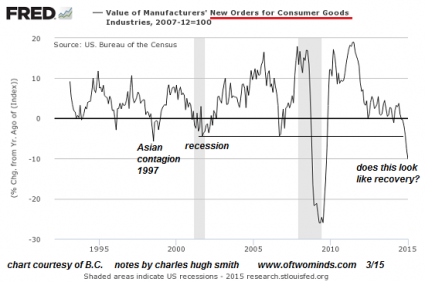
 Just a few days ago, the bull market for the S&P 500 turned six years old. This six year period of time has been great for investors, but what comes next? On March 9th, 2009 the S&P 500 hit a low of 676.53. Since that day, it has risen more than 200 percent. As you will see below, there are only two other times within the last 100 years when the S&P 500 performed this well over a six year time frame. In both instances, the end result was utter disaster. And as you take in this information, I want you to keep in mind what I said in my previous article entitled “7 Signs That A Stock Market Peak Is Happening Right Now“. What we are witnessing at this moment is classic “peaking behavior”, and there is a long way to go down from here. So if historical patterns hold up, those with lots of money in the stock market could soon be in for a whole lot of trouble.
According to Societe Generale analyst Andrew Lapthorne, there was an S&P 500 bull market run of more than 200 percent over a six year time period that ended in 1929.
We all know what happened that year.
And there was another S&P 500 bull market run of more than 200 percent over a six year time period that ended in 1999. In the end, all of those gains were wiped out when the dotcom bubble burst.
And now we are near the end of another great bull market for the S&P 500. The following is an excerpt from a recent Business Insider article…
“Such a strong six year run up in US equities has only been seen twice since 1900, i.e., back in 1929 and 1999, neither of which ended well,” Lapthorne wrote.
It’s anyone’s guess what happens next. But Lapthorne and his colleagues have slanted bearish.
So how will this current bull market end?
Needless to say, a lot of people are not very optimistic about that right now.
And there was another very interesting bull market that ended in 1987…
On Aug. 12, the S&P 500 dipped to 102.42, setting the stage for the third-biggest bull market in stocks since 1929. Inflation and unemployment fell. In 1984, President Reagan would cruise to reelection with an ad telling voters “It’s morning again in America.” By 1987, the stock market had tripled. Shareholders who were able to see beyond the gloom of the early 1980s reaped a huge return.
Of course a lot of those huge stock market returns were eliminated in a single day. On October 19th, 1987 the Dow declined by more than 22 percent during a single trading session. That day is still known as “Black Monday” up to this present time.
Markets tend to go down a lot faster than they go up. So if your stock portfolio has gone up substantially over the past few years, good for you. But keep in mind that all of your gains can be wiped out very rapidly. Millions of people experienced this during the last financial crisis, and millions more will experience this during the next one.
And as I keep reminding people, so many of the exact same patterns that we witnessed just prior to the last great stock market collapse are happening once again.
For example, just yesterday I explained that there has been only one other time over the past decade when we have seen the U.S. dollar surge in value in such a short period of time.
That was in 2008, just prior to the last financial crisis.
Another example is what has happened to the price of oil. Since the middle of last year, the price of oil has fallen by more than 50 dollars a barrel.
In all of history, that has happened only one other time.
That was in 2008, just prior to the last financial crisis.
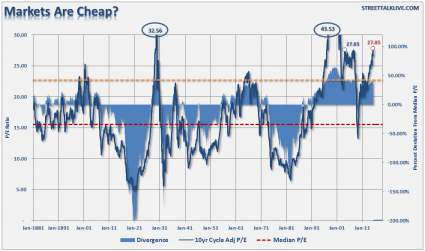
I could go on and on. I could talk about margin debt, price/earnings ratios, industrial commodities, etc.
But you know what? Despite all of the warning signs there are still people out there that are eagerly pouring money into the stock market.
Back in 2005 and 2006, I knew people that were hurrying to buy homes before they got “priced out of the market”. So they did everything that they could to scrape together down payments and they took on mortgages that were larger than they could really afford.
And in the end they got burned.
Today, people are doing similar things. For instance, my friend Bob recently sent me an article that I could hardly believe. It turns out that an “expert” on CNBC is encouraging people “to take out a 7 year loan with a rapidly amortizing asset as collateral in order to buy stocks.”
Yikes!
Let me be clear. The really, really, really dumb money is jumping into the stock market right now. Those that are pouring money into stocks today are really going to get hit hard when the crash comes.
And it isn’t just me saying this.
Just consider the words of billionaire hedge fund manager Crispin Odey…
Mr Odey is best known for his big macroeconomic calls, including foreseeing the 2008 global credit crisis; piling into insurers in the wake of September 2001 attacks; and picking the recent oil price rout. He famously paid himself £28 million in 2008 after shorting credit crisis casualties, including British lender Bradford & Bingley. Mr Odey’s fund returned 54.8 per cent that year.
“The market’s reaction to all of this is leave it to the professionals, leave it to those great guys, the central bankers, because they saved the day in 2009,” he said. “These guys are kind of relying on central banks pulling a rabbit out of a hat.”
The risk is that this time, monetary policy may be ineffective: “We need the crisis to reformulate policy. Central banks are not all singing and all dancing, they cannot basically avoid the natural consequences of what we are doing.”
An inadequate supply-side response to the plunge in commodity prices as the resources industry declines to reduce production was in effect stimulating supply into falling demand.
“The trouble is today the players, whether they are the miners or the oil companies or the Saudis or anybody else, they are not doing the right things. This is the first time in my career where economics 101 doesn’t work at all.”
But it was also true that the world has not had a major recession for 25 years and thanks to frequent interventions, “there is a sensation we don’t have a business cycle”. Stocks are enjoying a six-year bull market but he also hinted at liquidity issues bubbling under the surface.
“I just think that you and I have got grandstand seats here [to an imminent market shock] and my point is having found myself in the second quarter of last year selling a lot of equities and starting to go short, I found out just how illiquid it all was. You never actually see it until people try and get out of these things.”
It was unclear to Mr Odey what central banks could do to prevent a crash.
The warning signs are clear.
Soon the time for warning will be over and the crisis will be here.
I hope that you are getting ready.