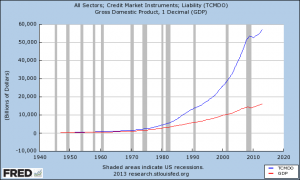
 Anyone that thinks that the U.S. economy can keep going along like this is absolutely crazy. We are in the terminal phase of an unprecedented debt spiral which has allowed us to live far, far beyond our means for the last several decades. Unfortunately, all debt spirals eventually end, and they usually do so in a very disorderly manner. The chart that you are about to see is one of my favorite economic charts. It compares the growth of U.S. GDP to the growth of total debt in the United States. Yes, U.S. GDP has certainly grown at a decent pace over the years, but our total debt has absolutely exploded. 40 years ago, the total amount of debt in our system (government debt + corporate debt + consumer debt, etc.) was about 2 trillion dollars. Today it has grown to more than 56 trillion dollars. Our debt has grown at a much, much faster rate than our economy has, and there is no way in the world that we will be able to continue to do that for long.
Posted below is the chart that I was talking about. The blue line is our total debt, and the red line is our GDP. As you can see, this chart kind of speaks for itself…

So how did we get here?
Well, of course the federal government has been the biggest offender. It would be a tremendous understatement to say that the politicians in Washington D.C. have been reckless. Since the year 2000, the size of the U.S. national debt has grown by more than 11 trillion dollars.
Posted below is a chart that demonstrates the dramatic growth of the national debt as a percentage of GDP. In particular, our debt has absolutely exploded as a percentage of GDP since the financial crisis of 2008…
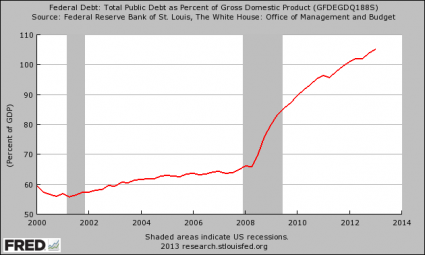
Does that look sustainable to you?
Of course it isn’t.
Right now, the mainstream media is very excited that the federal budget deficit for this year might be less than a trillion dollars, but they are really missing the point. The debt of the U.S. government is still growing much, much faster than the economy is, and the United States already has more government debt per capita than Greece, Portugal, Italy, Ireland or Spain.
What we are doing to future generations is absolutely criminal. We are piling up mountains of debt that will haunt them for the rest of their lives just so that we can make the present a little bit more pleasant for ourselves.
As I noted in another article, during Obama’s first term the federal government accumulated more debt than it did under the first 42 U.S presidents combined. And now we are entering a time period when demographic forces are going to put a tremendous amount of pressure on the finances of the federal government.
The Baby Boomers have started to retire, and they are going to want to start collecting on all of the financial promises that we have made to them.
As I have written about previously, the number of Americans on Medicare is projected to grow from a little bit more than 50 million today to 73.2 million in 2025.
The number of Americans collecting Social Security benefits is projected to grow from about 56 million today to 91 million in 2035.
Where are we going to get the money to pay for all of that?
Boston University economist Laurence Kotlikoff has calculated that the U.S. government is facing unfunded liabilities of 222 trillion dollars in the years ahead.
There is no simply no way that the U.S. government is going to be able to meet those obligations without wildly printing up money.
And of course the federal government is not the only one with massive debt problems. We just saw the city of Detroit go bankrupt, and there are lots of other communities all over the nation that could soon follow.
Posted below is a chart that shows the growth of state and local government debt over the years. In particular, please take note that the total amount of state and local government debt has grown from about 1.2 trillion dollars in the year 2000 to about 3 trillion dollars today…
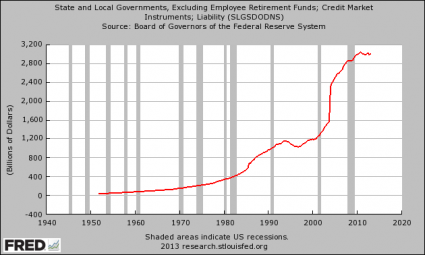
But the chart posted above does not even take into account the massive unfunded pension obligations that state and local governments are facing. According to the Detroit Free Press, state governments are facing unfunded pension obligations of nearly a trillion and a half dollars…
From Baltimore to Los Angeles, and many points in between, municipalities are increasingly confronted with how to pay for these massive promises. The Pew Center for the States, in Washington, estimated states’ public pension plans across the U.S. were underfunded by a whopping $1.4 trillion in 2010.
And many large cities are dealing with similar situations. Detroit was the first to go down, but could Chicago or Los Angeles eventually be forced to declare bankruptcy too?…
Chicago recently saw its credit rating downgraded because of a $19-billion unfunded pension liability that the ratings service Moody’s puts closer to $36 billion. And Los Angeles could be facing a liability of more than $30 billion, by some estimates.
According to a report that was released earlier this year, the largest U.S. cities are facing hundreds of billions of dollars in unfunded pension liabilities at this point…
Early this year, the Pew Center released a survey showing that 61 of the nation’s largest cities — limiting the survey to the largest city in each state and all other cities with more than 500,000 people — had a gap of more than $217 billion in unfunded pension and health care liabilities. While cities had long promised health care, life insurance and other benefits to retirees, “few … started saving to cover the long-term costs,” the report said.
So where will all of that money come from?
That is a good question, and nobody has an easy answer at this point.
Meanwhile, U.S. consumers have been racking up staggering amounts of debt over the past several decades. Just consider the following numbers…
-Total home mortgage debt in the United States is now about 5 times larger than it was just 20 years ago.
-Car loans just keep getting longer and longer, and approximately 70 percent of all car purchases in the United States now involve an auto loan.
-The total amount of student loan debt in America recently surpassed the one trillion dollar mark.
-One study discovered that approximately 41 percent of all working age Americans either have medical bill problems or are currently paying off medical debt, and according to a report published in The American Journal of Medicine medical bills are a major factor in more than 60 percent of the personal bankruptcies in the United States.
-Consumer debt in the United States has risen by a whopping 1700% since 1971, and 46% of all Americans carry a credit card balance from month to month.
Sadly, most people don’t realize how damaging credit card debt can be. If you just carry an “average balance” on your credit cards each month, and those credit cards have just an “average” interest rate, you could end up paying millions of dollars to the credit card companies by the end of your life…
Let’s say you are an average American household, and you carry an average balance of $15,956 in credit card debt.
Also, as an average American household, let’s assume you pay an average current rate of 12.83%.
Finally, let’s assume you carry this average balance for 40 years, between ages 25 and 65. How much did your credit card company make off of you and your extreme averageness?
Answer: $2,629,618.64
Incredibly, a large percentage of the population does not seem to understand these things. An astounding 43 percent of all American families spend more than they earn each year.
Are you starting to understand why approximately half of all Americans die broke?
We are a nation that is completely and addicted to debt.
If you do not believe that it will ever catch up with us you are being delusional.
We have piled up the biggest mountain of debt in the history of the planet, and a day of reckoning is fast approaching.