An Expert That Correctly Called The Last Two Stock Market Crashes Is Now Predicting Another One

Hussman ChartWhat I am about to share with you is quite stunning.  A well-respected financial expert that correctly predicted the last two stock market crashes is now warning that we are right on the verge of the next one.  John Hussman is a former professor of economics and international finance at the University of Michigan, and the information in his latest weekly market comment is staggering.  Since 1970, there have only been a handful of times when a combination of market signals that Hussman uses have indicated that a major market peak has been reached.  In 1972, 2000 and 2007 each of those peaks was followed by a dramatic stock market crash.  Now, for the first time since the last financial crisis, all four of those signals appeared once again during the week of July 17th.  If Hussman’s analysis is correct, this could very well mean that the next great stock market crash in the United States is imminent.

It was an excellent article by Jim Quinn of the Burning Platform that first alerted me to Hussman’s latest warning.  If you don’t follow Quinn’s work already, you should, because it is excellent.

When someone is repeatedly correct about the financial markets, we should all start paying attention.  Back in late 2007, Hussman warned us about what was coming in 2008, but most people did not listen.

Now he is sounding the alarm again.  According to Hussman, when there is a confluence of four key market indicators, that tells us that the market has peaked and is in danger of crashing.  The following comes from Newsmax

He cited the metric among the indicators that foreshadowed declines after peaks in 1972, 2000 and 2007:

*Less than 27 percent of investment advisers polled by Investors Intelligence who say they are bearish.

*Valuations measured by the Shiller price-to-earnings ratio are greater than 18 times.

*Less than 60 percent of S&P 500 stocks above their 200-day moving averages.

*Record high on a weekly closing basis.

The most recent warning was the week ended July 17, 2015,” Hussman said. “It’s often said that they don’t ring a bell at the top, and that’s true in many cycles. But it’s interesting that the same ‘ding’ has been heard at the most extreme peaks among them.”

It is quite rare for the market to set a new record high on a weekly closing basis and have more than 40 percent of stocks below their 200-day moving averages at the same time.  That is why a confluence of all these factors is fairly uncommon.  Hussman elaborated on this in his recent report

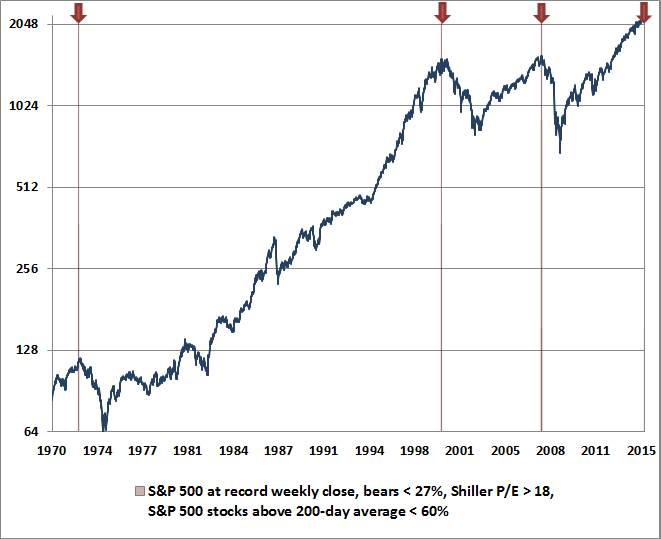
The remaining signals (record high on a weekly closing basis, fewer than 27% bears, Shiller P/E greater than 18, fewer than 60% of S&P 500 stocks above their 200-day average), are shown below. What’s interesting about these warnings is how closely they identified the precise market peak of each cycle. Internal divergences have to be fairly extensive for the S&P 500 to register a fresh overvalued, overbullish new high with more than 40% of its component stocks already falling – it’s evidently a rare indication of a last hurrah. The 1972 warning occurred on November 17, 1972, only 7 weeks and less than 4% from the final high before the market lost half its value. The 2000 warning occurred the week of March 24, 2000, marking the exact weekly high of that bull run. The 2007 instance spanned two consecutive weekly closing highs: October 5 and October 12. The final daily high of the S&P 500 was October 9 – right in between. The most recent warning was the week ended July 17, 2015.

The following is the chart that immediately followed the paragraph in his report that you just read…

Hussman Chart

When I first took a look at that chart I could hardly believe it.

It appears that Hussman’s signals are able to indicate major stock market crashes with stunning precision.

And considering the fact that we just hit a new “ding” for the first time since the last financial crisis, what Hussman is saying is more than just a little bit ominous.

According to Hussman this is not just a recent phenomenon either.  Even though advisory sentiment figures were not available back in 1929, he believes that his indicators would have given a signal that a market crash was imminent in August of that year as well

Though advisory sentiment figures aren’t available prior to the mid-1960’s, imputed data suggest that additional instances likely include the two consecutive weeks of August 19, 1929 and August 26, 1929. We can infer unfavorable market internals in that instance because we know that cumulative NYSE breadth was declining for months before the 1929 high. The week of the exact market peak would also be included except that stocks closed down that week after registering a final high on September 3, 1929. Another likely instance, based on imputed sentiment data, is the week of November 10, 1961, which was immediately followed by a market swoon into June 1962.

Of course the past is the past, and what has happened in the past will not necessarily happen in the future.

So is Hussman wrong this time?  With all of the other things that are happening in the financial world right now, I certainly would not bet against him.

Other financial professionals are concerned that a market crash could be imminent as well.  The following comes from a piece authored by Andrew Adams

More than 13% of stocks on the New York Stock Exchange are at 52-week lows, which is about 6 standard deviations above the average over the last three years (1.62%) and an extreme only seen one other time during said period (last October when the S&P 500 was percentage points away from a 10% correction).

This dichotomy has created what I believe to be the biggest question about the stock market right now – have we already experienced a stealth correction in the majority of stocks that will soon come to an end or will the market leaders finally succumb to the weight of the laggards and join in on the sell-off? The answer to this could end up being worth at least $2.2 trillion, which is how much money would essentially be wiped out of the stock market if we finally get the much-discussed 10% correction in the overall market (the total U.S. stock market capitalization was $22.5 trillion as of June 30, according to the Center for Research in Security Prices).

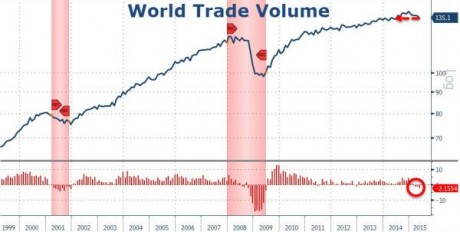
Sometimes, a picture is worth more than a thousand words.  I could share many more quotes from the “experts” about why they are concerned about a potential stock market collapse, but instead I want to share with you a “bonus chart” that Zero Hedge posted on Tuesday

Bonus Chart - Zero Hedge

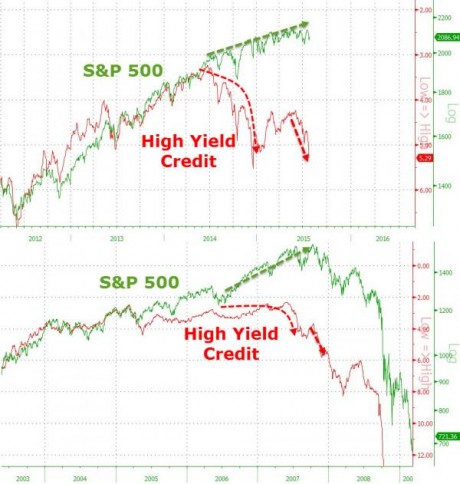
Do you understand what that is saying?

In 2007 and 2008, junk bonds started crashing well before stocks did.

Now, we are witnessing a similar divergence.  If a similar pattern holds up this time, stocks have a long, long way to fall.

Like Hussman and so many others, I believe that a stock market crash and a new financial crisis are imminent.

The month of August is usually a slow month in the financial world, so hopefully we can get through it without too much chaos.  But once we roll into the months of September and October we will officially be in “the danger zone”.

Keep an eye on China, keep an eye on Europe, and keep listening for serious trouble at “too big to fail” banks all over the planet.

The next several months are going to be extremely significant, and we all need to be getting ready while we still can.

Now Is The Time – Fear Rises As Financial Markets All Over The Planet Start To Crash

Fear - Public DomainCan you feel the panic in the air?  CNN Money’s Fear & Greed Index measures the amount of fear in the financial world on a scale from 0 to 100.  The closer it is to zero, the higher the level of fear.  Last Monday, the index was sitting at a reading of 36.  As I write this article, it has fallen to 7.  The financial turmoil which began last week is threatening to turn into an avalanche. On Sunday night, we witnessed the second largest one day stock market collapse in China ever, and this pushed stocks all over the planet into the red.  Meanwhile, the twin blades of an emerging market currency crisis and a commodity price crash are chewing up economies that are dependent on the export of natural resources all over the globe.  For a long time, I have been warning about what would happen in the second half of 2015, and now it is here.  The following is a summary of the financial carnage that we have seen over the past 24 hours…

-On Sunday night, the Shanghai Composite Index plunged 8.5 percent.  It was the largest one day stock market crash in China since 2007, and it was the second largest in history.  The Chinese government is promising to directly intervene in order to prevent Chinese stocks from going down even more.

-Over 1,500 stocks in China fell by their 10 percent daily maximum.  This list includes giants such as China Unicom, Bank of Communications and PetroChina.

-Ever since peaking in June, the Shanghai Composite Index has dropped by a total of 28 percent.

-Even Chinese stocks that are listed on U.S. stock exchanges are being absolutely hammered.  The following comes from USA Today

The 144 China-based stocks with primary listings on major U.S. exchanges have erased nearly $40 billion in paper wealth since the Shanghai Composite index peaked on June 12. It’s an enormous destruction of wealth that in effects wipes out the market value of a company the size of cruise ship operator Carnival.

-The Chinese stock market crash pushed European stocks significantly lower on Monday…

The pan-European FTSEurofirst 300 provisionally closed 2.1 percent lower, while the Germany’s DAX and France’s CAC closed respectively 2.4 percent and 2.5 percent lower.

The U.K.’s benchmark FTSE outperformed its euro zone peers, but still closed unofficially down 1.0 percent.

-Overall, European stocks have been falling steadily since the beginning of last week.  To get an idea of how much damage has been done already, just check out this chart.

-As I mentioned above, an emerging market currency crisis is causing havoc for economies all over the planet.  The following comes from an article that was published by the Telegraph

The currencies of Brazil, Mexico, South Africa and Turkey have all crashed to multi-year lows as investors flee emerging markets and commodity prices crumble.

The drastic moves came as fears of imminent monetary tightening by the US Federal Reserve combined with shockingly weak figures from China, which stoked fears that the country may be sliding into a deeper downturn and sent tremors through East Asia, Latin America and Africa.

-The government of Puerto Rico has announced that it does not have enough cash to make a scheduled debt payment of 169 million dollars on August 1st.  The Obama administration says that there are no plans in the works to bail out Puerto Rico.

-On Monday, the Dow was down another 127 points.  It was the fifth day in a row that the Dow and the S&P 500 have both declined.

-Overall, the Dow is now down more than 650 points since July 20th.

-480 stocks on the New York Stock Exchange have hit new 52-week lows.  Many analysts consider this to be a very, very ominous sign.

-I have repeatedly written about the danger of the commodity collapse that we are currently witnessing, and the Bloomberg Commodity Index fell another 1.22 percent on Monday to a fresh low of 92.1493.

-On Monday, the price of U.S. oil hit a 52-week low of $46.92.

-So far, the price of U.S. oil has fallen about 20 percent this month.

-Back in June 2014, the price of a barrel of West Texas Intermediate crude was above 107 dollars.  Since then, the price of U.S. oil has fallen an astounding 56 percent.

-Thanks in large part to the collapse in energy prices, junk bonds are cratering.  This is something that happened just before the financial crisis of 2008, and now it is happening again.  The following comes from Wolf Street

Among the bonds: Cliffs Natural Resources down 27.6%, SandBridge down 30%, Murray Energy down 21.2%, and Linn Energy down 22.3%, according to Bloomberg.

For example, Linn Energy 6.25% notes due in 2019 were trading at 78 cents on the dollar at the beginning of July and at 58 on Friday, according to LCD. There was bloodshed beyond energy, such as AK Steel’s 7.625% notes due in 2021. They were trading at 62 cents on the dollar, down 22% from the beginning of July.

“The performance is a disappointment to investors who purchased about $40 billion of junk-rated bonds from energy companies this year, thinking that the worst of the slump was over,” Bloomberg noted.

This is exactly what we would expect to see during the early stages of a financial crisis.

Of course global financial markets may bounce back somewhat tomorrow.  If you will remember, some of the largest one day gains in stock market history happened right in the middle of the stock market collapse of 2008.  So don’t get fooled by what happens on any one particular day.

With so much fear in the air, literally anything could happen in the weeks and months ahead of us.  One month ago, I issued a red alert for the last six months of this year.  I warned that a major financial crisis was imminent and that people needed to start protecting themselves immediately.

As I write this article on Monday evening, financial markets are already opening up over in Asia.  Japanese stocks are already down 251 points even though the market has only been open for about an hour over there.

We have entered a time when what is happening to global stock markets will once again be headline news.  We are right on the precipice of another great financial crisis, only this one is going to ultimately end up being much worse than the last one.

Now is the time.

Please get prepared while you still can.

The Stock Market Will Start To Fall In July? The Dow Plummeted More Than 500 Points Last Week

Falling - Public DomainWas last week a preview of things to come? There are quite a few people out there that believe that the stock market would begin to decline in July, and that appears to be precisely what is happening. Last week, the Dow Jones Industrial Average fell by more than 530 points. It was the biggest one week decline that we have seen so far in 2015, and some are suggesting that this could only be just the beginning. By just about any measurement that you might want to use, the stock market is overvalued. But we have been in this bubble for so long that many people have come to believe that this is “the new normal”. In fact, earlier today someone that I know dropped me a line and suggested that our financial overlords may be able to use the tools at their disposal to get this current bubble to persist indefinitely. Unfortunately, the truth is that no financial bubble ever lasts forever, and right now some very alarming things are starting to happen behind the scenes. Over the past couple of weeks, the smart money has been dumping stocks like crazy, and the lack of liquidity in the bond markets is beginning to become acute.  Could it be possible that another great financial crisis is just around the corner?

Last week took a lot of investors by surprise. The following is how Zero Hedge summarized the carnage…

-Russell 2000 -3.1% – worst week since Oct 2014 (Bullard)
-Dow -2.8% – worst week since Dec 2014
-S&P -2.1% – worst week since Jan 2015
-Trannies -2.8% – worst week since Mar 2015
-Nasdaq -2.2% – worst week since Mar 2015

The talking heads on television were not quite sure what to make of this sudden downturn. On CNBC, analysts mainly blamed the usual suspects…

“I think the market’s very much concerned about the commodity (decline),” said John Lonski, chief economist at Moody’s. “The contraction in China manufacturing activity is gaining momentum and the credit market has yet to signal that rates are not about to go higher.”

He also noted a surprising decline in new home sales and continued lack of revenue growth in earnings. Nearly all the commodities are in a bear market and gold and crude settled at lows Friday.

“You’ve got some major growth concerns and that is what’s weighing on investors minds,” said Peter Boockvar, chief market strategist at The Lindsey Group.

And without a doubt, there are some new numbers that are deeply troubling for Wall Street. For example, it is being projected that S&P 500 companies will collectively report a 2.2 percent decline in earnings for the second quarter of 2015. If this comes to pass, it will be the first drop that we have seen since the third quarter of 2012.

The biggest reason for this decline in earnings is the implosion of U.S. energy companies due to the crash in oil prices. The following comes from CNBC

Thanks to a collapse in the price of oil, the energy sector is slated to report a monster 54 percent drop in earnings and 28 percent swoon in revenue, compared to the second quarter in the year prior.

Hmm – unlike what so many others were saying initially, it turns out that the oil crash is bad for the U.S. economy after all.

But just like at this time of the year in 2008, most people fully expect that everything is going to be just fine. So many of the exact same patterns that we witnessed the last time around are playing out once again, and yet most of the “experts” refuse to see what is happening right in front of their eyes.

When things crash this time, it won’t just be stocks that collapse. As I have been writing about so frequently, we are also headed for an implosion of the bond markets as well. The following comes from Dr. David Eifrig

In the U.S. Treasury securities market, financial-services giant JPMorgan Chase estimates that five years ago, you could move about $280 million worth of Treasury securities before your trades moved the market’s price. Now, that’s down to $80 million… a decline of more than 70%.

When a panic sets in, reduced liquidity can cause big swings in market prices.

There is that word “liquidity” again. This is something that I have repeatedly been taking about. Just check out this article from a little over a month ago. A bond is only worth what someone else is willing to pay for it, and if the market runs out of buyers that can cause seismic shifts in price very rapidly. Here is more from Eifrig

In a run-of-the-mill bear market, you just have a downward trend… When enough investors are selling bonds, it drives down prices. Falling prices lead more investors to start selling. We see that all the time.

A liquidity crisis goes even further. It’s like a classic run on a bank… Without sufficient liquidity, the sellers don’t just see lower prices… they see no prices. Since no one wants to buy bonds at this particular time, the price for them effectively becomes zero.

There has been a lot of speculation about what will happen in the second half of 2015.

We only have a little over five months to go in the year, so it won’t be too long before we see who was right and who was wrong.

Our perceptions of the future are very much shaped by our worldviews. All the time, I get “Obamabots” that come to my website and leave comments on my articles telling me how Barack Obama has “turned the economy around” and has set the stage for a new era of prosperity in America.

Despite all the evidence to the contrary, they choose to believe that things are in great shape because that is what they want to believe. Just check out the results from one recent survey

While 55 percent of Democrats reported feeling positive about the economy, for example, just 25 percent of Republicans felt the same from March 25 to May 27.

When asked if they thought the economy would improve over the next 12 months, 53 percent of Democrats said yes. Only 23 percent of the Republicans in the survey agreed.

The same perception gap extends to the far future, with 41 percent of Democrats believing that the next generation will be better off than their parents, and just 24 percent of Republicans saying the same.

To me, those numbers are quite striking.

Many Democrats very much want to believe that things are getting better because Barack Obama is in the White House.

Many Republicans very much want to believe that things are totally falling apart because Barack Obama is in the White House.

So who is right and who is wrong?

Please feel free to share what you think by posting a comment below…

Copper, China And World Trade Are All Screaming That The Next Economic Crisis Is Here

Screaming Smiley - Public DomainIf you are looking for a “canary in a coal mine” type of warning for the entire global economy, you have a whole bunch to pick from right now.  “Dr. Copper” just hit a six year low, Morgan Stanley is warning that this could be the worst oil price crash in 45 years, the Chinese economy is suddenly stalling out, and world trade is falling at the fastest pace that we have seen since the last financial crisis.  In order not to see all of the signs that are pointing toward a global economic slowdown, you would have to be willingly blind.  In recent months, I have been writing article after article detailing how the exact same patterns that happened just before the stock market crash of 2008 are playing out once again.  We are watching a slow-motion train wreck unfold right before our eyes, and things are only going to get worse from here.

Copper is referred to as “Dr. Copper” because it does such an excellent job of indicating where economic conditions are heading next.  We saw this in 2008, when the price of copper started crashing big time in the months leading up to the stock market implosion.

Well, now copper is crashing again.  Just check out this chart.  The price of copper plunged again on Wednesday, and it is now the lowest that it has been since the last financial crisis.  Unfortunately, the forecast for the months ahead is not good.  The following is what Goldman Sachs is saying about copper…

“Though we have been bearish on copper on a 12-mo forward basis for the past two and a half years, we have maintained a more bullish medium to long-term stance on the assumption of Chinese copper demand growth of 4% per annum and a major slowing in supply growth around 2017/2018 … we substantially lower our short, medium, and long-term copper price forecasts, on the back of lower Chinese copper demand growth forecasts (we have been highlighting that the risk has been skewed to the downside for some time), increased conviction in copper supply growth over the next three years, and increased conviction in the outlook for mining cost deflation in dollar terms.”

It is funny that Goldman mentioned China so prominently.  Even though China’s fake GDP figures say that everything is fine over there, other numbers are painting a very dismal picture.

For instance, Chinese electrical consumption in June grew at the slowest pace that we have seen in 30 years, and capital outflows from China have reached a level that is “frightening”

Robin Brooks at Goldman Sachs estimates that capital outflows topped $224bn in the second quarter, a level “beyond anything seen historically”.

The Chinese central bank (PBOC) is being forced to run down the country’s foreign reserves to defend the yuan. This intervention is becoming chronic. The volume is rising. Mr Brooks calculates that the authorities sold $48bn of bonds between March and June.

Charles Dumas at Lombard Street Research says capital outflows – when will we start calling it capital flight? – have reached $800bn over the past year. These are frighteningly large sums of money.

Just last month, the Chinese stock market started to crash, but the crash was interrupted when the Chinese government essentially declared a form of financial martial law.

And I don’t think that “financial martial law” is too strong of a term to use in this case.  Just consider the following excerpt from a recent article in the Telegraph

Half the shares traded in Shanghai and Shenzhen were suspended. New floats were halted. Some 300 corporate bosses were strong-armed into buying back their own shares. Police state tactics were used hunt down short sellers.

We know from a vivid account in Caixin magazine that China’s top brokers were shut in a room and ordered to hand over money for an orchestrated buying blitz. A target of 4,500 was set for the Shanghai Composite by Communist Party officials.

So a stock market crash was halted, but in doing so Chinese officials have essentially destroyed the second largest stock market in the world.  China’s financial markets have lost all legitimacy, and foreigners are going to be extremely hesitant to put any money into Chinese stocks from now on.

Meanwhile, there is no hiding the fact that trade activity in China and in most of the rest of the planet is slowing down.  In fact, world trade volume has now dropped by the most that we have seen since the last global recession.  The following comes from Zero Hedge

As goes the world, so goes America (according to 30 years of historical data), and so when world trade volumes drop over 2% (the biggest drop since 2009) in the last six months to the weakest since June 2014, the “US recession imminent” canary in the coalmine is drawing her last breath

World Trade Volume - Zero Hedge

As Wolf Street’s Wolf Richter adds, this isn’t stagnation or sluggish growth. This is the steepest and longest decline in world trade since the Financial Crisis. Unless a miracle happened in June, and miracles are becoming exceedingly scarce in this sector, world trade will have experienced its first back-to-back quarterly contraction since 2009.

As you probably noted in the chart above, a decline in world trade is almost always associated with a recession.

That was certainly the case back in 2008 and 2009.

Another similarity between the last crisis and what is happening now is a crash in the price of oil.

According to Business Insider, we have just officially entered a brand new bear market for oil…

Oil is officially in a bear market.

On Thursday, West Texas Intermediate crude oil futures fell more than 1% to settle near $48.55 per barrel in New York.

A bear market is roughly defined as a 20% drop from highs. Crude has now fallen by about 20% in the last six weeks.

So what does all of this mean?

All of these signs are indicating that another great economic crisis is here, and that a global financial implosion is just around the corner.

At this point, even many of the “bulls” are sounding the alarm.  For example, just consider what Henry Blodget of Business Insider is saying…

As regular readers know, for the past ~21 months I have been worrying out loud about US stock prices. Specifically, I have suggested that a decline of 30% to 50% would not be a surprise.

I haven’t predicted a crash. But I have said clearly that I think stocks will deliver returns that are way below average for the next seven to 10 years. And I certainly won’t be surprised to see stocks crash. So don’t say no one warned you!

For those that don’t know, Henry Blodget is definitely not a bear.  In fact, he is one of Wall Street’s biggest cheerleaders.

So for Blodget to suggest that we could see the stock market drop by half is a really big deal.

The closer that we get to this next crisis, the clearer that everything is becoming.

Where are things going to go from here?  Please feel free to add to the discussion by posting a comment below…

Commodities Collapsed Just Before The Last Stock Market Crash – So Guess What Is Happening Right Now?

Grid Stock Exchange Economy Finance - Public DomainIf we were going to see a stock market crash in the United States in the fall of 2015 (to use a hypothetical example), we would expect to see commodity prices begin to crash a few months ahead of time.  This is precisely what happened just before the great financial crisis of 2008, and we are watching the exact same thing happen again right now.  On Wednesday, commodities got absolutely pummeled, and at this point the Bloomberg Commodity Index is down a whopping 26 percent over the past twelve months.  When global economic activity slows down, demand for raw materials sinks and prices drop.  So important global commodities such as copper, iron ore, aluminum, zinc, nickel, lead, tin and lumber are all considered to be key “leading indicators” that can tell us a lot about where things are heading next.  And what they are telling us right now is that we are rapidly approaching a global economic meltdown.

If the global economy was actually healthy and expanding, the demand for commodities would be increasing and that would tend to drive prices up.  But instead, prices continue to go down.

The Bloomberg Commodity Index just hit a brand new 13-year low.  That means that global commodity prices are already lower than they were during the worst moments of the last financial crisis

The commodities rout that’s pushed prices to a 13-year low pulled some of the biggest mining and energy companies below levels seen during the financial crisis.

The FTSE 350 Mining Index plunged as much as 4.9 percent to the lowest since 2009 on Wednesday, with BHP Billiton Ltd. and Anglo American Plc leading declines. Gold and copper are near the lowest in at least five years, while crude oil retreated to $50 a barrel.

This commodity bear market is like a train wreck in slow motion,” said Andy Pfaff, the chief investment officer for commodities at MitonOptimal in Cape Town. “It has a lot of momentum and doesn’t come to a sudden stop.”

Commodity prices have not been this low since April 2002.  According to Bloomberg, some of the commodities being hit the hardest include soybean oil, copper, zinc and gasoline.  And this commodity crash is already having a dramatic impact on some of the biggest commodity-producing nations on the globe.  Just consider what Gerald Celente recently told Eric King

We now see that the Australian dollar is at a six-year low against the U.S. dollar. What are Australia’s biggest exports? How about iron-ore and other metals.

If we look at Canada, their currency is also now at a six-year low vs the U.S. dollar. Well, Canada is a big oil exporter, particularly some tar sands oil, which is expensive to produce.

We also now have the Brazilian real at a 10-year low vs the U.S. dollar. Why? Because it’s a natural resource rich country and they don’t have a strong market to sell their natural resources to.

Meanwhile, the Indian rupee is at a 17-year low vs the U.S. dollar. This is because manufacturing is slowing down and there is less development. If the Americans aren’t buying, the Indians, the Chinese, the Vietnamese — they’re not making things.

All of this is so, so similar to what we experienced in the run up to the financial crisis of 2008.  Just a couple of days ago, I talked about how the U.S. dollar got really strong just prior to the last stock market crash.  The same patterns keep playing out over and over, and yet most in the mainstream media refuse to see what is happening.

Something else that happened just a few months before the last stock market crash was a collapse of the junk bond market.

Guess what?

That is starting to happen again too.  Just check out this chart.

I know that I must sound like a broken record.  But I think that it is extremely important to document these things.  When the next financial collapse takes place, virtually everyone in the mainstream media will be talking about what a “surprise” it is.

But for those that have been paying attention, it won’t be much of a “surprise” at all.

When the stock market does crash, how far might it fall?

During a recent appearance on CNBC, Marc Faber suggested that it could decline by up to 40 percent

The U.S. stock market could “easily” drop 20 percent to 40 percent, closely followed contrarian Marc Faber said Wednesday—citing a host of factors including the growing list of companies trading below their 200-day moving average.

In recent days, “there were [also] more declining than advancing stocks, and the list of 12-month new lows was very high on Friday,” the publisher of The Gloom, Boom & Doom Report told CNBC’s “Squawk Box.”

“It shows you a lot of stocks are already declining.”

Others, including myself, believe that what we are going to experience is going to be even worse than that.

We live in such a fast-paced world, and most of us don’t have the patience to wait for long-term trends to play out.

If the stock market is not crashing today, to most people that means that everything must be fine.

But once it has crashed, everyone is going to be complaining that they weren’t warned in advance about what was coming and everyone will be complaining that nobody ever fixed the things that caused the exact same problems the last time around.

Personally, I am trying very hard to make sure that nobody can accuse me of not sounding the alarm about the storm that is on the horizon.

The world has never been in more debt, our “too big to fail” banks have never been more reckless, and global financial markets have never been more primed for a collapse.

Amazingly, there are still a lot of “experts” out there that insist that everything is going to be okay somehow.

Of course many of those exact same “experts” were telling us the same thing just before the stock market crashed in 2008 too.

A great financial shaking has already begun around the world, and it will hit U.S. financial markets very soon.

I hope that you are getting ready while you still can.

12 Ways The Economy Is Already In Worse Shape Than It Was During The Depths Of The Last Recession

Twelve - Public DomainDid you know that the percentage of children in the United States that are living in poverty is actually significantly higher than it was back in 2008?  When I write about an “economic collapse”, most people think of a collapse of the financial markets.  And without a doubt, one is coming very shortly, but let us not neglect the long-term economic collapse that is already happening all around us.  In this article, I am going to share with you a bunch of charts and statistics that show that economic conditions are already substantially worse than they were during the last financial crisis in a whole bunch of different ways.  Unfortunately, in our 48 hour news cycle world, a slow and steady decline does not produce many “sexy headlines”.  Those of us that are news junkies (myself included) are always looking for things that will shock us.  But if you stand back and take a broader view of things, what has been happening to the U.S. economy truly is quite shocking.  The following are 12 ways that the U.S. economy is already in worse shape than it was during the depths of the last recession…

#1 Back in 2008, 18 percent of all Americans kids were living in poverty.  This week, we learned that number has now risen to 22 percent

There are nearly three million more children living in poverty today than during the recession, shocking new figures have revealed.

Nearly a quarter of youngsters in the US (22 percent) or around 16.1 million individuals, were classed as living below the poverty line in 2013.

This has soared from just 18 percent in 2008 – during the height of the economic crisis, the Casey Foundation’s 2015 Kids Count Data Book reported.

#2 In early 2008, the homeownership rate in the U.S. was hovering around 68 percent.  Today, it has plunged below 64 percent.  Incredibly, it has not been this low in more than 20 years.  Just look at this chart – the homeownership rate has continued to plummet throughout Obama’s “economic recovery”…

Homeownership Rate 2015

#3 While Barack Obama has been in the White House, government dependence has skyrocketed to levels that we have never seen before.  In 2008, the federal government was spending about 37 billion dollars a year on the federal food stamp program.  Today, that number is above 74 billion dollars.  If the economy truly is “recovering”, why is government dependence so much higher than it was during the last recession?

#4 On the chart below, you can see that the U.S. national debt was sitting at about 9 trillion dollars when we entered the last recession.  Since that time, the debt of the federal government has doubled.  We are on the exact same path that Greece has gone down, and what you are looking at below is a recipe for national economic suicide…

Presentation National Debt

#5 During Obama’s “recovery”, real median household income has actually gone down quite a bit.  Just prior to the last recession, it was above $54,000 per year, but now it has dropped to about $52,000 per year…

Median Household Income

#6 Even though our incomes are stagnating, the cost of living just continues to rise steadily.  This is especially true of basic things that we all purchase such as food.  As I wrote about earlier this year, the price of ground beef in the United States has doubled since the last recession.

#7 In a healthy economy, lots of new businesses are opening and not that many are being forced to shut down.  But for each of the past six years, more businesses have closed in the United States than have opened.  Prior to 2008, this had never happened before in all of U.S. history.

#8 Barack Obama is constantly telling us about how unemployment is “going down”, but the truth is that the  percentage of working age Americans that are either working or considered to be looking for work has steadily declined since the end of the last recession…

Presentation Labor Force Participation Rate

#9 Some have suggested that the decline in the labor force participation rate is due to large numbers of older people retiring.  But the reality of the matter is that we have seen a spike in the inactivity rate for Americans in their prime working years.  As you can see below, the percentage of males between the ages of 25 and 54 that aren’t working and that aren’t looking for work has surged to record highs since the end of the last recession…

Presentation Inactivity Rate

#10 A big reason why we don’t have enough jobs for everyone is the fact that millions upon millions of good paying jobs have been shipped overseas.  At the end of Barack Obama’s first year in office, our yearly trade deficit with China was 226 billion dollars.  Last year, it was more than 343 billion dollars.

#11 Thanks to all of these factors, the middle class in America is dying.  In 2008, 53 percent of all Americans considered themselves to be “middle class”.  But by 2014, only 44 percent of all Americans still considered themselves to be “middle class”.

When you take a look at our young people, the numbers become even more pronounced.  In 2008, 25 percent of all Americans in the 18 to 29-year-old age bracket considered themselves to be “lower class”.  But in 2014, an astounding 49 percent of all Americans in that age range considered themselves to be “lower class”.

#12 This is something that I have covered before, but it bears repeating.  The velocity of money is a very important indicator of the health of an economy.  When an economy is functioning smoothly, people generally feel quite good about things and money flows freely through the system.  I buy something from you, then you take that money and buy something from someone else, etc.  But when an economy is in trouble, the velocity of money tends to go down.  As you can see on the chart below, a drop in the velocity of money has been associated with every single recession since 1960.  So why has the velocity of money continued to plummet since the end of the last recession?…

Velocity Of Money M2

If you are waiting for an “economic collapse” to happen, you can stop waiting.

One is unfolding right now before our very eyes.

But what most people really mean when they ask about these things is that they are wondering when the next great financial crisis will happen.  And as I discussed yesterday, things are lining up in textbook fashion for one to happen in our very near future.

Once the next great financial crisis does strike, all of the numbers that I just discussed above are going to get a whole lot worse.

So as bad as things are now, the truth is that this is just the beginning of the pain.

4 Things That Are Happening Today That Indicate That A Deflationary Financial Collapse Is Imminent

four asphalt - public domain
When financial markets crash, they do not do so in a vacuum.  There are always patterns, signs and indicators that tell us that something is about to happen.  In this article, I am going to share with you four patterns that are happening right now that also happened just prior to the great financial crisis of 2008.  These four signs are very strong evidence that a deflationary financial collapse is right around the corner.  Instead of the hyperinflationary crisis that so many have warned about, what we are about to experience is a collapse in asset prices, a massive credit crunch and a brief period of absolutely crippling deflation.  The response by national governments and global central banks to this horrific financial crisis will cause tremendous inflation down the road, but that comes later.  What comes first is a crisis that will initially look a lot like 2008, but will ultimately prove to be much worse.  The following are 4 things that are happening right now that indicate that a deflationary financial collapse is imminent…

#1 Commodities Are Crashing

In mid-2008, just before the U.S. stock market crashed in the fall, commodities started crashing hard.  Well, now it is happening again.  In fact, the Bloomberg Commodity Index just hit a 13 year low, which means that it is already lower than it was at any point during the last financial crisis…

#2 Oil Is Crashing

On Monday, the price of oil dipped back below $50 a barrel.  This has surprised many analysts, because a lot of them thought that the price of oil would start to rebound by now.

In early 2014, the price of a barrel of oil was sitting above $100 a barrel and the future of the industry looked very bright.  Since that time, the price of oil has fallen by more than 50 percent.

There is only one other time in all of history when the price of oil has fallen by more than $50 a barrel in such a short period of time.  That was in 2008, just before the great financial crisis that erupted later that year.  In the chart posted below, you can see how similar that last oil crash was to what we are experiencing right now…

Oil Price 2015

#3 Gold Is Crashing

Most people don’t remember that the price of gold took a very serious tumble in the run up to the financial crisis of 2008.  In early 2008, the price of gold almost reached $1000 an ounce, but by October it had fallen to nearly $700 an ounce.  Of course once the stock market finally crashed it ultimately propelled gold to unprecedented heights, but what we are concerned about for this article is what happens before a crisis arrives.

Just like in 2008, the price of gold has been hit hard in recent months.  And on Monday, the price of gold absolutely got slammed.  The following comes from USA Today

The yellow metal has tumbled to a five-year low amid a combination of diminishing investor fears related to foreign headwinds in Greece and China, and stronger growth in the U.S. which is leading to a stronger dollar and coming interest rate hikes from the Federal Reserve. Investors have been dumping shares of gold-related investments as other bearish signs, such as less demand from China and the breaking of key price support levels, add up.

Earlier today, an ounce of gold fell below $1,100 an ounce to $1,080, its lowest level since February 2010. Gold peaked around $1,900 an ounce back in 2011.

For years, I have been telling people that we were going to see wild swings in the prices of gold and silver.

And to be honest, the party is just getting started.  Personally, I particularly love silver for the long-term.  But you have got to be able to handle the roller coaster ride if you are going to get into precious metals.  It is not for the faint of heart.

#4 The U.S. Dollar Index Is Surging

Before the U.S. stock market crashed in the fall of 2008, the U.S. dollar went on a very impressive run.  This is something that you can see in the chart posted below.  Now, the U.S. dollar is experiencing a similar rise.  For a while there it looked like the rally might fizzle out, but in recent days the dollar has started to skyrocket once again.  That may sound like good news to most Americans, but the truth is that a strong dollar is highly deflationary for the global financial system as a whole for a variety of reasons.  So just like in 2008, this is not the kind of chart that we should want to see…

Dollar Index 2015

If a 2008-style financial crisis was imminent, these are the kinds of things that we would expect to see happen.  And of course these are not the only signs that are pointing to big problems in our immediate future.  For example, the last time there was a major stock market crash in China, it came just before the great U.S. stock market crash in the fall of 2008.  This is something that I covered in my previous article entitled “Guess What Happened The Last Time The Chinese Stock Market Crashed Like This?

As an attorney, I was trained to follow the evidence and to only come to conclusions that were warranted by the facts.  And right now, it seems abundantly clear that things are lining up in textbook fashion for another major financial crisis.

But even though what is happening right in front of our eyes is so similar to what happened back in 2008, most people do not see it.

And the reason why they do not see it is because they do not want to see it.

Just like with most things in life, most people end up believing exactly what they want to believe.

Yes, there is a segment of the population that are actually honest truth seekers.  If you have felt drawn to this website, you are probably one of them.  But overall, most people in our society are far more concerned with making themselves happy than they are about pursuing the truth.

So even though the signs are obvious, most people will never see what is coming in advance.

I hope that does not happen to you.

Germany Never Intended For Greece To Stay In The Euro

No Deal - Public DomainThere never was going to be any deal.  All along, Germany has been seeking to establish conditions that would never be met so that they could force Greece out of the eurozone.  But the Germans had to do this subtly so that they would end up looking “reasonable” and would not turn the rest of the eurozone against them.  So why does Germany want to get rid of Greece?  Well, to be honest, it is because the Germans are sick and tired of paying for Greek mistakes.  In Germany, there is an obsession with having a balanced budget.  They even have a term for it – “the black zero“.  So it absolutely infuriates the Germans that the Greeks can never seem to get their act together and that German citizens have to keep paying for it.  At this point, the amount of money that Germany has already poured into Greece breaks down to more than 700 euros per citizen, and now Greece is going to need a new bailout of somewhere between 82 billion and 86 billion euros over the next three years.  Needless to say, the Germans are fed up with pouring money down a financial black hole, and they know that if they keep bailing Greece out that it is only a matter of time before they will have to bail out Italy, Spain, Portugal, France, etc.

So, no, it hasn’t been the Greeks holding up a deal all this time.

It has been the Germans.

And now that we have reached the endgame, the Germans are pushing for what they have always wanted from the very beginning

The German government has begun preparations for Greece to be ejected from the eurozone, as the European Union faces 24 hours to rescue the single currency project from the brink of collapse.

Finance ministers failed to break the deadlock with Greece over a new bail-out package, after nine hours of acrimonious talks as creditors accused Athens of destroying their trust…

Should no deal be forthcoming, the German government has made preparations to negotiate a temporary five-year euro exit, providing Greece with humanitarian aid while it makes the transition….

The Germans are sick and tired of having the Greeks be so financially dependent on them.  So the Germans would really like to cut them off and have them go fend for themselves.

So that is why the EU laid out such draconian conditions for the Greeks over the weekend.  The following is how Zero Hedge summarized where things currently stand…

For those who missed today’s festivities in Brussels, here is the 30,000 foot summary: Europe has given Greece a “choice”: hand over sovereignty to Europe or undergo a 5 year Grexit “time out”, which is a polite euphemism for get the hell out.

As noted earlier, here are the 12 conditions laid out as a result of the latest Eurogroup meeting, which are far more draconian than anything presented to Greece yet and which effectively require that Greece cede sovereignty to Europe, this time even without the implementation of a technocratic government.

  1. Streamlining VAT
  2. Broadening the tax base
  3. Sustainability of pension system
  4. Adopt a code of civil procedure
  5. Safeguarding of legal independence for Greece ELSTAT – the statistics office
  6. Full implementation of autmatic spending cuts
  7. Meet bank recovery and resolution directive
  8. Privatize electricity transmission grid
  9. Take decisive action on non-performing loans
  10. Ensure independence of privatization body TAIPED
  11. De-Politicize the Greek administration
  12. Return of the Troika to Athens (the paper calls them the institutions… for now)

Greece has been given until Wednesday to pass all of the legislation necessary to implement all of those conditions.

And if Greece does somehow get all that done, it still won’t get them a deal.  All it will do is allow them to come back and restart negotiations.

Needless to say, the Greeks are steaming mad at this point.  This new “deal” is being called “very bad” and “insulting” by Greek politicians.

But what they may not understand is that Germany does not actually want any deal to happen.  Instead, they are working very, very hard to get the Greeks booted out of the euro.  The following comes from the Washington Post

The simple story is that Germany and the other hardline countries don’t trust Greece’s anti-austerity Syriza party to actually implement, well, austerity. And so rather than coughing up another 60 or 70 or 80 billion euros, they seem to want to push to kick Greece out of the common currency instead. That, at least, was the plan that leaked on Saturday. And now it’s part of the actual plan on Sunday. Indeed, it’s tentatively been included in the European finance ministers’ latest joint statement. This isn’t just what Germany is considering. It’s what Germany is trying to get the rest of Europe to go along with.

If anyone still doubts what the Germans are trying to do, here it is in black and white…

And this is not an idea that is new.  In fact, some hardliners in Germany have been pushing for a “temporary Greek exit” since at least 2012

This weekend’s events in Europe have clarified who is really running the show across the ‘union’. Hans-Werner Sinn, Chairman of the Ifo Institute for Economic Research, vehemnt euroskeptic, and head of the so-called ‘five wise men’ advising the German government and specifically Angela Merkel, confirmed his call from 2012 for a “temporary grexit from the euro.” The right wing economist previously explained “Greece and Portugal have to become 30-40% less expensive to be competitive again. This is being attempted through excessive austerity measures within the euro zone, but it won’t work. It will drive these countries to the brink of civil war before it succeeds. Temporary exits would very quickly stabilize these countries, create new jobs and free the population from the yoke of the euro.”

The Germans absolutely hate having to open up their wallets for someone else’s mess.  And they know that if they endlessly bail out Greece that it won’t end there.  Eventually, much of the rest of the continent will come to them for bailouts too.  I think that Nigel Farage nailed it when he summed up what Germany is thinking this way…

“The German thinking is: ‘Let’s get rid of this mess,'” Farage said. Expressing what he thought Germany was thinking about other troubled peripheral euro zone economies, he added: “‘let’s send a message to Italy, France, Spain and Portugal that actually, if you’re members of this club, you got to abide by our rules.'”

But I believe that Germany is greatly, greatly underestimating the damage that a “Grexit” is going to do to Greece and to the rest of the members of the EU.

In Greece, the banking system is already on the verge of total collapse.  We are being told that capital controls will remain in place “for at least six months”, and now Greek politicians are even talking about “a possible forced ‘bail-in’ of depositors”

Capital controls will stay in place at Greek banks for at least six months, senior officials in Athens warned yesterday, as the government fights to keep lenders afloat.

Leaders of the four main banks and finance ministry officials will meet tomorrow to discuss how to save the banking system from collapse after a run on deposits.

Options under consideration include a consolidation of four main banks down to two, creation of a “bad bank” to house toxic loans, and a possible forced “bail-in” of depositors.

Hmmm – I seem to recall someone warning about this exact scenario nearly two months ago: “Are They About To Confiscate Money From Bank Accounts In Greece Just Like They Did In Cyprus?

The economic depression in Greece is about to accelerate.  But things are also going to get hairy for the rest of the continent as well.  As I have warned about so many times, the euro is going to plunge like a rock, European stocks are going to crater, European bond yields are going to soar, and eventually we are actually going to see “too big to fail” banks all over Europe start to fail.

This is the big flaw in the German plan.  They truly believe that they can remove the “cancer” of Greece without causing any lasting damage to the rest of the eurozone.

Sadly, they are dead wrong.