 By a very wide margin, this is the most optimistic that Americans have been about the future since I started The Economic Collapse Blog in late 2009. Even though the middle class is shrinking, 102 million working age Americans do not have a job, and we are now 21 trillion dollars in debt, most people are feeling really good about things right now. Especially among Republicans, there is an overwhelming consensus that the United States is starting to head in the right direction and that better times are ahead. As a result, so many of the exact same people that were “prepping” while Barack Obama was in the White House are now partying now that Donald Trump is president. But none of the long-term trends that are systematically destroying our nation have been significantly altered, and none of our long-term problems have been solved. We are still steamrolling down a path toward national suicide, but most Americans simply do not care.
What Americans do care about is that it seems to be easier to find a job at the moment than it has in a very long time. In fact, the percentage of Americans that believe that it is “a good time to find a quality job” is at the highest level that Gallup has ever recorded…
Sixty-seven percent of Americans believe that now is a good time to find a quality job in the U.S., the highest percentage in 17 years of Gallup polling. Optimism about the availability of good jobs has grown by 25 percentage points since Donald Trump was elected president.
Gallup has asked Americans to say whether it is a good time or bad time to find a quality job monthly since August 2001. Prior to 2017, the percentage saying “good time” never reached 50%, but since Trump took office in January that year, the percentage has stayed at or above 50% and has been higher than 60% in eight of the past nine months.
A Rasmussen survey that asked a similar question came up with very similar results.
Of course the reality of the matter is that 66 percent of all jobs in the United States pay less than 20 dollars an hour, and 78 million Americans are participating in the “gig economy” because they need to supplement their normal incomes in order to make ends meet.
But perception is sometimes more powerful than reality, and right now the perception is that the U.S. economy is doing well…
“Nothing is better for the issues about trade wars or issues about G-7 than a good economy,” Omar Aguilar, chief investment officer for equities at Charles Schwab Investment Management, said by phone. “The jobs report on Friday gave a lot of people confidence that the U.S. economy is still pretty solid.”
Small businesses in the United States are also feeling extremely optimistic right now.
In fact, one survey found that small business optimism has surged to record highs…
The Q2 MetLife & U.S. Chamber of Commerce Small Business Index (Index) released today recorded an overall score of 68.7, up 2.4 points from the Q1 score of 66.3, driven in part by the strongest local economic outlook on record, a firmer hiring environment, and a stronger backdrop for investing. Two out of every three small business owners are optimistic about their company and the small business environment in the United States.
That is definitely a good sign, because we desperately need small businesses to do well, but is all of this optimism really warranted?
The financial markets continue to be filled with optimism as well. Despite the outbreak of an international trade war and tremendous turmoil over in Europe, the Nasdaq closed at a brand new record high on Tuesday.
In recent years stock prices have just continued to go up and up and up no matter what news breaks, and now we are facing the greatest stock market bubble in our history.
How long do we have until it finally bursts?
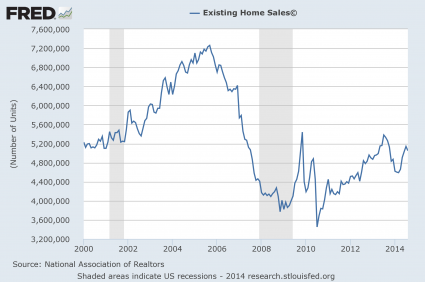
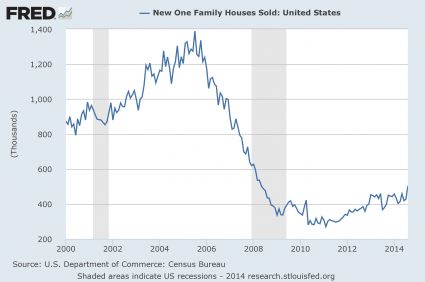
There is a lot of optimism in the housing market as well. At this point, a staggering 64 percent of all adults in this country believe that housing prices will continue to go up over the next year. The following comes from Marketwatch…
A majority of U.S. adults (64%) continue to believe home prices in their local area will increase over the next year, a recent survey released by polling firm Gallup concluded. That’s up nine percentage points over the past two years and is the highest percentage since before the housing market crash and Great Recession in the mid-2000s.
The level of optimism is edging closer to the 70% of adults in 2005 who said prices would continue rising. That, of course, was less than one year before the peak of the housing market bubble in early 2006, which was largely fueled by a wave of subprime lending.
Moving beyond short-term concerns, Americans are also becoming increasingly optimistic about the long-term future too. A recent Gallup survey discovered that approximately 60 percent of all Americans believe that our young people “will have a better life than their parents did”…
About six in 10 Americans say it is very or somewhat likely that today’s young people will have a better life than their parents did. The latest reading marks continued improvement since the low of 44% in 2011 but is still not back to the level of 66% measured in February 2008.
Hopefully the optimists will be correct, but I do not believe they will be. If we keep doing the same things that we have been doing as a nation, it is simply not possible that there will be any sort of a bright future for America.
And I will tell you one area where Americans are quite pessimistic. One recent survey found that 77 percent of all Americans believe that morality is in decline in this country. Our national character continues to deteriorate at a frightening pace, and most Americans appear to be quite aware that this is happening.
But instead of changing our ways, we proudly believe that our “greatness” will allow us to continue to enjoy a massively inflated debt-fueled standard of living for a very long time to come.
Unfortunately for us, it simply does not work that way, and as a nation we are way overdue for a very serious wake up call.
Michael Snyder is a nationally syndicated writer, media personality and political activist. He is the author of four books including The Beginning Of The End and Living A Life That Really Matters.