
When financial markets crash, they do not do so in a vacuum. There are always patterns, signs and indicators that tell us that something is about to happen. In this article, I am going to share with you four patterns that are happening right now that also happened just prior to the great financial crisis of 2008. These four signs are very strong evidence that a deflationary financial collapse is right around the corner. Instead of the hyperinflationary crisis that so many have warned about, what we are about to experience is a collapse in asset prices, a massive credit crunch and a brief period of absolutely crippling deflation. The response by national governments and global central banks to this horrific financial crisis will cause tremendous inflation down the road, but that comes later. What comes first is a crisis that will initially look a lot like 2008, but will ultimately prove to be much worse. The following are 4 things that are happening right now that indicate that a deflationary financial collapse is imminent…
#1 Commodities Are Crashing
In mid-2008, just before the U.S. stock market crashed in the fall, commodities started crashing hard. Well, now it is happening again. In fact, the Bloomberg Commodity Index just hit a 13 year low, which means that it is already lower than it was at any point during the last financial crisis…
The Bloomberg Commodity Index plunges to 13-year low, led by a drop in gold. http://t.co/03c3WYrlGe pic.twitter.com/8IY7TSVgk3
— Richard Bravo (@richbravo2) July 20, 2015
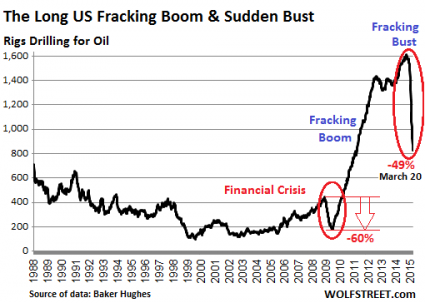
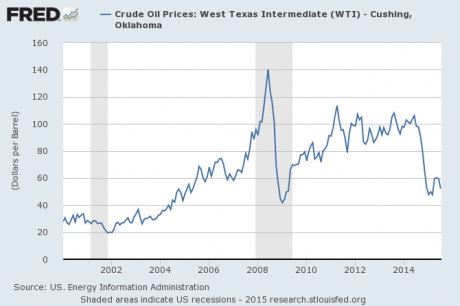
#2 Oil Is Crashing
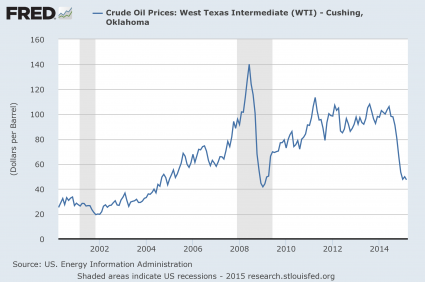
On Monday, the price of oil dipped back below $50 a barrel. This has surprised many analysts, because a lot of them thought that the price of oil would start to rebound by now.
In early 2014, the price of a barrel of oil was sitting above $100 a barrel and the future of the industry looked very bright. Since that time, the price of oil has fallen by more than 50 percent.
There is only one other time in all of history when the price of oil has fallen by more than $50 a barrel in such a short period of time. That was in 2008, just before the great financial crisis that erupted later that year. In the chart posted below, you can see how similar that last oil crash was to what we are experiencing right now…
#3 Gold Is Crashing
Most people don’t remember that the price of gold took a very serious tumble in the run up to the financial crisis of 2008. In early 2008, the price of gold almost reached $1000 an ounce, but by October it had fallen to nearly $700 an ounce. Of course once the stock market finally crashed it ultimately propelled gold to unprecedented heights, but what we are concerned about for this article is what happens before a crisis arrives.
Just like in 2008, the price of gold has been hit hard in recent months. And on Monday, the price of gold absolutely got slammed. The following comes from USA Today…
The yellow metal has tumbled to a five-year low amid a combination of diminishing investor fears related to foreign headwinds in Greece and China, and stronger growth in the U.S. which is leading to a stronger dollar and coming interest rate hikes from the Federal Reserve. Investors have been dumping shares of gold-related investments as other bearish signs, such as less demand from China and the breaking of key price support levels, add up.
Earlier today, an ounce of gold fell below $1,100 an ounce to $1,080, its lowest level since February 2010. Gold peaked around $1,900 an ounce back in 2011.
For years, I have been telling people that we were going to see wild swings in the prices of gold and silver.
And to be honest, the party is just getting started. Personally, I particularly love silver for the long-term. But you have got to be able to handle the roller coaster ride if you are going to get into precious metals. It is not for the faint of heart.
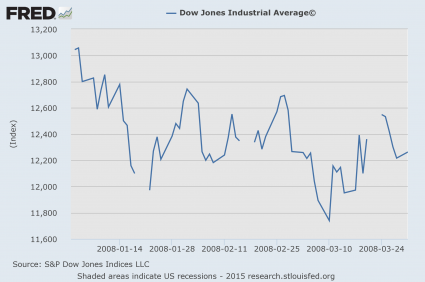
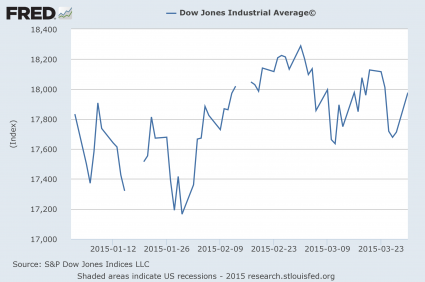
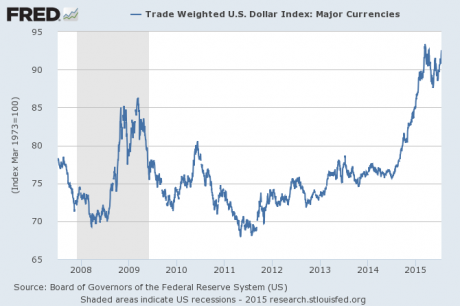
#4 The U.S. Dollar Index Is Surging
Before the U.S. stock market crashed in the fall of 2008, the U.S. dollar went on a very impressive run. This is something that you can see in the chart posted below. Now, the U.S. dollar is experiencing a similar rise. For a while there it looked like the rally might fizzle out, but in recent days the dollar has started to skyrocket once again. That may sound like good news to most Americans, but the truth is that a strong dollar is highly deflationary for the global financial system as a whole for a variety of reasons. So just like in 2008, this is not the kind of chart that we should want to see…
If a 2008-style financial crisis was imminent, these are the kinds of things that we would expect to see happen. And of course these are not the only signs that are pointing to big problems in our immediate future. For example, the last time there was a major stock market crash in China, it came just before the great U.S. stock market crash in the fall of 2008. This is something that I covered in my previous article entitled “Guess What Happened The Last Time The Chinese Stock Market Crashed Like This?”
As an attorney, I was trained to follow the evidence and to only come to conclusions that were warranted by the facts. And right now, it seems abundantly clear that things are lining up in textbook fashion for another major financial crisis.
But even though what is happening right in front of our eyes is so similar to what happened back in 2008, most people do not see it.
And the reason why they do not see it is because they do not want to see it.
Just like with most things in life, most people end up believing exactly what they want to believe.
Yes, there is a segment of the population that are actually honest truth seekers. If you have felt drawn to this website, you are probably one of them. But overall, most people in our society are far more concerned with making themselves happy than they are about pursuing the truth.
So even though the signs are obvious, most people will never see what is coming in advance.
I hope that does not happen to you.