 The U.S. economy has had six full years to bounce back since the financial collapse of 2008, and it simply has not happened. Median household income has declined substantially since then, total household wealth for middle class families is way down, the percentage of the population that is employed is still about where it was at the end of the last recession, and the number of Americans that are dependent on the government has absolutely exploded. Even those that claim that the economy is “recovering” admit that we are not even close to where we used to be economically. Many hope that someday we will eventually get back to that level, but the truth is that this is about as good as things are ever going to get for the middle class. And we should enjoy this period of relative stability while we still can, because when the next great financial crisis strikes things are going to fall apart very rapidly.
The U.S. Census Bureau has just released some brand new numbers, and they are quite sobering. For example, after accounting for inflation median household income in the United States has declined a total of 8 percent from where it was back in 2007.
That means that middle class families have significantly less purchasing power than they did just prior to the last major financial crisis.
And one research firm is projecting that it is going to take until 2019 for median household income to return to the level that we witnessed in 2007…
For everybody wondering why the economic recovery feels like a recession, here’s the answer: We’re still at least five years away from regaining everything lost during the 2007-2009 downturn.
Forecasting firm IHS Global Insight predicts that real median household income — perhaps the best proxy for middle-class living standards — won’t reach the prior peak from 2007 until 2019. Since the numbers are adjusted for inflation, that means the typical family will wait 12 years until their purchasing power is as strong as it was before the recession. That would be the longest period of stagnation, by far, since the Great Depression of the 1930s.
Of course that projection assumes that the economy will continue to “recover”, which is a very questionable assumption at best.
Meanwhile, total household wealth has been declining for middle class families as well.
According to the New York Times, the “typical American household” is now worth 36 percent less than it was worth a decade ago.
That is a pretty substantial drop. But you never hear our politicians (especially the Democrats) bring up numbers like that because they want us to feel good about things.
So why is all of this happening?
The biggest reason why the middle class is struggling so much is the lack of good jobs.
As the chart posted below demonstrates, the percentage of the working age population that is actually employed is still way, way below where it was prior to the last recession…
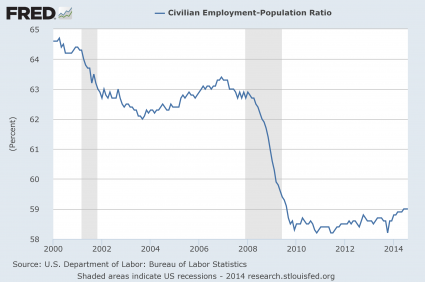
The “employment recovery” (the tiny little bump at the end of the chart) has been so miniscule that it is hardly even worth mentioning.
At the moment, we still have 1.4 million fewer full-time jobs than we did in 2008 even though more than 100,000 people are added to the U.S. population each month.
And a lot of the workers that have lost jobs since the start of the last recession have never been able to find a new one.
According to a brand new survey conducted by Rutgers University, more than 20 percent of all workers that have been laid off in the past five years still have not found a new job.
Meanwhile, the control freak bureaucrats that run this country continue to kill off small businesses.
In recent years we have seen large numbers of small businesses fail, and at this point the rate of small business ownership in the United States is at an all-time low.
As a result of everything that you have just read, the middle class is shrinking and dependence on the government is soaring.
Today, there are 49 million Americans that are dealing with food insecurity, and Americans received more than 2 trillion dollars in benefits from the federal government last year alone.
For many more statistics just like this, please see my previous article entitled “30 stats to show to anyone that does not believe the middle class is being destroyed“.
Without a doubt, things are not that good for the middle class in America these days.
Unfortunately, the next great wave of financial trouble is rapidly approaching, and once it strikes things are going to get substantially worse for the middle class.
Yes, the stock market set record high after record high this summer. But what we have observed is classic bubble behavior. So many of the exact same patterns that occurred just prior to previous stock market crashes are happening once again.
And it is interesting to note that September 22nd has marked important market peaks at various times throughout history…
For traders, September 22 is one of those days with a notorious history. UBS’s Art Cashin notes that September 22 marked various market highs in 1873, 1929, 1980, and even as recent as 2008.
Could the coming months be the beginning of the next major stock market decline?
Small-cap stocks are already starting to show signs of real weakness. In fact, the Russell 2000 just hit a “death cross” for the first time in more than 2 years…
The Russell 2000 has been diverging from the broader market over the last several weeks, and now technicians point out it has flashed a bearish signal. For the first time in more than two years, the small-cap index has hit a so-called death cross.
A death cross occurs when a nearer-term 50-day moving average falls below a longer-term, 200-day moving average. Technicians argue that a death cross can be a bearish sign.
None of us knows what the market is going to do tomorrow, but a lot of the “smart money” is getting out of the market right now while the getting is good.
So where is the “smart money” putting their assets?
In a previous article, I discussed how sales of gold bars to wealthy clients is way up so far this year.
And CNBC has just reported that the ultra-wealthy “are holding mountains of cash” right now…
Billionaires are holding mountains of cash, offering the latest sign that the ultra-wealthy are nervous about putting more money into today’s markets.
According to the new Billionaire Census from Wealth-X and UBS, the world’s billionaires are holding an average of $600 million in cash each—greater than the gross domestic product of Dominica.
Why are they doing this?
Are they concerned about the potential of a market crash?
And if we do see another market crash like we witnessed back in 2008, what is that going to mean for the rest of us?
2008 certainly did not destroy our economy.
But it did cause an immense amount of damage that we have never recovered from.
Now the next wave is approaching, and most people don’t even see it coming.
