The Dow Falls Another 364 Points And We Are Now Down 2200 Points From The Peak Of The Market

Falling - Public DomainIt was another day of utter carnage on Wall Street.  The Dow was down another 364 points, the S&P 500 broke below 1900, and the Nasdaq had a much larger percentage loss than either of them.  The Russell 2000 has now fallen 22 percent from the peak, and it has officially entered bear market territory.  After 13 days, this remains the worst start to a year for stocks ever, and trillions of dollars of stock market wealth has already been wiped out globally.  Meanwhile, junk bonds continue their collapse.  JNK got hammered all the way down to 33.06 as bond investors race for the exits.  In case you were wondering, this is exactly what a financial crisis look like.

Many of the “experts” had been proclaiming that “things are different this time” and that stocks could defy gravity forever.

Now we seeing that was not true at all.

So how far could stocks ultimately fall?

I have been telling my readers that stocks still need to fall about another 30 percent just to get to a level that is considered to be “normal” be historical standards, but the truth is that they could eventually fall much farther than that.

Just this week, Societe Generale economist Albert Edwards made headlines all over the world with his prediction that we could see the S&P 500 drop by a total of 75 percent…

If I am right and we have just seen a cyclical bull market within a secular bear market, then the next recession will spell real trouble for investors ill-prepared for equity valuations to fall to new lows. To bottom on a Shiller PE of 7x would see the S&P falling to around 550.

I will repeat that: If I am right, the S&P would fall to 550, a 75% decline from the recent 2100 peak. That obviously will be a catastrophe for the economy via the wealth effect and all the Fed’s QE hard work will turn dust.

That is why I believe the Fed will fight the next bear market with every weapon available including deeply negative Fed Funds rates in addition to more QE. Indeed, negative policy rates will become ubiquitous.

Most believe a 75% equity bear market to be impossible. But those same people said something similar prior to the 2008 Global Financial Crisis. They, including the Fed, failed to predict the vulnerability of the US economy that would fall into deep recession, well before Lehman’s went bust in September 2008.

Other than stocks, there are three key areas that I want my readers to keep an eye on during the weeks ahead…

1. The Price Of Oil – The price of oil doesn’t have to go one penny lower to continue causing catastrophic damage in the financial world.  If we hover around 30 dollars a barrel, we will see more bankruptcies, more defaults, more layoffs and more carnage for energy stocks.  But of course it is quite conceivable that the price of oil could easily slide a lot farther.  Just check out some of the predictions that some of the biggest banks in the entire world are now making

Just this week Morgan Stanley warned that the super-strong U.S. dollar could drive crude oil to $20 a barrel. Not to be outdone, Royal Bank of Scotland said $16 is on the horizon, comparing the current market mood to the days before the implosion of Lehman Brothers in 2008.

Standard Chartered doesn’t think those dire predictions are dark enough. The British bank said in a new research report that oil prices could collapse to as low as $10 a barrel — a level unseen since November 2001.

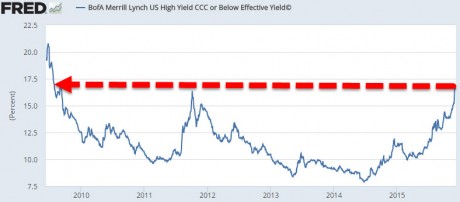
2. Junk Bonds – This is something that I have written about repeatedly.  Right now, we are witnessing an epic collapse of the junk bond market, just like we did just prior to the great stock market crash of 2008.  As I mentioned above, Wednesday was a particularly brutal day for junk bonds, and Jeffrey Gundlach seems convinced that the worst is still yet to come…

He seemed to leave his most dire predictions for junk bonds, a part of the market he’s been bearish on for years. Gundlach believes hedge funds investing in risky debts face major liquidity risks if they are forced to exit positions amid investor redemptions. “We could be looking at a real ugly situation in the first quarter of 2016,” Gundlach said on a Tuesday call with investors, when referring to redemptions.

Because many hedge funds operate with leverage, he raised an alarming prospect that those who don’t redeem could be left with losses far more severe than their marks indicate. As the Federal Reserve raises rates, redemptions combined with tightening credit conditions could create major pricing dislocations.

3. Emerging Markets – We have not seen money being pulled out of emerging markets at this kind of rate in decades.  We are seeing a repeat of the conditions that caused the Latin American debt crisis of the 1980s and the Asian financial crisis of the 1990s.  Only this time what we are witnessing is truly global in scope, and central bankers are beginning to panic.  The following comes from Wolf Richter

Last year was a terrible year, probably worse than 2009,” the head of Mexico’s central bank told a conference of central bankers in Paris on Tuesday. It was the first year since 1988 that emerging markets saw net capital outflows, according to the Institute of International Finance, a Washington-based association of global banks and finance houses.

In December more than $3.1 billion fled emerging market funds. If anything, the New Year has been worse.

“I don’t have any data yet for the first week of 2016 but it’s probably going to be very, very, very bad,” Carstens said. If conditions do not improve, he warned, central banks in emerging markets may have little choice but to adopt a more “radical” approach to monetary policy, including intervening in domestic bonds and securities markets.

In addition to everything that I just shared with you, we got several other very troubling pieces of news on Wednesday…

-Canadian stocks continued their dramatic plunge and have now officially entered a bear market.

-PC sales just hit an eight year low.

-GoPro just announced that it is getting rid of 7 percent of its total workforce.

The bad news is coming fast and furious now.  The snowball that started rolling downhill about halfway last year has set off an avalanche, and panic has gripped the financial marketplace.

But my readers knew all of this was coming in advance.  What we are witnessing right now is simply the logical extension of trends that have been building for months.  The global financial crisis that started during the second half of 2015 is now bludgeoning Wall Street mercilessly, and investors are in panic mode.

So what comes next?

We have never seen a year start like this, so it is hard to say.  And if there is some sort of a major “trigger event” in our near future, we could see some single day crashes that make history.

Either way, the hounds have now been released, and it is going to be exceedingly difficult to get them back into the barn.

Guess What Happened The Last Time Junk Bonds Started Crashing Like This? Hint: Think 2008

Thumbs Down - Public Domain
The extreme carnage that we are witnessing in the junk bond market right now is one of the clearest signals yet that a major U.S. stock market crash is imminent.  For those that are not familiar with “junk bonds”, please don’t get put off by the name.  They aren’t really “junk”.  They simply have a higher risk and thus a higher return than other bonds of the same type.  And yesterday, I explained why I watch them so closely.  If stocks are going to crash, you would expect to see a junk bond crash first.  This happened in 2008, and it is happening again right now.  On Monday, a high yield bond ETF known as JNK crashed through the psychologically important 35.00 barrier for the very first time since the last financial crisis.  On Tuesday, high yield bonds had their worst day in three months, and JNK plummeted all the way down to 34.44.  When I saw this I was absolutely stunned.  This is precisely the kind of junk bond crash that I have been anticipating that we would soon witness.

Normally, stocks and junk bonds track one another very closely, but just like before the 2008 crash, they have become decoupled in recent months.  Anyone that even has an elementary understanding of the financial world knows that this cannot continue indefinitely.  And when they start converging once again, the movement could be quite violent.

When I chose to use the word “carnage” to open this article, I was not exaggerating what is going on in the junk bond market one bit.  On Tuesday evening, Jeffrey Gundlach used the exact same word to describe what is happening…

Jeffrey Gundlach, the widely followed investor who runs DoubleLine Capital, said on a webcast on Tuesday that the junk bond market has come under severe selling pressure ahead of the Federal Reserve’s policy meeting next week.

We are looking at real carnage in the junk bond market,” Gundlach said. Gundlach also said it was too early to buy high-yield junk bonds and energy debt securities. “I don’t like things when they go down every single day.”

Sometimes a chart can be extremely helpful in understanding what is going on.  The following chart was posted by Zero Hedge on Tuesday, and it shows that yields on the riskiest junk bonds are heading into the stratosphere…

High Yield Debt - from Zero Hedge

And for those that are not familiar, it is important to note that when yields go up, bond prices go down.  So the chart above is what a “crash” looks like.

Another “leading indicator” that I watch is the behavior of Dow Transports.

Dow Transports started crashing before the Dow Jones Industrial Average did back in August, and now it is happening again

Dow Transports are in reverse. Down over 3% today, the biggest drop since the Black Monday collapse, Trannies are now below the lows of the Bullard bounce from October 2014 and down a shocking 16% in 2015. This would be the first four-quarters-in-a-row drop in Transports since 1994 and the worst year since 2008…

In addition, we are also seeing trouble signs erupt at major financial institutions just like we did during the run up to the 2008 crash.  For example, I have been concerned about Morgan Stanley for quite a while, and on Tuesday we learned that they have just laid off more than a thousand workers

Struggling Morgan Stanley slashed 1,200 jobs around the world in recent days, a person familiar with the matter told CNNMoney.

The cuts were broad-based and eliminated 25% of the positions within the fixed income and commodities businesses, the person said. Those divisions are grappling with tumbling trading revenue and shrinking fees.

Morgan Stanley also eliminated about 730 back-office jobs like human-resources and IT positions.

Virtually all of the things that we would expect to see just prior to a 2008-style stock market crash are happening right now.

If just two or three leading indicators were flashing red, we could have a really good debate about what they might mean.

But the fact that virtually all of the numbers are screaming a warning at us should mean that the debate is over.  Anyone with an open mind should be able to very clearly see what is coming next.

Very quickly, let me give you just 10 signs that indicate that we are right on the precipice of a major recession and a very substantial financial downturn…

1. Global GDP growth has gone negative for the first time since 2009.

2. Corporate earnings growth has turned negative.

3. S&P 500 net profit margins are steeply declining.  According to Tony Sagami, “since 1973, there has been only one 60 bps decline in S&P 500 net profit margin that didn’t lead to a recession.”

4. In October, U.S. imports of goods declined by 6.6 percent on a year over year basis.

5. In October, U.S. exports of goods declined by 10.4 percent on a year over year basis.

6. U.S. manufacturing is contracting at the fastest pace that we have seen since the last recession.

7. Corporate debt defaults have risen to the highest level that we have seen since the last recession.

8. Credit card numbers that were recently released show that holiday sales have gone negative for the first time since the last recession.

9. The velocity of money in the United States has dropped to the lowest level ever recorded.

10. Of the 93 largest stock market indexes in the entire world, 47 of them (slightly more than half) have already plunged at least 10 percent year to date.

Just like in 2008, other global financial markets are imploding ahead of a U.S. collapse.

On Tuesday, the Dow Jones Industrial Average was down another 162 points, but we are still within 1000 points of the market peak that was set earlier this year.  We are still in far better shape than most of the rest of the world, but that will soon change.

I can’t think of a single leading indicator that is telling us that everything is going to be okay.  All of the numbers are pointing to major trouble ahead.  So I hope that you are being smart and doing what you can to get prepared while there is still time.

4 Harbingers Of Stock Market Doom That Foreshadowed The 2008 Crash Are Flashing Red Again

Hourglass - Public DomainSo many of the exact same patterns that we witnessed just before the stock market crash of 2008 are playing out once again right before our eyes.  Most of the time, a stock market crash doesn’t just come out of nowhere.  Normally there are specific leading indicators that we can look for that will tell us if major trouble is on the horizon.  One of these leading indicators is the junk bond market.  Right now, a closely watched high yield bond ETF known as JNK is sitting at 35.77.  If it falls below 35, that will be a major red flag, and it will be the first time that it has done so since 2009.  As you can see from this chart, JNK started crashing in June and July of 2008 – well before equities started crashing later that year.  A crash in junk bonds almost always precedes a major crash in stocks, and so this is something that I am watching carefully.

And there is a reason why junk bonds are crashing.  In 2015 we have seen the most corporate bond downgrades since the last financial crisis, and corporate debt defaults are absolutely skyrocketing.  The following comes from a recent piece by Porter Stansberry

So far this year, nearly 300 U.S. corporations have seen their bonds downgraded. That’s the most downgrades per year since the financial crisis of 2008-2009. The year isn’t over yet. Neither are the downgrades. More worrisome, the 12-month default rate on high-yield corporate debt has doubled this year. This suggests we are well into the next major debt-default cycle.

Another thing that I am watching closely is the price of oil.

A massive crash in the price of oil preceded the stock market crash of 2008, and over the past year we have seen another dramatic crash in the price of oil.

Many had been expecting the price of oil to bounce back, but instead we are seeing new downward momentum.  In fact, according to Business Insider the price of U.S. oil briefly dipped below $43 a barrel on Wednesday…

Crude oil was down nearly 3% in morning trade on Wednesday.

West Texas Intermediate crude oil futures in New York dropped to as low as $42.97 per barrel. Futures touched a $42-handle in the last week of October, but last traded near those levels for a considerable period in August.

Another thing that I am watching is the ongoing crash of other industrial commodities.  This is something that also preceded the stock market crash of 2008, and it is a clear sign that global economic activity is really slowing down.

Prices for industrial commodities such as aluminum, tin, iron ore and coal are all crashing.  But the commodity that has me most alarmed personally is copper.

Economists commonly refer to it as “Dr. Copper”, and there is a very good reason for that.  Looking back over history, the price of copper often makes a significant move in one direction or the other before the overall economy does.  And the price of copper almost always starts declining before stocks do.

As I write this, the price of copper has fallen to $2.21, and it is already lower than at any point since the last financial crisis.  To get a better perspective regarding what I am talking about, just check out this chart.  This is one signal that is absolutely screaming that a major financial crisis is imminent.

One more harbinger of financial doom on the horizon is the surging U.S. dollar.  The U.S. dollar surged just before the financial crisis of 2008, and now it is happening again.

Most Americans don’t understand this, but the truth is that a rising U.S. dollar puts an incredible amount of stress on emerging markets all around the globe.  Since the last financial crisis, many of these emerging markets have been on a massive debt binge, and much of that debt was denominated in U.S. dollars.  Now that the dollar has increased in value, emerging market borrowers are finding that it takes much more of their own local currencies to service and pay back those debts.  Defaults are rapidly rising, and emerging market economies all over the world (such as Brazil) have already plunged into recession.

If the Fed does follow through with an interest rate hike in December, that is going to make things even worse.  The U.S. dollar will surge even more, and emerging markets will be in even more trouble.

At the same time that the dollar is getting stronger, the euro is getting weaker.  An article that was posted by CNBC on Wednesday went so far as to state that “it is now looking like the euro reaching parity with the greenback is all but guaranteed”…

The prospect of the Fed hiking interest rates in December has pushed the dollar higher, and it is now looking like the euro reaching parity with the greenback is all but guaranteed.

Strategists, however, disagree on how quickly that will happen and how much more the dollar can appreciate in the near term. That depends, they say, on the Fed, and how fast it will raise interest rates in a world where other central banks are moving in the opposite direction toward easier policy.

Goldman Sachs analysts this week reiterated that they expect euro parity with the dollar by year-end though other strategists expect the decline in the common currency against the dollar to take longer.

Let’s see, who has been warning that this would happen for more than a year?  Here are just a few examples…

July 19th: “For a long time, I have been repeating my prediction that the euro would fall to parity with the U.S. dollar.”

June 28th: “As I have warned repeatedly, the euro is heading for parity with the U.S. dollar, and at some point it will drop below parity.”

May 25th: “As I have warned so many times before, the euro is headed for parity with the U.S. dollar, and then it is going to go below parity.”

In August 2014, just a little bit over a year ago, the EUR/USD was sitting above 1.30.  At that time very few people out there would have ever imagined we would be talking about parity just a little more than a year later.

This is just the beginning of a time of great financial volatility.  The things that we are going to witness in the months and years to come are going to be absolutely unprecedented.  A massive global debt super-cycle is coming to an end, and the pain that this is going to mean for the global economy is almost too great to put into words.