Guess What Happened The Last Time Junk Bonds Started Crashing Like This? Hint: Think 2008

Thumbs Down - Public Domain
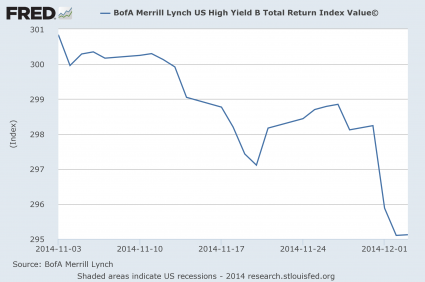
The extreme carnage that we are witnessing in the junk bond market right now is one of the clearest signals yet that a major U.S. stock market crash is imminent.  For those that are not familiar with “junk bonds”, please don’t get put off by the name.  They aren’t really “junk”.  They simply have a higher risk and thus a higher return than other bonds of the same type.  And yesterday, I explained why I watch them so closely.  If stocks are going to crash, you would expect to see a junk bond crash first.  This happened in 2008, and it is happening again right now.  On Monday, a high yield bond ETF known as JNK crashed through the psychologically important 35.00 barrier for the very first time since the last financial crisis.  On Tuesday, high yield bonds had their worst day in three months, and JNK plummeted all the way down to 34.44.  When I saw this I was absolutely stunned.  This is precisely the kind of junk bond crash that I have been anticipating that we would soon witness.

Normally, stocks and junk bonds track one another very closely, but just like before the 2008 crash, they have become decoupled in recent months.  Anyone that even has an elementary understanding of the financial world knows that this cannot continue indefinitely.  And when they start converging once again, the movement could be quite violent.

When I chose to use the word “carnage” to open this article, I was not exaggerating what is going on in the junk bond market one bit.  On Tuesday evening, Jeffrey Gundlach used the exact same word to describe what is happening…

Jeffrey Gundlach, the widely followed investor who runs DoubleLine Capital, said on a webcast on Tuesday that the junk bond market has come under severe selling pressure ahead of the Federal Reserve’s policy meeting next week.

We are looking at real carnage in the junk bond market,” Gundlach said. Gundlach also said it was too early to buy high-yield junk bonds and energy debt securities. “I don’t like things when they go down every single day.”

Sometimes a chart can be extremely helpful in understanding what is going on.  The following chart was posted by Zero Hedge on Tuesday, and it shows that yields on the riskiest junk bonds are heading into the stratosphere…

High Yield Debt - from Zero Hedge

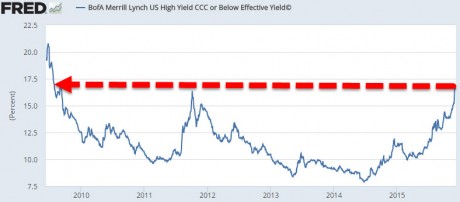
And for those that are not familiar, it is important to note that when yields go up, bond prices go down.  So the chart above is what a “crash” looks like.

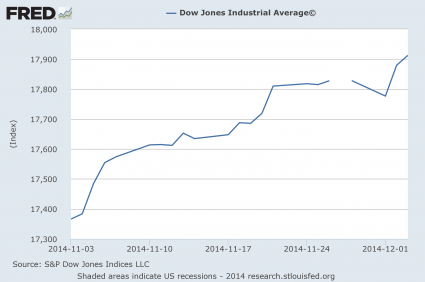
Another “leading indicator” that I watch is the behavior of Dow Transports.

Dow Transports started crashing before the Dow Jones Industrial Average did back in August, and now it is happening again

Dow Transports are in reverse. Down over 3% today, the biggest drop since the Black Monday collapse, Trannies are now below the lows of the Bullard bounce from October 2014 and down a shocking 16% in 2015. This would be the first four-quarters-in-a-row drop in Transports since 1994 and the worst year since 2008…

In addition, we are also seeing trouble signs erupt at major financial institutions just like we did during the run up to the 2008 crash.  For example, I have been concerned about Morgan Stanley for quite a while, and on Tuesday we learned that they have just laid off more than a thousand workers

Struggling Morgan Stanley slashed 1,200 jobs around the world in recent days, a person familiar with the matter told CNNMoney.

The cuts were broad-based and eliminated 25% of the positions within the fixed income and commodities businesses, the person said. Those divisions are grappling with tumbling trading revenue and shrinking fees.

Morgan Stanley also eliminated about 730 back-office jobs like human-resources and IT positions.

Virtually all of the things that we would expect to see just prior to a 2008-style stock market crash are happening right now.

If just two or three leading indicators were flashing red, we could have a really good debate about what they might mean.

But the fact that virtually all of the numbers are screaming a warning at us should mean that the debate is over.  Anyone with an open mind should be able to very clearly see what is coming next.

Very quickly, let me give you just 10 signs that indicate that we are right on the precipice of a major recession and a very substantial financial downturn…

1. Global GDP growth has gone negative for the first time since 2009.

2. Corporate earnings growth has turned negative.

3. S&P 500 net profit margins are steeply declining.  According to Tony Sagami, “since 1973, there has been only one 60 bps decline in S&P 500 net profit margin that didn’t lead to a recession.”

4. In October, U.S. imports of goods declined by 6.6 percent on a year over year basis.

5. In October, U.S. exports of goods declined by 10.4 percent on a year over year basis.

6. U.S. manufacturing is contracting at the fastest pace that we have seen since the last recession.

7. Corporate debt defaults have risen to the highest level that we have seen since the last recession.

8. Credit card numbers that were recently released show that holiday sales have gone negative for the first time since the last recession.

9. The velocity of money in the United States has dropped to the lowest level ever recorded.

10. Of the 93 largest stock market indexes in the entire world, 47 of them (slightly more than half) have already plunged at least 10 percent year to date.

Just like in 2008, other global financial markets are imploding ahead of a U.S. collapse.

On Tuesday, the Dow Jones Industrial Average was down another 162 points, but we are still within 1000 points of the market peak that was set earlier this year.  We are still in far better shape than most of the rest of the world, but that will soon change.

I can’t think of a single leading indicator that is telling us that everything is going to be okay.  All of the numbers are pointing to major trouble ahead.  So I hope that you are being smart and doing what you can to get prepared while there is still time.

Junk Bonds Are Going To Tell Us Where The Stock Market Is Heading In 2015

Dominoes - Public DomainDo you want to know if the stock market is going to crash next year?  Just keep an eye on junk bonds.  Prior to the horrific collapse of stocks in 2008, high yield debt collapsed first.  And as you will see below, high yield debt is starting to crash again.  The primary reason for this is the price of oil.  The energy sector accounts for approximately 15 to 20 percent of the entire junk bond market, and those energy bonds are taking a tremendous beating right now.  This panic in energy bonds is infecting the broader high yield debt market, and investors have been pulling money out at a frightening pace.  And as I have written about previously, almost every single time junk bonds decline substantially, stocks end up following suit.  So don’t be fooled by the fact that some comforting words from Janet Yellen caused stock prices to jump over the past couple of days.  If you really want to know where the stock market is heading in 2015, keep a close eye on the market for high yield debt.

If you are not familiar with junk bonds, the concept is actually very simple.  Corporations that do not have high credit ratings typically have to pay higher interest rates to borrow money.  The following is how USA Today describes these bonds…

High-yield bonds are long-term IOUs issued by companies with shaky credit ratings. Just like credit card users, companies with poor credit must pay higher interest rates on loans than those with gold-plated credit histories.

But in recent years, interest rates on junk bonds have gone down to ridiculously low levels.  This is another bubble that was created by Federal Reserve policies, and it is a colossal disaster waiting to happen.  And unfortunately, there are already signs that this bubble is now beginning to burst

Back in June, the average junk bond yield was 3.90 percentage points higher than Treasury securities. The average energy junk bond yielded 3.91 percentage points higher than Treasuries, Lonski says.

That spread has widened to 5.08 percentage points for junk bonds vs. 7.86 percentage points for energy bonds — an indication of how worried investors are about default, particularly for small, highly indebted companies in the fracking business.

The reason why so many analysts are becoming extremely concerned about this shift in junk bonds is because we also saw this happen just before the great stock market crash of 2008.  In the chart below, you can see how yields on junk bonds started to absolutely skyrocket in September of that year…

High Yield Debt 2008

Of course we have not seen a move of that magnitude quite yet this year, but without a doubt yields have been spiking.  The next chart that I want to share is of this year.  As you can see, the movement over the past month or so has been quite substantial…

High Yield Debt 2014

And of course I am far from the only one that is watching this.  In fact, there are some sharks on Wall Street that plan to make an absolute boatload of cash as high yield bonds crash.

One of them is Josh Birnbaum.  He correctly made a giant bet against subprime mortgages in 2007, and now he is making a giant bet against junk bonds

When Josh Birnbaum was at Goldman Sachs in 2007, he made a huge bet against subprime mortgages.

Now he’s betting against something else: high-yield bonds.

From The Wall Street Journal:

Joshua Birnbaum, the ex-Goldman Sachs Group Inc. trader who made bets against subprime mortgages during the financial crisis, now has more than $2 billion in wagers against high-yield bonds at his Tilden Park Capital Management LP hedge-fund firm, according to investor documents.

Could you imagine betting 2 billion dollars on anything?

If he is right, he is going to make an incredible amount of money.

And I have a feeling that he will be.  As a recent New American article detailed, there is already panic in the air…

It’s a mania, said Tim Gramatovich of Peritus Asset Management who oversees a bond portfolio of $800 million: “Anything that becomes a mania — ends badly. And this is a mania.”

Bill Gross, who used to run PIMCO’s gigantic bond portfolio and now advises the Janus Capital Group, explained that “there’s very little liquidity” in junk bonds. This is the language a bond fund manager uses to tell people that no one is buying, everyone is selling. Gross added: “Everyone is trying to squeeze through a very small door.”

Bonds issued by individual energy developers have gotten hammered. For instance, Energy XXI, an oil and gas producer, issued more than $2 billion in bonds just in the last four years and, up until a couple of weeks ago, they were selling at 100 cents on the dollar. On Friday buyers were offering just 64 cents. Midstates Petroleum’s $700 million in bonds — rated “junk” by both Moody’s and Standard and Poor’s — are selling at 54 cents on the dollar, if buyers can be found.

So is there anything that could stop junk bonds from crashing?

Yes, if the price of oil goes back up to 80 dollars or more a barrel that would go a long way to settling things back down.

Unfortunately, many analysts are convinced that the price of oil is going to head even lower instead…

“We’re continuing to search for a bottom, and might even see another significant drop before the year-end,” said Gene McGillian, an analyst at Tradition Energy in Stamford, Connecticut.

As I write this, the price of U.S. oil has fallen $1.69 today to $54.78.

If the price of oil stays this low, junk bonds are going to keep crashing.

If junk bonds keep crashing, the stock market is almost certainly going to follow.

For additional reading on this, please see my previous article entitled “‘Near Perfect’ Indicator That Precedes Almost Every Stock Market Correction Is Flashing A Warning Signal“.

But just like in the years leading up to the crash of 2008, there are all kinds of naysayers proclaiming that a collapse will never happen.

Even though our financial problems and our underlying economic fundamentals have gotten much worse since the last crisis, they are absolutely convinced that things are somehow going to be different this time.

In the end, a lot of those skeptics are going to lose an enormous amount of money when the dominoes start falling.

‘Near Perfect’ Indicator That Precedes Almost Every Stock Market Correction Is Flashing A Warning Signal

Exclamation Marks - Public DomainAre we about to see U.S. stocks take a significant tumble?  If you are looking for a “canary in the coal mine” for the U.S. stock market, just look at high yield bonds.  In recent years, almost every single time junk bonds have declined substantially there has been a notable stock market correction as well.  And right now high yield bonds are steadily moving lower.  The biggest reason for this is falling oil prices.  As I wrote about the other day, energy companies now account for about 20 percent of the high yield bond market.  As the price of oil falls, investors are understandably becoming concerned about the future prospects of those companies and are dumping their bonds.  What is happening cannot be described as a “crash” just yet, but there has been a pretty sizable decline for junk bonds over the past month.  And as I noted above, junk bonds and stocks usually move in tandem.  In fact, junk bonds usually start falling before stocks do.  So does the decline in high yield bonds that we are witnessing at the moment indicate that we are on the verge of a significant stock market correction?

That is a question that CNBC asked in a recent article entitled “Near perfect sell signal says stocks should drop“…

The S&P 500 and the iShares iBoxx High Yield Corporate Bond ETF are a mirror image since the start of the year, but since the end of October, high yield has diverged to the lower right, and yet the S&P 500 has continued to record highs. Since separating in October, the S&P 500 is up 3 percent, while the high-yield ETF is down 4 percent.

On 10 occasions since 2007, the high-yield ETF dropped 5 percent in 30 trading days. During nine of those instances, the S&P 500 fell as well, with an average return of negative 9 percent, according to CNBC analysis using Kensho.

Only once did high yield give a false sell signal. That was last year, when the market was already entranced by the Federal Reserve’s quantitative easing program, which has seemed to elevate stocks with an abnormal consistency. And even then, the S&P 500 managed just a 0.4 percent climb amid the junk debt rout.

Personally, I am convinced that this correlation between junk bonds and stocks is very significant.

Let’s just go back and look at what happened during the financial crash of 2008 for a moment.

In the chart posted below, you can see that high yield bonds began crashing in the middle of September that year…

High Yield Bonds 2008

But U.S. stocks did not crash at the same time.  In fact, the chart below shows that they did not really begin crashing until early October…

Dow Jones Industrial Average 2008

That is why analysts often refer to junk bonds as a “leading indicator”.  What happens to high yield debt is often a really good indicator of what is about to happen to stocks.

Now let’s take a look at what is happening today.

Since the beginning of November, junk bonds have been falling steadily…

High Yield Bonds November

Meanwhile, the Dow has continued to reach new heights…

Dow Jones Industrial Average November

This is not a state of affairs that can persist indefinitely.  Either junk bonds will rebound or U.S. stocks will start falling.

If the U.S. economy was on solid footing, you could perhaps argue that it could go either way.

Unfortunately, that is not the case.  At this point, the stock market has become completely divorced from economic fundamentals.  Price to earnings ratios are at absurd levels, margin debt is hovering near record highs, and the “real economy” continues to fall apart.  We are enjoying a massively inflated standard of living which is being propped up by the largest mountain of debt in world history, and it is only a matter of time before reality starts catching up with us.

And the signs of our long-term economic decline are all around us if you are willing to look at them.  For example, the lead headline on the Drudge Report today was about how China has now overtaken us and has become the largest economy on the planet

Hang on to your hats, America.

And throw away that big, fat styrofoam finger while you’re about it.

There’s no easy way to say this, so I’ll just say it: We’re no longer No. 1. Today, we’re No. 2. Yes, it’s official. The Chinese economy just overtook the United States economy to become the largest in the world. For the first time since Ulysses S. Grant was president, America is not the leading economic power on the planet.

It just happened — and almost nobody noticed.

The International Monetary Fund recently released the latest numbers for the world economy. And when you measure national economic output in “real” terms of goods and services, China will this year produce $17.6 trillion — compared with $17.4 trillion for the U.S.A.

Meanwhile, some of the most iconic companies in the United States continue to struggle deeply.  For instance, Sears has just announced that the number of store closings for this year is going to reach a total of 235 and that the company lost more than half a billion dollars during the third quarter of 2014 alone…

Sears Holdings Corp., posted a disappointing third quarter Thursday that saw revenue, earnings, and sales at stores open at least a year all fall as the retailer tries to salvage its business.

Sears, which owns Kmart, lost $548 million, or $5.15 a share, for the period ended Nov. 1. That’s up from a loss of $534 million, or $5.03 a share, in the year-ago period.

Even though Sears is losing more than 500 million dollars a quarter, banks and investors continue to inject new money into the corporation.  That is a crying shame, because Sears is a company that is going to zero.  Anyone that is investing in Sears at this point is just pouring their money into a black hole.  As Kevin O’Leary would say, they are guilty of murdering money.

And of course what is happening to Sears is just part of the broader “retail apocalypse” that I keep writing about.  In order for retailers to thrive they need healthy consumers, and consumers are not financially healthy because the real economy is a disaster zone.

But these days so many people are in denial.  The stock market has been soaring for so long that many skeptics are now proclaiming that another 2008-style crash will never happen.  Even though the fact that we are in the midst of an absolutely insane financial bubble should be glaringly obvious to anyone with half a brain, these skeptics have convinced themselves that the current state of affairs can persist indefinitely.

Sadly, it looks like what is about to hit us in 2015 is going to serve as a very rude wake up call for them and for the millions of other Americans that currently have their heads in the sand.

Guess What Happened The Last Time The Price Of Oil Crashed Like This?…

Price Of Oil Causes A Junk Bond Crash - Public DomainThere has only been one other time in history when the price of oil has crashed by more than 40 dollars in less than 6 months.  The last time this happened was during the second half of 2008, and the beginning of that oil price crash preceded the great financial collapse that happened later that year by several months.  Well, now it is happening again, but this time the stakes are even higher.  When the price of oil falls dramatically, that is a sign that economic activity is slowing down.  It can also have a tremendously destabilizing affect on financial markets.  As you will read about below, energy companies now account for approximately 20 percent of the junk bond market.  And a junk bond implosion is usually a signal that a major stock market crash is on the way.  So if you are looking for a “canary in the coal mine”, keep your eye on the performance of energy junk bonds.  If they begin to collapse, that is a sign that all hell is about to break loose on Wall Street.

It would be difficult to overstate the importance of the shale oil boom to the U.S. economy.  Thanks to this boom, the United States has become the largest oil producer on the entire planet.

Yes, the U.S. now actually produces more oil than either Saudi Arabia or Russia.  This “revolution” has resulted in the creation of  millions of jobs since the last recession, and it has been one of the key factors that has kept the percentage of Americans that are employed fairly stable.

Unfortunately, the shale oil boom is coming to an abrupt end.  As a recent Vox article discussed, OPEC has essentially declared a price war on U.S. shale oil producers…

For all intents and purposes, OPEC is now engaged in a “price war” with the United States. What that means is that it’s very cheap to pump oil out of places like Saudi Arabia and Kuwait. But it’s more expensive to extract oil from shale formations in places like Texas and North Dakota. So as the price of oil keeps falling, some US producers may become unprofitable and go out of business. The result? Oil prices will stabilize and OPEC maintains its market share.

If the price of oil stays at this level or continues falling, we will see a significant number of U.S. shale oil companies go out of business and large numbers of jobs will be lost.  The Saudis know how to play hardball, and they are absolutely ruthless.  In fact, we have seen this kind of scenario happen before

Robert McNally, a White House adviser to former President George W. Bush and president of the Rapidan Group energy consultancy, told Reuters that Saudi Arabia “will accept a price decline necessary to sweat whatever supply cuts are needed to balance the market out of the US shale oil sector.” Even legendary oil man T. Boone Pickens believes Saudi Arabia is in a stand-off with US drillers and frackers to “see how the shale boys are going to stand up to a cheaper price.” This has happened once before. By the mid-1980’s, as oil output from Alaska’s North Slope and the North Sea came on line (combined production of around 5-6 million barrels a day), OPEC set off a price war to compete for market share. As a result, the price of oil sank from around $40 to just under $10 a barrel by 1986.

But the energy sector has been one of the only bright spots for the U.S. economy in recent years.  If this sector starts collapsing, it is going to have a dramatic negative impact on our economic outlook.  For example, just consider the following numbers from a recent Business Insider article

Specifically, if prices get too low, then energy companies won’t be able to cover the cost of production in the US. This spending by energy companies, also known as capital expenditures, is responsible for a lot of jobs.

“The Energy sector accounts for roughly one-third of S&P 500 capex and nearly 25% of combined capex and R&D spending,” Goldman Sachs’ Amanda Sneider writes.

Even more troubling is what this could mean for the financial markets.

As I mentioned above, energy companies now account for close to 20 percent of the entire junk bond market.  As those companies start to fail and those bonds start to go bad, that is going to hit our major banks really hard

Everyone could suffer if the collapse triggers a wave of defaults through the high-yield debt market, and in turn, hits stocks. The first to fall: the banks that were last hit by the housing crisis.

Why could that happen?

Well, energy companies make up anywhere from 15 to 20 percent of all U.S. junk debt, according to various sources.

It would be hard to overstate the seriousness of what the markets could potentially be facing.

One analyst summed it up to CNBC this way

This is the one thing I’ve seen over and over again,” said Larry McDonald, head of U.S strategy at Newedge USA’s macro group. “When high yield underperforms equity, a major credit event occurs. It’s the canary in the coal mine.

The last time junk bonds collapsed, a major stock market crash followed fairly rapidly.

And those that were hardest hit were the big Wall Street banks

During the last high-yield collapse, which centered around debt tied to the housing sector, Citigroup lost 63 percent of its value in the following 60 days, Kensho shows. Bank of America was cut in half.

I understand that some of this information is too technical for a lot of people, but the bottom line is this…

Watch junk bonds.  When they start crashing it is a sign that a major stock market collapse is right at the door.

At this point, even the mainstream media is warning about this.  Just consider the following excerpt from a recent CNN article

That swing away from junk bonds often happens shortly before stock market downturns.

“High yield does provide useful sell signals to equity investors,” Barclays analysts concluded in a recent report.

Barclays combed through the past dozen years of data. The warning signal they found is a 30% or greater increase in the spread between Treasuries and junk bonds before a dip.

If you have been waiting for the next major financial collapse, what you have just read in this article indicates that it is now closer than it has ever been.

Over the coming weeks, keep your eye on the price of oil, keep your eye on the junk bond market and keep your eye on the big banks.

Trouble is brewing, and nobody is quite sure exactly what comes next.