The Psychological Bubble That Has Been Propping Up The U.S. Economy Is Starting To Implode

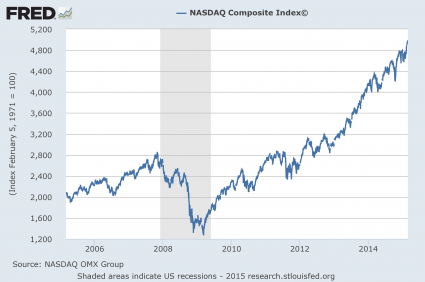
Optimism can be a very powerful thing.  For a long time Americans believed that things would get better, and that caused them to take action to make things better, and that actually resulted in things moving in a positive direction.  But now things have abruptly shifted.  In late 2018, an increasing number of Americans believe that an economic downturn is coming, and they are taking actions consistent with that belief.  As a result, they are actually helping to produce the result that they fear.  And without a doubt, any rational person should be able to see that signs that the U.S. economy is slowing down are all around us.  So it isn’t as if those that are preparing for the worst are being irrational.  It is just that when large numbers of people all start to move in the same direction, it has a very powerful effect.  We witnessed this in the stock market in recent years when people just kept buying stocks even though they were massively overvalued.  The collective belief that there was money to be made in the stock market became a self-fulfilling prophecy which pushed stock prices up to absurd heights.  But now that process is beginning to reverse as well, and ultimately the unwinding of that bubble will be quite painful.

Over the past couple of years the dominant economic narrative that the mainstream media was pushing was that the U.S. economy was “booming”, and this encouraged businesses to expand and consumers to go out and spend money.

But now the dominant economic narrative has changed, and businesses are starting to take actions that are consistent with the new narrative.  In the retail industry, if executives truly believed we would see an economic boom in the years ahead they would be expanding, but instead stores are being closed at a record pace

Mall and shopping center owners across the U.S. are preparing to be hit by more store closures, following a brutal year that included department store chains like Bon-Ton and Sears going bankrupt, Toys R Us liquidating and even Walmart shutting dozens of its club stores.

Now, a slew of specialty retailers like Gap and L Brands are getting serious about downsizing, which will leave more vacant storefronts within malls until landlords are able to replace tenants.

As a result of these store closings, large numbers of workers will be without jobs, vendors will not be receiving orders and mall owners will be without tenants.

In other words, economic activity will slow down.

Another sector where there has been a major psychological shift is in the real estate industry.  Home prices have been falling all over the nation, and this includes markets that were once extremely hot such as San Francisco

In San Francisco, the number of homes with a price cut in October nearly doubled, to 238 from 124 last October, according to data from Realtor.com.

That’s nothing compared to Santa Clara County, where the number of price cuts rose to 818 last month, more than six times last year’s number. Santa Clara County had been one of the nation’s hottest markets this year, and the Bay Area’s price appreciation leader until September.

“Clearly, there is a market shift,” said Rich Bennett, a Zephyr agent in San Francisco.

If homeowners believed that this dip was just temporary and that home prices would start surging again next year as the U.S. economy thrives, it would be quite foolish of them to slash their prices like this.

In some cases, home prices are being reduced by hundreds of thousands of dollars.  Why throw all of that money away if the market is going to bounce back shortly?

Over in the auto industry, there has also been a noticeable psychological shift.

If the U.S. economy was going to be doing extremely well in the years ahead, the major automakers should all be gearing up for record sales.

But instead, General Motors just shut a bunch of factories and laid off 14,000 workers, and Morgan Stanley analyst Adam Jonas is projecting that Ford will soon be laying off large numbers of employees

“We estimate a large portion of Ford’s restructuring actions will be focused on Ford Europe, a business we currently value at negative $7 billion,” Jonas wrote. “But we also expect a significant restructuring effort in North America, involving significant numbers of both salaried and hourly UAW and CAW workers.”

Ford’s 70,000 salaried employees have been told they face unspecified job losses by the middle of next year as the automaker works through an “organizational redesign” aimed at creating a white-collar workforce “designed for speed,” according to Karen Hampton, a spokeswoman.

“These actions will come largely outside of North America,” Hampton said of Ford’s restructuring. “All of this work is ongoing and publishing a job-reduction figure at this point would be pure speculation.”

Shifting gears, let’s talk about agriculture.

If farmers believed that the trade war was just temporary and that things would soon swing back in their favor, many of them would keep trying to hold on for as long as they possibly could.

But instead, farm bankruptcies are absolutely surging

A total of 84 farms in the upper Midwest filed for bankruptcy between July 2017 and June 2018, according to the Minneapolis Star Tribune. That’s more than double the number of Chapter 12 filings during the same period in 2013 and 2014 in Wisconsin, Minnesota, North Dakota, South Dakota, and Montana, reported Vox.

Farms that produce corn, soybeans, milk, and beef were all suffering due to low global demand and low prices before the trade war, according to economists, but president Trump’s trade war is making the problem even worse by exacerbating the weaknesses in the American economy. China has retaliated against the tariffs by slapping billions of dollars worth of tariffs on United States agriculture exports in response to Trump’s tariffs on Chinese products. Other countries, including Canada, have also added duties to US agriculture products in response to Trump’s tariffs on all imported steel and aluminum.

Most Americans want to have hope, but when they look at our economic situation all they see is a very bleak future.

And in some parts of the nation, there still hasn’t been any sort of a “recovery” from the last recession.  For example, a recent Bloomberg article took a hard look at what conditions are currently like in eastern Kentucky…

Tiffany Hensley’s drive home takes her through some picturesque scenery, and an ugly economy.

“The first thing you see when you get down here is beauty,” says Hensley, midway through her shift at a diner in the rolling hills of eastern Kentucky. “But then you get to looking around. It’s real rough.’’

Of course eastern Kentucky is far from alone.  Yes, coastal cities such as San Francisco and New York have prospered in recent years, but rural communities all across America have been deeply suffering.

And now economic conditions are deteriorating once again nationally, and things are about to get a whole lot tougher for everyone.

About the author: Michael Snyder is a nationally syndicated writer, media personality and political activist. He is publisher of The Most Important News and the author of four books including The Beginning Of The End and Living A Life That Really Matters.

Is The Stock Market Overvalued?

Stock Market Overvalued - Public DomainAre stocks overvalued?  By just about any measure that you could possibly name, stocks are at historically high prices right now.  From a technical standpoint, the stock market is more overvalued today than it was just prior to the last financial crisis.  The only two moments in U.S. history that even compare to our current state of affairs are the run up to the stock market crash of 1929 and the peak of the hysteria just before the dotcom bubble burst.  It is so obvious that stocks are in a bubble that even Janet Yellen has talked about it, but of course she will never admit that the Federal Reserve has played a key role in creating this bubble.  They say that hindsight is 20/20, but what is happening right in front of our eyes in 2015 is so obvious that everyone should be able to see it.  Just like with all other financial bubbles throughout our history, someday people will look back and talk about how stupid we all were.

Why can’t we ever learn from history?  We just keep on making the same mistakes over and over again.  And without a doubt, some of the smartest members of our society are trying to warn us about what is coming.  For example, Yale economics professor Robert Shiller has repeatedly tried to warn us that stocks are overvalued

I think that compared with history, US stocks are overvalued. One way to assess this is by looking at the CAPE (cyclically adjusted P/E) ratio that I created with John Campbell, now at Harvard, 25 years ago. The ratio is defined as the real stock price (using the S&P Composite Stock Price Index deflated by the CPI) divided by the ten-year average of real earnings per share. We have found this ratio to be a good predictor of subsequent stock market returns, especially over the long run. The CAPE ratio has recently been around 27, which is quite high by US historical standards. The only other times it has been that high or higher were in 1929, 2000, and 2007—all moments before market crashes.

But the CAPE ratio is not the only metric I watch. In my book Irrational Exuberance (3rd Ed., Princeton 2015) I discuss several metrics that help judge what’s going on in the market. These include my stock market confidence indices. One of the indicators in that series is based on a single question that I have asked individual and institutional investors over the years along the lines of, “Do you think the stock market is overvalued, undervalued, or about right?” Lately, what I call “valuation confidence” captured by this question has been on a downward trend, and for individual investors recently reached its lowest point since the stock market peak in 2000.

Other analysts prefer to use different valuation indicators than Shiller does.  But no matter which indicators you use, they all show that stocks are tremendously overvalued in mid-2015.  For instance, just consider the following chart.  It comes from Doug Short, and it shows the average of four of his favorite valuation indicators.  As you can see, there is only one other time in all of our history when stocks have been more overvalued than they are today according to the average of these four indicators…

Four Valuation Indicators - Doug Short

Another danger sign that many analysts are pointing to is the dramatic rise in margin debt that we have seen in recent years.  Investors are borrowing tremendous amounts of money to fund purchases of stock.  This is something that we witnessed during the dotcom bubble, it was something that we witnessed just prior to the financial collapse of 2008, and now it is happening again.  In fact, margin debt just surged to a brand new all-time record high.  Once again, the following chart comes from Doug Short

NYSE Margin Debt - Chart by Doug Short

All of this margin debt has helped drive stocks to ridiculous highs, but it can also serve to drive stock prices down very rapidly when the market turns.  This was noted by Henry Blodget of Business Insider in a recent editorial…

What is “margin debt”?

It’s the amount of money stock investors have collectively borrowed via traditional margin accounts to fund stock purchases.

In a bull market, the growth of margin debt serves as a turbocharger that helps drive stock prices higher.

As with a home mortgage, the more investors borrow, the more house or stock they can buy. So as margin debt grows, collective buying power grows. The borrowed money gets used to fund new stock purchases, which helps drives the prices of those stocks higher. The higher prices, in turn, allow traders to borrow more money to fund additional purchases. And so on.

It’s a self-reinforcing cycle.

The trouble is that it’s a self-reinforcing cycle on the way down, too.

If the overall U.S. economy was absolutely booming, these ultra-high stock prices would not be as much of a concern.  But the truth is that the financial markets have become completely divorced from economic reality.  Right now, corporate profits are actually falling and our exports are way down.  U.S. GDP shrunk during the first quarter, and there are a whole host of economic trouble signs on the horizon.  I am calling this a “recession within a recession“, and I believe that we are heading into another major economic downturn.

Unfortunately, our “leaders” are absolutely clueless about what is coming.  They assure us that everything is going to be just fine – just like they did back in 2008 before everything fell apart.  But the truth is that things are already so bad that even the big banks are sounding the alarm.  For instance, just consider the following words from Deutsche Bank

At issue is whether or not the Fed in particular but the market in general has properly understood the nature of the economic problem. The more we dig into this, the more we are afraid that they do not. So aside from a data revision tsunami, we would suggest that the Fed has the outlook not just horribly wrong, but completely misunderstood.

Ultimately, most people believe what they want to believe.

Our politicians want to believe that the economy is going to get better, and so do the bureaucrats over at the Federal Reserve.  The mainstream media wants to put a happy face on things, and they want all of us to continue to have faith in the system.

Unfortunately for them, the system is failing.  I truly do hope that this bubble can last for a few more months, but I don’t see it going on for much longer than that.

The greatest financial crisis in U.S. history is fast approaching, and it is going to be extraordinarily painful.

When it arrives, it is not just going to destroy faith in the system.  In the end, it is going to destroy the system altogether.

Stock Market Bubble: Wall Street Is Ecstatic As The NASDAQ Closes Above 5000

Bubble In Hands - Public DomainAre we at the tail end of the stock market bubble to end all stock market bubbles?  Wall Street was full of glee Monday when the Nasdaq closed above 5000 for the first time since the peak of the dotcom bubble in March 2000.  And almost everyone in the financial world seems convinced that things are somehow “different” this time around.  Even though by almost every objective measure stocks are wildly overpriced right now, and even though there are a whole host of signs that economic trouble is on the horizon, the overwhelming consensus is that this bull market is just going to keep charging ahead.  But of course that is what they thought just before the last two stock market crashes in 2001 and 2008 as well.  No matter how many times history repeats, we never seem to learn from it.

Back in October 2002, the Nasdaq hit a post-dotcom bubble low of 1108.  From there, it went on an impressive run.  In late 2007, it briefly moved above 2800 before losing more than half of its value during the stock market crash of 2008.

So the fact that the Nasdaq has now closed above 5000 is a really big deal.  The following is how USA Today described what happened on Monday…

The Nasdaq Composite capped its long march back to 5000 Monday, eclipsing, then closing above the long-hallowed mark for the first time since March 2000.

The arduous climb came on the heels of a 10-day winning streak that ended last week, Nasdaq’s longest since July 2009. That helped fuel the technology-heavy market index to a 7% gain in February, the sixth-largest monthly climb since its 1971 launch.

The chart below shows how the Nasdaq has performed over the past decade.  As you can see, we are coming dangerously close to doubling the peak that was hit just before the last stock market collapse…

NASDAQ since 2005

By looking at that chart, you would be tempted to think that the overall U.S. economy must be doing great.

But of course that is not the case at all.

For example, just take a look at what has happened to the employment-population ratio over the past decade.  The percentage of the working age U.S. population that is currently employed is actually far lower than it used to be…

Employment Population Ratio Since 2005

So why is the stock market doing so well if the overall economy is not?

Well, the truth is that stocks have become completely divorced from economic reality at this point.  Wall Street has been transformed into a giant casino, and trading stocks has been transformed into a high stakes poker game.

And one of the ways that we can tell that a stock market bubble has formed is when people start borrowing massive amounts of money to invest in stocks.  As you can see from the commentary and chart from Doug Short below, margin debt is peaking again just like it did just prior to the last two stock market crashes…

Unfortunately, the NYSE margin debt data is a month old when it is published. Real (inflation-adjusted) debt hit its all-time high in February 2014, after which it margin declined sharply for two months, but by June it had risen to a level about two percent below its high and then oscillated in a relatively narrow range. The latest data point for January is four percent off its real high eleven month ago.

Margin Debt - Doug Short

So why can’t more people see this?

We are in the midst of a monumental stock market bubble and most on Wall Street seem willingly blind to it.

Fortunately, there are a few sober voices in the crowd.  One of them is John Hussman.  He is warning that now is the time to get out of stocks

Unless we observe a rather swift improvement in market internals and a further, material easing in credit spreads – neither which would relieve the present overvaluation of the market, but both which would defer our immediate concerns about downside risk – the present moment likely represents the best opportunity to reduce exposure to stock market risk that investors are likely to encounter in the coming 8 years.

Last week, the cyclically-adjusted P/E of the S&P 500 Index surpassed 27, versus a historical norm of just 15 prior to the late-1990’s market bubble. The S&P 500 price/revenue ratio surpassed 1.8, versus a pre-bubble norm of just 0.8. On a wide range of historically reliable measures (having a nearly 90% correlation with actual subsequent S&P 500 total returns), we estimate current valuations to be fully 118% above levels associated with historically normal subsequent returns in stocks. Advisory bullishness (Investors Intelligence) shot to 59.5%, compared with only 14.1% bears – one of the most lopsided sentiment extremes on record. The S&P 500 registered a record high after an advancing half-cycle since 2009 that is historically long-in-the-tooth and already exceeds the valuation peaks set at every cyclical extreme in history but 2000 on the S&P 500 (across all stocks, current median price/earnings, price/revenue and enterprise value/EBITDA multiples already exceed the 2000 extreme). Equally important, our measures of market internals and credit spreads, despite moderate improvement in recent weeks, continue to suggest a shift toward risk-aversion among investors. An environment of compressed risk premiums coupled with increasing risk-aversion is without question the most hostile set of features one can identify in the historical record.

Everyone knows that the stock market cannot stay detached from economic reality forever.

At some point the bubble is going to burst.

If you want to know what the real economy is like, just ask Alison Norris of Detroit, Michigan

When Alison Norris couldn’t find work in Detroit, she searched past city limits, ending up with a part-time restaurant job 20 miles away, which takes at least two hours to get to using public transportation.

Norris has to take two buses to her job at a suburban mall in Troy, Michigan, using separate city and suburban bus systems.

For many city residents with limited skills and education, Detroit is an employment desert, having lost tens of thousands of blue-collar jobs in manufacturing cutbacks and service jobs as the population dwindled.

Sadly, her story is not an anomaly.  I get emails from readers all the time that are out of work and just can’t seem to find a decent job no matter how hard they try.

It would be one thing if the stock market was soaring because the U.S. economy was thriving.

But we all know that is not true.

So that means the current stock market mania that we are witnessing is artificial.

How long will it last?

Give us your opinion by posting a comment below…

Why Is Goldman Sachs Warning That The Stock Market Could Decline By 10 Percent Or More?

Time Is Running OutWhy has Goldman Sachs chosen this moment to publicly declare that stocks are overpriced?  Why has Goldman Sachs suddenly decided to warn all of us that the stock market could decline by 10 percent or more in the coming months?  Goldman Sachs has to know that when they release a report like this that it will move the market.  And that is precisely what happened on Monday.  U.S. stocks dropped precipitously.  So is Goldman Sachs just honestly trying to warn their clients that stocks may have become overvalued at this point, or is another agenda at work here?  To be fair, the truth is that all of the big banks should be warning their clients about the stock market bubble.  Personally, I have stated that the stock market has officially entered “crazytown territory“.  So it would be hard to blame Goldman Sachs for trying to tell the truth.  But Goldman Sachs also had to know that a warning that the stock market could potentially fall by more than 10 percent would rattle nerves on Wall Street.

This report that has just been released by Goldman Sachs has gotten a lot of attention.  In fact, an article about this report was featured at the top of the CNBC website for quite a while on Monday.  Needless to say, news of this report spread on Wall Street like wildfire.  The following is a short excerpt from the CNBC article

A stock market correction is approaching the level of near certainty as Wall Street faces a major paradigm shift in how to achieve price gains, according to a Goldman Sachs analysis.

In a market outlook that garnered significant attention from traders Monday, the firm’s strategists called the S&P 500 valuation “lofty by almost any measure” and attached a 67 percent probability to the chance that the market would fall by 10 percent or more, which is the technical yardstick for a correction.

Of course Goldman Sachs is quite correct to be warning about an imminent stock market correction.  Right now stocks are overvalued according to just about any measure that you could imagine

The current valuation of the S&P 500 is lofty by almost any measure, both for the aggregate market as well as the median stock: (1) The P/E ratio; (2) the current P/E expansion cycle; (3) EV/Sales; (4) EV/EBITDA; (5) Free Cash Flow yield; (6) Price/Book as well as the ROE and P/B relationship; and compared with the levels of (6) inflation; (7) nominal 10-year Treasury yields; and (8) real interest rates. Furthermore, the cyclically-adjusted P/E ratio suggests the S&P 500 is currently 30% overvalued in terms of (9) Operating EPS and (10) about 45% overvalued using As Reported earnings.

There is a lot of technical jargon in the paragraph above, but essentially what it is saying is that stock prices are unusually high right now according to a whole host of key indicators.

And in case you were wondering, stocks did fall dramatically on Monday.  The Dow fell by 179 points, which was the biggest decline of the year by far.

So is Goldman Sachs correct about what could be coming?

Well, the truth is that there are many other analysts that are far more pessimistic than Goldman Sachs is.  For example, David Stockman, the Director of the Office of Management and Budget under President Reagan, believes that the U.S. stock market is heading for “a pretty rude day of awakening”

“This (2014) is the year of the end game. The party is over. We are now just at the point where they are rounding up the Wall Street drunks who are swilling on the fifth consecutive seasonally maladjusted phony recovery. That will become evident in the weeks and months ahead. Then I think the markets are going to have a pretty rude day of awakening.”

For many more forecasts that are similar to this, please see my previous article entitled “Dent, Faber, Celente, Maloney, Rogers – What Do They Say Is Coming In 2014?

There are also some other signs that we are rapidly heading toward a major “turning point” in the financial world in 2014.  One of those signs is the continual decline of Comex gold inventories.  Someone out there (China?) is voraciously gobbling up physical gold.  The following is a short excerpt from a recent article by Steve St. Angelo

After a brief pause in the decline of Comex Gold inventories, it looks like it has continued once again as there were several big withdrawals over the past few days. Not only was there a large removal of gold from the Comex today, the Registered (Dealer) inventories are now at a new record low.

And of course the overall economy continues to get even weaker.  The Baltic Dry Index (a very important indicator of global economic activity) has fallen by more than 40 percent over the past couple of weeks

We noted Friday that the much-heralded Baltic Dry Index has seen the worst start to the year in over 30 years. Today it got worse. At 1,395, the the Baltic Dry index, which reflects the daily charter rate for vessels carrying cargoes such as iron ore, coal and grain, is now down 18% in the last 2 days alone (biggest drop in 6 years), back at 4-month lows. The shipping index has utterly collapsed over 40% in the last 2 weeks.

So does this mean that tough times are just around the corner?

Maybe.

Or perhaps things will stabilize again and this little bubble of false prosperity that we have been enjoying will be extended for a little while longer.

The important thing is to not get too caught up in the short-term numbers.

If you look at our long-term national “balance sheet numbers” and the long-term trends that are systematically destroying our economy, it becomes abundantly clear that a massive economic collapse is on the way.  Our national debt is on pace to more than double during the Obama years, our “too big to fail” banks are now much bigger and much more reckless than they were before the financial crash of 2008, and the middle class in America is steadily shrinking.  In other words, our long-term national “balance sheet numbers” are worse than ever.

We consume far more wealth than we produce, and our entire nation is drowning in a massive ocean of red ink that stretches from sea to shining sea.

This is not sustainable, and it is inevitable that the stock market will catch up with economic reality at some point.

It is just a matter of time.