
 Are we at the tail end of the stock market bubble to end all stock market bubbles? Wall Street was full of glee Monday when the Nasdaq closed above 5000 for the first time since the peak of the dotcom bubble in March 2000. And almost everyone in the financial world seems convinced that things are somehow “different” this time around. Even though by almost every objective measure stocks are wildly overpriced right now, and even though there are a whole host of signs that economic trouble is on the horizon, the overwhelming consensus is that this bull market is just going to keep charging ahead. But of course that is what they thought just before the last two stock market crashes in 2001 and 2008 as well. No matter how many times history repeats, we never seem to learn from it.
Back in October 2002, the Nasdaq hit a post-dotcom bubble low of 1108. From there, it went on an impressive run. In late 2007, it briefly moved above 2800 before losing more than half of its value during the stock market crash of 2008.
So the fact that the Nasdaq has now closed above 5000 is a really big deal. The following is how USA Today described what happened on Monday…
The Nasdaq Composite capped its long march back to 5000 Monday, eclipsing, then closing above the long-hallowed mark for the first time since March 2000.
The arduous climb came on the heels of a 10-day winning streak that ended last week, Nasdaq’s longest since July 2009. That helped fuel the technology-heavy market index to a 7% gain in February, the sixth-largest monthly climb since its 1971 launch.
The chart below shows how the Nasdaq has performed over the past decade. As you can see, we are coming dangerously close to doubling the peak that was hit just before the last stock market collapse…
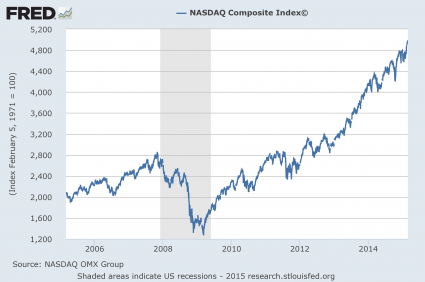
By looking at that chart, you would be tempted to think that the overall U.S. economy must be doing great.
But of course that is not the case at all.
For example, just take a look at what has happened to the employment-population ratio over the past decade. The percentage of the working age U.S. population that is currently employed is actually far lower than it used to be…
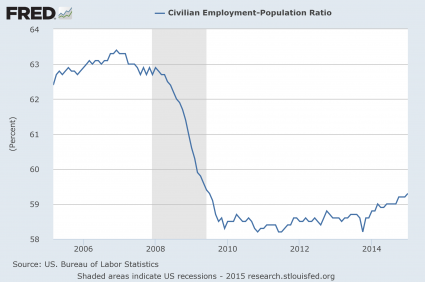
So why is the stock market doing so well if the overall economy is not?
Well, the truth is that stocks have become completely divorced from economic reality at this point. Wall Street has been transformed into a giant casino, and trading stocks has been transformed into a high stakes poker game.
And one of the ways that we can tell that a stock market bubble has formed is when people start borrowing massive amounts of money to invest in stocks. As you can see from the commentary and chart from Doug Short below, margin debt is peaking again just like it did just prior to the last two stock market crashes…
Unfortunately, the NYSE margin debt data is a month old when it is published. Real (inflation-adjusted) debt hit its all-time high in February 2014, after which it margin declined sharply for two months, but by June it had risen to a level about two percent below its high and then oscillated in a relatively narrow range. The latest data point for January is four percent off its real high eleven month ago.
So why can’t more people see this?
We are in the midst of a monumental stock market bubble and most on Wall Street seem willingly blind to it.
Fortunately, there are a few sober voices in the crowd. One of them is John Hussman. He is warning that now is the time to get out of stocks…
Unless we observe a rather swift improvement in market internals and a further, material easing in credit spreads – neither which would relieve the present overvaluation of the market, but both which would defer our immediate concerns about downside risk – the present moment likely represents the best opportunity to reduce exposure to stock market risk that investors are likely to encounter in the coming 8 years.
Last week, the cyclically-adjusted P/E of the S&P 500 Index surpassed 27, versus a historical norm of just 15 prior to the late-1990’s market bubble. The S&P 500 price/revenue ratio surpassed 1.8, versus a pre-bubble norm of just 0.8. On a wide range of historically reliable measures (having a nearly 90% correlation with actual subsequent S&P 500 total returns), we estimate current valuations to be fully 118% above levels associated with historically normal subsequent returns in stocks. Advisory bullishness (Investors Intelligence) shot to 59.5%, compared with only 14.1% bears – one of the most lopsided sentiment extremes on record. The S&P 500 registered a record high after an advancing half-cycle since 2009 that is historically long-in-the-tooth and already exceeds the valuation peaks set at every cyclical extreme in history but 2000 on the S&P 500 (across all stocks, current median price/earnings, price/revenue and enterprise value/EBITDA multiples already exceed the 2000 extreme). Equally important, our measures of market internals and credit spreads, despite moderate improvement in recent weeks, continue to suggest a shift toward risk-aversion among investors. An environment of compressed risk premiums coupled with increasing risk-aversion is without question the most hostile set of features one can identify in the historical record.
Everyone knows that the stock market cannot stay detached from economic reality forever.
At some point the bubble is going to burst.
If you want to know what the real economy is like, just ask Alison Norris of Detroit, Michigan…
When Alison Norris couldn’t find work in Detroit, she searched past city limits, ending up with a part-time restaurant job 20 miles away, which takes at least two hours to get to using public transportation.
Norris has to take two buses to her job at a suburban mall in Troy, Michigan, using separate city and suburban bus systems.
For many city residents with limited skills and education, Detroit is an employment desert, having lost tens of thousands of blue-collar jobs in manufacturing cutbacks and service jobs as the population dwindled.
Sadly, her story is not an anomaly. I get emails from readers all the time that are out of work and just can’t seem to find a decent job no matter how hard they try.
It would be one thing if the stock market was soaring because the U.S. economy was thriving.
But we all know that is not true.
So that means the current stock market mania that we are witnessing is artificial.
How long will it last?
Give us your opinion by posting a comment below…