17 Facts To Show To Anyone That Believes That The U.S. Economy Is Just Fine

17
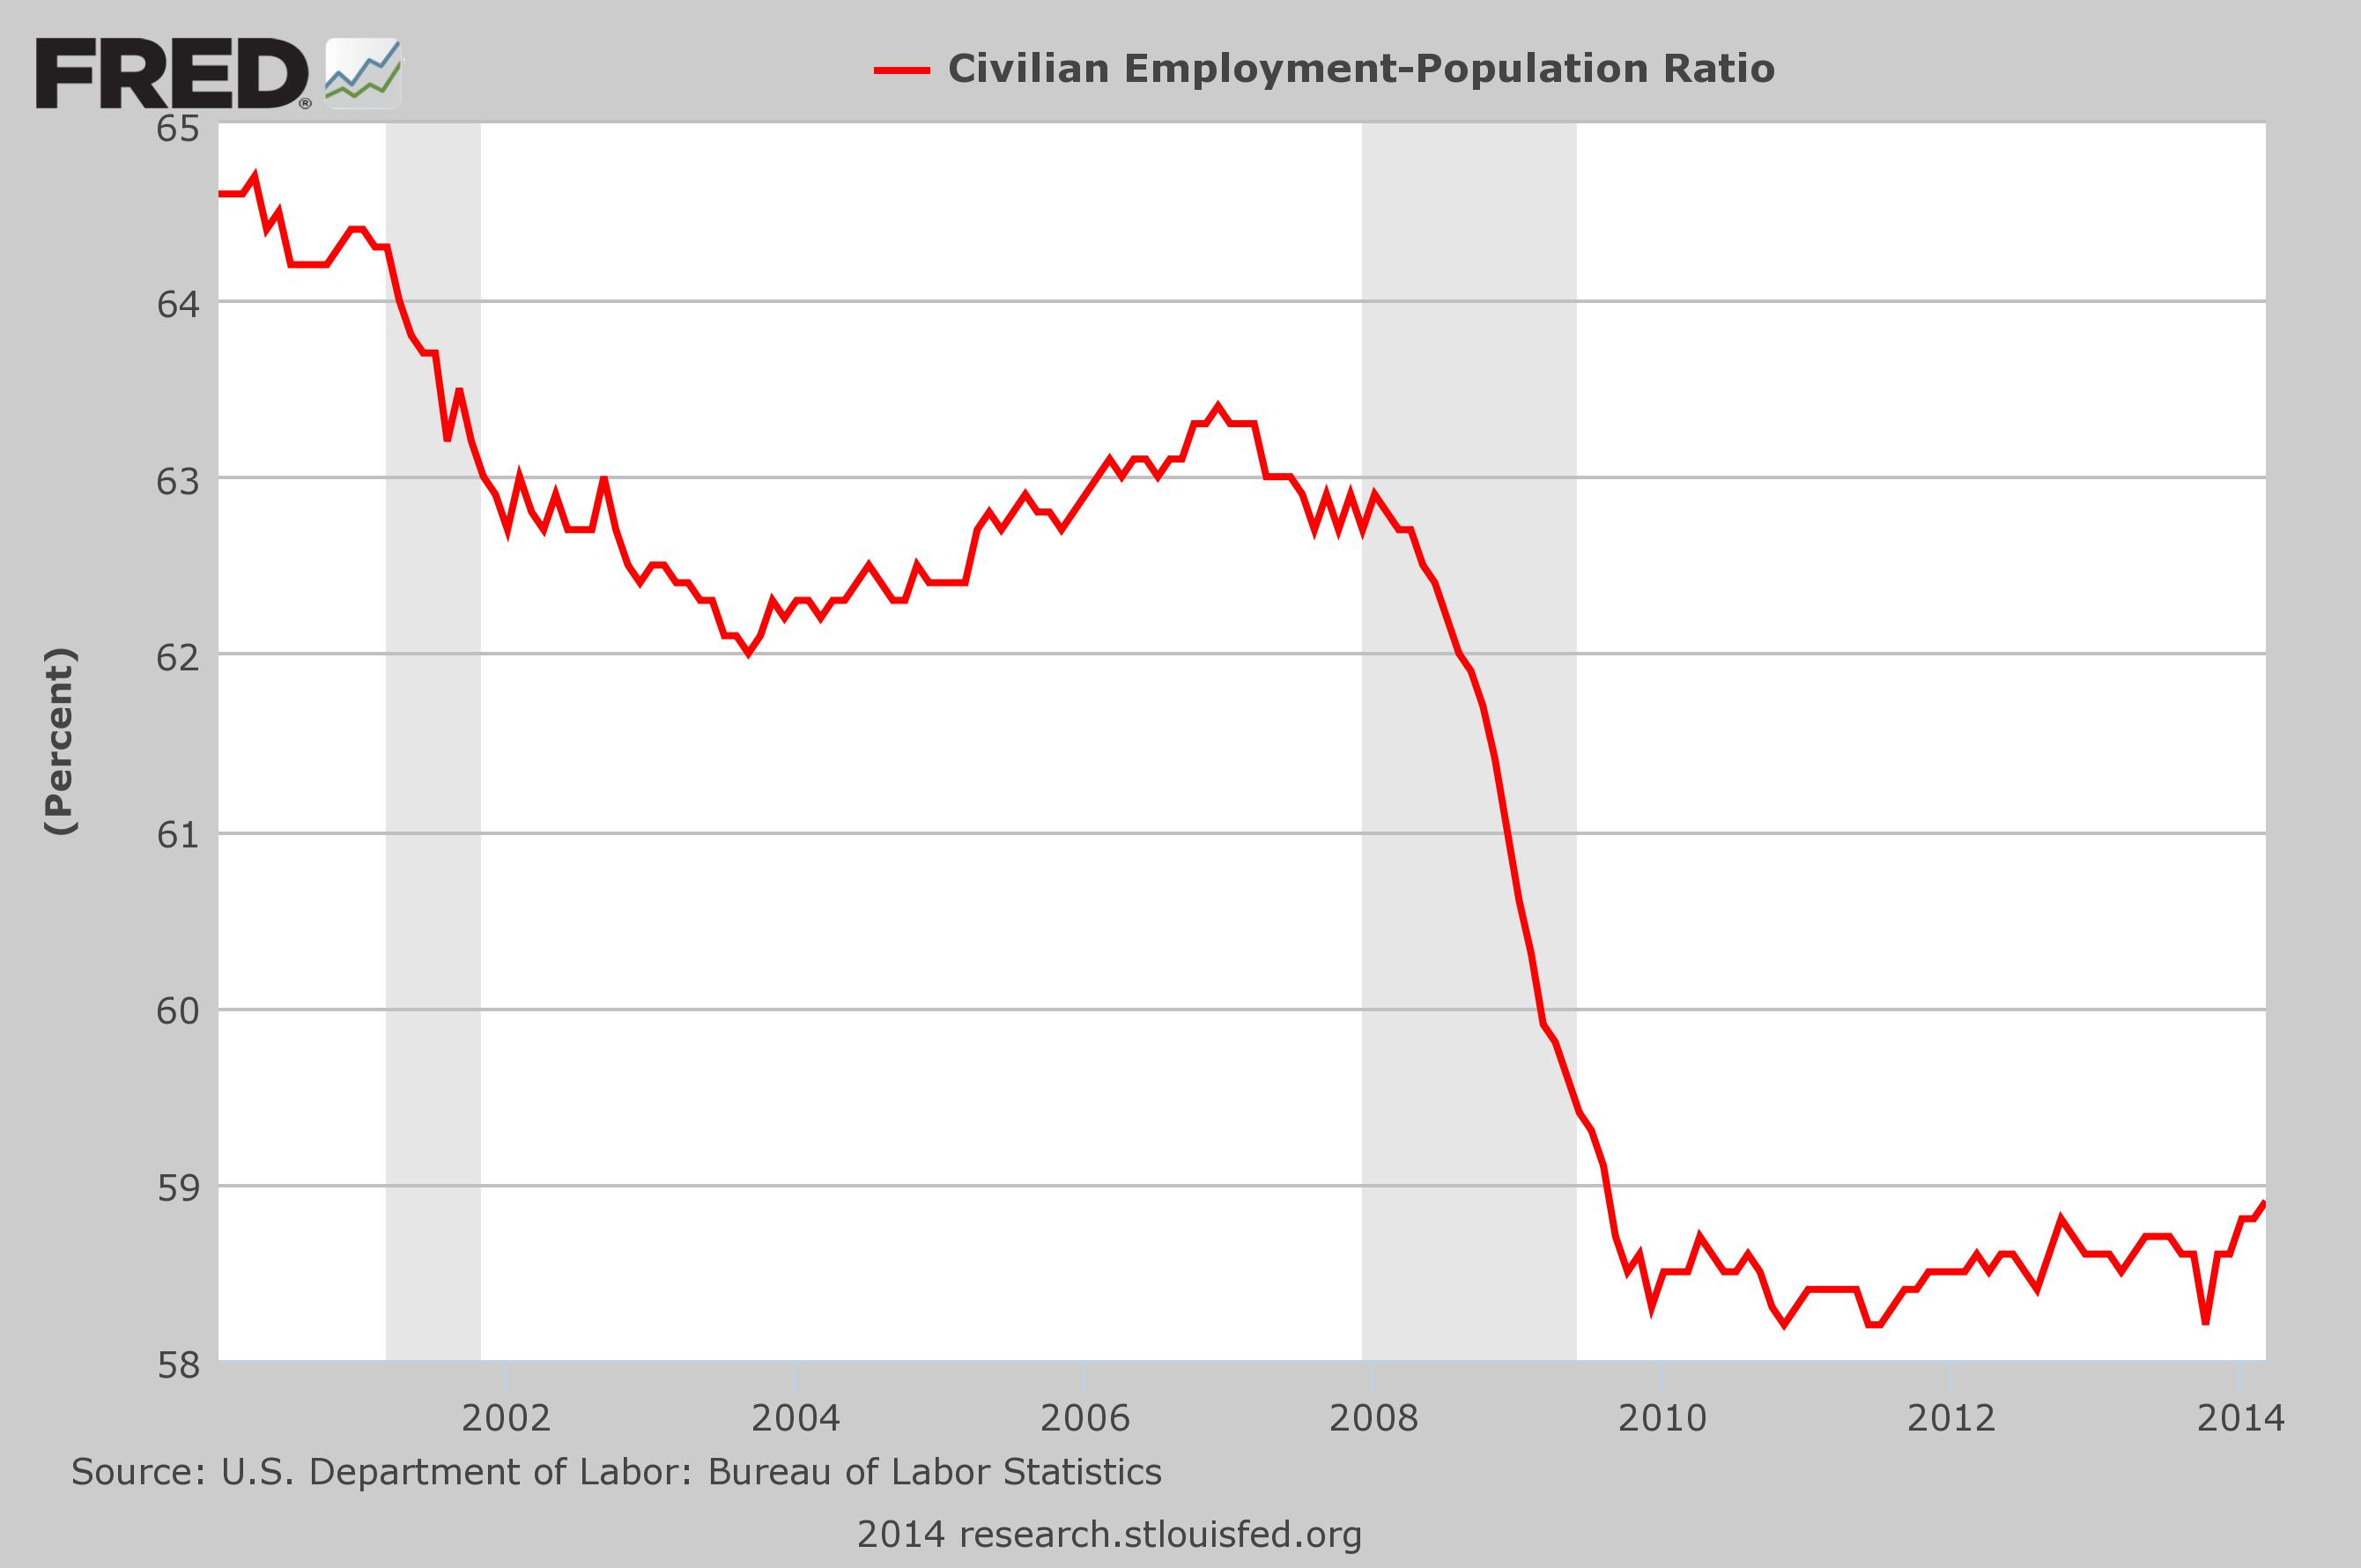
No, the economy is most definitely not “recovering”.  Despite what you may hear from the politicians and from the mainstream media, the truth is that the U.S. economy is in far worse shape than it was prior to the last recession.  In fact, we are still pretty much where we were at when the last recession finally ended.  When the financial crisis of 2008 struck, it took us down to a much lower level economically.  Thankfully, things have at least stabilized at this much lower level.  For example, the percentage of working age Americans that are employed has stayed remarkably flat for the past four years.  We should be grateful that things have not continued to get even worse.  It is almost as if someone has hit the “pause button” on the U.S. economy.  But things are definitely not getting better, and there are a whole host of signs that this bubble of false stability will soon come to an end and that our economic decline will accelerate once again.  The following are 17 facts to show to anyone that believes that the U.S. economy is just fine…

#1 The homeownership rate in the United States has dropped to the lowest level in 19 years.

#2 Consumer spending for durable goods has dropped by 3.23 percent since November.  This is a clear sign that an economic slowdown is ahead.

#3 Major retailers are closing stores at the fastest pace that we have seen since the collapse of Lehman Brothers.

#4 According to the Bureau of Labor Statistics, 20 percent of all families in the United States do not have a single member that is employed.  That means that one out of every five families in the entire country is completely unemployed.

#5 There are 1.3 million fewer jobs in the U.S. economy than when the last recession began in December 2007.  Meanwhile, our population has continued to grow steadily since that time.

#6 According to a new report from the National Employment Law Project, the quality of the jobs that have been “created” since the end of the last recession does not match the quality of the jobs lost during the last recession…

  • Lower-wage industries constituted 22 percent of recession losses, but 44 percent of recovery growth.
  • Mid-wage industries constituted 37 percent of recession losses, but only 26 percent of recovery growth.
  • Higher-wage industries constituted 41 percent of recession losses, and 30 percent of recovery growth.

#7 After adjusting for inflation, men who work full-time in America today make less money than men who worked full-time in America 40 years ago.

#8 It is hard to believe, but 62 percent of all Americans make $20 or less an hour at this point.

#9 Nine of the top ten occupations in the U.S. pay an average wage of less than $35,000 a year.

#10 The middle class in Canada now makes more money than the middle class in the United States does.

#11 According to one recent study, 40 percent of all Americans could not come up with $2000 right now even if there was a major emergency.

#12 Less than one out of every four Americans has enough money put away to cover six months of expenses if there was a job loss or major emergency.

#13 An astounding 56 percent of all Americans have subprime credit in 2014.

#14 As I wrote about the other day, there are now 49 million Americans that are dealing with food insecurity.

#15 Ten years ago, the number of women in the U.S. that had jobs outnumbered the number of women in the U.S. on food stamps by more than a 2 to 1 margin.  But now the number of women in the U.S. on food stamps actually exceeds the number of women that have jobs.

#16 69 percent of the federal budget is spent either on entitlements or on welfare programs.

#17 The number of Americans receiving benefits from the federal government each month exceeds the number of full-time workers in the private sector by more than 60 million.

Taken individually, those numbers are quite remarkable.

Taken collectively, they are absolutely breathtaking.

Yes, things have been improving for the wealthy for the last several years.  The stock market has soared to new record highs and real estate prices in the Hamptons have skyrocketed to unprecedented heights.

But that is not the real economy.  In the real economy, the middle class is being squeezed out of existence.  The quality of our jobs is declining and prices just keep rising.  This reality was reflected quite well in a comment that one of my readers left on one of my recent articles

It is getting worse each passing month. The food bank I help out, has barely squeaked by the last 3 months. Donors are having to pull back, to take care of their own families. Wages down, prices up, simple math tells you we can not hold out much longer. Things are going up so fast, you have to adopt a new way of thinking. Example I just had to put new tires on my truck. Normally I would have tried to get by to next winter. But with the way prices are moving, I decide to get them while I could still afford them. It is the same way with food. I see nothing that will stop the upward trend for quite a while. So if you have a little money, and the space, buy it while you can afford it. And never forget, there will be some people worse off than you. Help them if you can.

And the false stock bubble that the wealthy are enjoying right now will not last that much longer.  It is an artificial bubble that has been pumped up by unprecedented money printing by the Federal Reserve, and like all bubbles that the Fed creates, it will eventually burst.

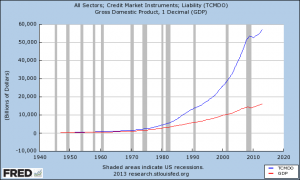
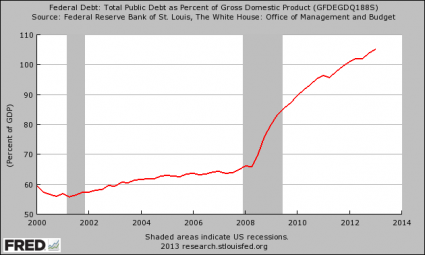
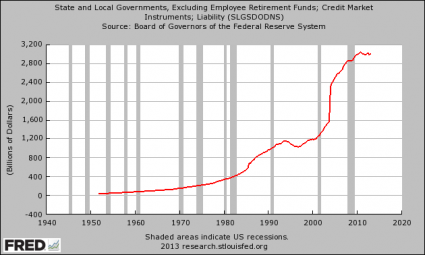
None of the long-term trends that are systematically destroying our economy have been addressed, and none of our major economic problems have been fixed.  In fact, as I showed in this recent article, we are actually in far worse shape than we were just prior to the last major financial crisis.

Let us hope that this current bubble of false stability lasts for as long as possible.

That is what I am hoping for.

But let us not be deceived into thinking that it is permanent.

It will soon burst, and then the real pain will begin.

Share This Chart With Anyone That Believes The U.S. Economy Is Not Going To Crash

Total Debt Growth vs. GDP GrowthAnyone that thinks that the U.S. economy can keep going along like this is absolutely crazy.  We are in the terminal phase of an unprecedented debt spiral which has allowed us to live far, far beyond our means for the last several decades.  Unfortunately, all debt spirals eventually end, and they usually do so in a very disorderly manner.  The chart that you are about to see is one of my favorite economic charts.  It compares the growth of U.S. GDP to the growth of total debt in the United States.  Yes, U.S. GDP has certainly grown at a decent pace over the years, but our total debt has absolutely exploded.  40 years ago, the total amount of debt in our system (government debt + corporate debt + consumer debt, etc.) was about 2 trillion dollars.  Today it has grown to more than 56 trillion dollars.  Our debt has grown at a much, much faster rate than our economy has, and there is no way in the world that we will be able to continue to do that for long.

Posted below is the chart that I was talking about.  The blue line is our total debt, and the red line is our GDP.  As you can see, this chart kind of speaks for itself…

Total Debt Growth vs. GDP Growth

So how did we get here?

Well, of course the federal government has been the biggest offender.  It would be a tremendous understatement to say that the politicians in Washington D.C. have been reckless.  Since the year 2000, the size of the U.S. national debt has grown by more than 11 trillion dollars.

Posted below is a chart that demonstrates the dramatic growth of the national debt as a percentage of GDP.  In particular, our debt has absolutely exploded as a percentage of GDP since the financial crisis of 2008…

National Debt As A Percentage Of GDP

Does that look sustainable to you?

Of course it isn’t.

Right now, the mainstream media is very excited that the federal budget deficit for this year might be less than a trillion dollars, but they are really missing the point.  The debt of the U.S. government is still growing much, much faster than the economy is, and the United States already has more government debt per capita than Greece, Portugal, Italy, Ireland or Spain.

What we are doing to future generations is absolutely criminal.  We are piling up mountains of debt that will haunt them for the rest of their lives just so that we can make the present a little bit more pleasant for ourselves.

As I noted in another article, during Obama’s first term the federal government accumulated more debt than it did under the first 42 U.S presidents combined.  And now we are entering a time period when demographic forces are going to put a tremendous amount of pressure on the finances of the federal government.

The Baby Boomers have started to retire, and they are going to want to start collecting on all of the financial promises that we have made to them.

As I have written about previously, the number of Americans on Medicare is projected to grow from a little bit more than 50 million today to 73.2 million in 2025.

The number of Americans collecting Social Security benefits is projected to grow from about 56 million today to 91 million in 2035.

Where are we going to get the money to pay for all of that?

Boston University economist Laurence Kotlikoff has calculated that the U.S. government is facing unfunded liabilities of 222 trillion dollars in the years ahead.

There is no simply no way that the U.S. government is going to be able to meet those obligations without wildly printing up money.

And of course the federal government is not the only one with massive debt problems.  We just saw the city of Detroit go bankrupt, and there are lots of other communities all over the nation that could soon follow.

Posted below is a chart that shows the growth of state and local government debt over the years.  In particular, please take note that the total amount of state and local government debt has grown from about 1.2 trillion dollars in the year 2000 to about 3 trillion dollars today…

State And Local Government Debt

But the chart posted above does not even take into account the massive unfunded pension obligations that state and local governments are facing.  According to the Detroit Free Press, state governments are facing unfunded pension obligations of nearly a trillion and a half dollars…

From Baltimore to Los Angeles, and many points in between, municipalities are increasingly confronted with how to pay for these massive promises. The Pew Center for the States, in Washington, estimated states’ public pension plans across the U.S. were underfunded by a whopping $1.4 trillion in 2010.

And many large cities are dealing with similar situations.  Detroit was the first to go down, but could Chicago or Los Angeles eventually be forced to declare bankruptcy too?…

Chicago recently saw its credit rating downgraded because of a $19-billion unfunded pension liability that the ratings service Moody’s puts closer to $36 billion. And Los Angeles could be facing a liability of more than $30 billion, by some estimates.

According to a report that was released earlier this year, the largest U.S. cities are facing hundreds of billions of dollars in unfunded pension liabilities at this point…

Early this year, the Pew Center released a survey showing that 61 of the nation’s largest cities — limiting the survey to the largest city in each state and all other cities with more than 500,000 people — had a gap of more than $217 billion in unfunded pension and health care liabilities. While cities had long promised health care, life insurance and other benefits to retirees, “few … started saving to cover the long-term costs,” the report said.

So where will all of that money come from?

That is a good question, and nobody has an easy answer at this point.

Meanwhile, U.S. consumers have been racking up staggering amounts of debt over the past several decades.  Just consider the following numbers…

-Total home mortgage debt in the United States is now about 5 times larger than it was just 20 years ago.

-Car loans just keep getting longer and longer, and approximately 70 percent of all car purchases in the United States now involve an auto loan.

-The total amount of student loan debt in America recently surpassed the one trillion dollar mark.

-One study discovered that approximately 41 percent of all working age Americans either have medical bill problems or are currently paying off medical debt, and according to a report published in The American Journal of Medicine medical bills are a major factor in more than 60 percent of the personal bankruptcies in the United States.

-Consumer debt in the United States has risen by a whopping 1700% since 1971, and 46% of all Americans carry a credit card balance from month to month.

Sadly, most people don’t realize how damaging credit card debt can be.  If you just carry an “average balance” on your credit cards each month, and those credit cards have just an “average” interest rate, you could end up paying millions of dollars to the credit card companies by the end of your life…

Let’s say you are an average American household, and you carry an average balance of $15,956 in credit card debt.

Also, as an average American household, let’s assume you pay an average current rate of 12.83%.

Finally, let’s assume you carry this average balance for 40 years, between ages 25 and 65.  How much did your credit card company make off of you and your extreme averageness?

Answer: $2,629,618.64

Incredibly, a large percentage of the population does not seem to understand these things.  An astounding 43 percent of all American families spend more than they earn each year.

Are you starting to understand why approximately half of all Americans die broke?

We are a nation that is completely and addicted to debt.

If you do not believe that it will ever catch up with us you are being delusional.

We have piled up the biggest mountain of debt in the history of the planet, and a day of reckoning is fast approaching.