 What a year 2012 has been! The mainstream media continues to tell us what a “great job” the Obama administration and the Federal Reserve are doing of managing the economy, but meanwhile things just continue to get even worse for the poor and the middle class. It is imperative that we educate the American people about the true condition of our economy and about why all of this is happening. If nothing is done, our debt problems will continue to get worse, millions of jobs will continue to leave the country, small businesses will continue to be suffocated, the middle class will continue to collapse, and poverty in the United States will continue to explode. Just “tweaking” things slightly is not going to fix our economy. We need a fundamental change in direction. Right now we are living in a bubble of debt-fueled false prosperity that allows us to continue to consume far more wealth than we produce, but when that bubble bursts we are going to experience the most painful economic “adjustment” that America has ever gone through. We need to be able to explain to our fellow Americans what is coming, why it is coming and what needs to be done. Hopefully the crazy economic numbers that I have included in this article will be shocking enough to wake some people up.
The end of the year is a time when people tend to gather with family and friends more than they do during the rest of the year. Hopefully many of you will use the list below as a tool to help start some conversations about the coming economic collapse with your loved ones. Sadly, most Americans still tend to doubt that we are heading into economic oblivion. So if you have someone among your family and friends that believes that everything is going to be “just fine”, just show them these numbers. They are a good summary of the problems that the U.S. economy is currently facing.
The following are 50 economic numbers from 2012 that are almost too crazy to believe…
#1 In December 2008, 31.6 million Americans were on food stamps. Today, a new all-time record of 47.7 million Americans are on food stamps. That number has increased by more than 50 percent over the past four years, and yet the mainstream media still has the gall to insist that “things are getting better”.
#2 Back in the 1970s, about one out of every 50 Americans was on food stamps. Today, about one out of every 6.5 Americans is on food stamps.
#3 According to one calculation, the number of Americans on food stamps now exceeds the combined populations of “Alaska, Arkansas, Connecticut, Delaware, District of Columbia, Hawaii, Idaho, Iowa, Kansas, Maine, Mississippi, Montana, Nebraska, Nevada, New Hampshire, New Mexico, North Dakota, Oklahoma, Oregon, Rhode Island, South Dakota, Utah, Vermont, West Virginia, and Wyoming.”
#4 According to one recent survey, 55 percent of all Americans have received money from a safety net program run by the federal government at some point in their lives.
#5 For the first time ever, more than a million public school students in the United States are homeless. That number has risen by 57 percent since the 2006-2007 school year.
#6 Median household income in the U.S. has fallen for four consecutive years. Overall, it has declined by over $4000 during that time span.
#7 Families that have a head of household under the age of 30 have a poverty rate of 37 percent.
#8 The percentage of working age Americans with a job has been under 59 percent for 39 months in a row.
#9 In September 2009, during the depths of the last economic crisis, 58.7 percent of all working age Americans were employed. In November 2012, 58.7 percent of all working age Americans were employed. It is more then 3 years later, and we are in the exact same place.
#10 When you total up all working age Americans that do not have a job in America today, it comes to more than 100 million.
#11 According to one recent survey, 55 percent of all small business owners in America “say they would not start a business today given what they know now and in the current environment.”
#12 The number of jobs at new small businesses continues to decline. According to economist Tim Kane, the following is how the decline in the number of startup jobs per 1000 Americans breaks down by presidential administration…
Bush Sr.: 11.3
Clinton: 11.2
Bush Jr.: 10.8
Obama: 7.8
#13 The U.S. share of global GDP has fallen from 31.8 percent in 2001 to 21.6 percent in 2011.
#14 The United States has fallen in the global economic competitiveness rankings compiled by the World Economic Forum for four years in a row.
#15 There are four major U.S. banks that each have more than 40 trillion dollars of exposure to derivatives.
#16 In 2000, there were more than 17 million Americans working in manufacturing, but now there are less than 12 million.
#17 According to the Pew Research Center, 61 percent of all Americans were “middle income” back in 1971. Today, only 51 percent of all Americans are.
#18 The Pew Research Center has also found that 85 percent of all middle class Americans say that it is harder to maintain a middle class standard of living today than it was 10 years ago.
#19 62 percent of all middle class Americans say that they have had to reduce household spending over the past year.
#20 Right now, approximately 48 percent of all Americans are either considered to be “low income” or are living in poverty.
#21 Approximately 57 percent of all children in the United States are living in homes that are either considered to be either “low income” or impoverished.
#22 According to one survey, 77 percent of all Americans are now living paycheck to paycheck at least part of the time.
#23 Back in 1950, more than 80 percent of all men in the United States had jobs. Today, less than 65 percent of all men in the United States have jobs.
#24 The average amount of time that an unemployed worker stays out of work in the United States is 40 weeks.
#25 If you can believe it, approximately one out of every four American workers makes 10 dollars an hour or less.
#26 According to the U.S. Census Bureau, an all-time record 49 percent of all Americans live in a home where at least one person receives financial assistance from the federal government. Back in 1983, that number was less than 30 percent.
#27 Right now, more than 100 million Americans are enrolled in at least one welfare program run by the federal government. And that does not even count Social Security or Medicare. Overall, there are almost 80 different “means-tested welfare programs” that the federal government is currently running.
#28 When you account for all government transfer payments and all forms of government employment, more than half of all Americans are now at least partially financially dependent on the government.
#29 Barack Obama has been president for less than four years, and during that time the number of Americans “not in the labor force” has increased by nearly 8.5 million. Something seems really “off” about that number, because during the entire decade of the 1980s the number of Americans “not in the labor force” only rose by about 2.5 million.
#30 Electricity bills in the United States have risen faster than the overall rate of inflation for five years in a row.
#31 According to USA Today, many Americans have actually seen their water bills triple over the past 12 years.
#32 There are now 20.2 million Americans that spend more than half of their incomes on housing. That represents a 46 percent increase from 2001.
#33 Right now, approximately 25 million American adults are living with their parents.
#34 As the economy has slowed down, so has the number of marriages. According to a Pew Research Center analysis, only 51 percent of all Americans that are at least 18 years old are currently married. Back in 1960, 72 percent of all U.S. adults were married.
#35 At this point, only 24.6 percent of all jobs in the United States are good jobs.
#36 In 1999, 64.1 percent of all Americans were covered by employment-based health insurance. Today, only 55.1 percent are covered by employment-based health insurance.
#37 Recently it was announced that total student loan debt in the United States has passed the one trillion dollar mark.
#38 If you can believe it, one out of every seven Americans has at least 10 credit cards.
#39 One survey of business executives has ranked California as the worst state in America to do business for 8 years in a row.
#40 In the city of Detroit today, more than 50 percent of all children are living in poverty, and close to 50 percent of all adults are functionally illiterate.
#41 It is being projected that half of all American children will be on food stamps at least once before they turn 18 years of age.
#42 More than three times as many new homes were sold in the United States in 2005 as will be sold in 2012.
#43 If you can believe it, 53 percent of all Americans with a bachelor’s degree under the age of 25 were either unemployed or underemployed last year.
#44 The U.S. economy continues to trade good paying jobs for low paying jobs. 60 percent of the jobs lost during the last recession were mid-wage jobs, but 58 percent of the jobs created since then have been low wage jobs.
#45 Our trade deficit with China in 2011 was $295.5 billion. That was the largest trade deficit that one country has had with another country in the history of the planet.
#46 The United States has lost an average of approximately 50,000 manufacturing jobs a month since China joined the World Trade Organization in 2001.
#47 According to the Economic Policy Institute, America is losing half a million jobs to China every single year.
#48 The U.S. tax code is now more than 3.8 million words long. If you took all of William Shakespeare’s works and collected them together, the entire collection would only be about 900,000 words long.
#49 According to the IMF, the global elite are holding a total of 18 trillion dollars in offshore banking havens such as the Cayman Islands.
#50 The value of the U.S. dollar has declined by more than 96 percent since the Federal Reserve was first created.
#51 2012 was the third year in a row that the yield for corn has declined in the United States.
#52 Experts are telling us that global food reserves have reached their lowest level in almost 40 years.
#53 One recent survey discovered that 40 percent of all Americans have $500 or less in savings.
#54 If you can believe it, one recent survey found that 28 percent of all Americans do not have a single penny saved for emergencies.
#55 Medical costs related to obesity in the United States are estimated to be approximately $147 billion a year.
#56 Corporate profits as a percentage of GDP are at an all-time high. Meanwhile, wages as a percentage of GDP are near an all-time low.
#57 Today, the wealthiest 1 percent of all Americans own more wealth than the bottom 95 percent combined.
#58 The wealthiest 400 families in the United States have about as much wealth as the bottom 50 percent of all Americans combined.
#59 The six heirs of Wal-Mart founder Sam Walton have a net worth that is roughly equal to the bottom 30 percent of all Americans combined.
#60 At this point, the poorest 50 percent of all Americans collectively own just 2.5% of all the wealth in the United States.
#61 Nearly 500,000 federal employees now make at least $100,000 a year.
#62 In 2006, only 12 percent of all federal workers made $100,000 or more per year. Now, approximately 22 percent of all federal workers do.
#63 If you can believe it, there are 77,000 federal workers that make more than the governors of their own states do.
#64 Nearly 15,000 retired federal workers are collecting federal pensions for life worth at least $100,000 annually. The list includes such names as Newt Gingrich, Bob Dole, Trent Lott, Dick Gephardt and Dick Cheney.
#65 U.S. taxpayers spend more than 20 times as much on the Obamas as British taxpayers spend on the royal family.
#66 Family homelessness in the Washington D.C. region (one of the wealthiest regions in the entire country) has risen 23 percent since the last recession began.
#67 If Bill Gates gave every single penny of his fortune to the U.S. government, it would only cover the U.S. budget deficit for about 15 days.
#68 During fiscal year 2012, 62 percent of the federal budget was spent on entitlements.
#69 Back in 1965, only one out of every 50 Americans was on Medicaid. Today, approximately one out of every 6 Americans is on Medicaid.
#70 It is being projected that Obamacare will add 16 million more Americans to the Medicaid rolls.
#71 Medicare is also growing by leaps and bounds. As I wrote about recently, it is being projected that the number of Americans on Medicare will grow from 50.7 million in 2012 to 73.2 million in 2025.
#72 Thanks to our foolish politicians (including Obama), Medicare is facing unfunded liabilities of more than 38 trillion dollars over the next 75 years. That comes to approximately $328,404 for each and every household in the United States.
#73 Amazingly, the U.S. national debt is now up to 16.3 trillion dollars. When Barack Obama first took office the national debt was just 10.6 trillion dollars.
#74 During the first four years of the Obama administration, the U.S. government accumulated about as much debt as it did from the time that George Washington took office to the time that George W. Bush took office.
#75 Today, the U.S. national debt is more than 5000 times larger than it was when the Federal Reserve was originally created back in 1913.
Please share this article with as many people as you can. Time is running out, and we need to wake up as many people as possible.

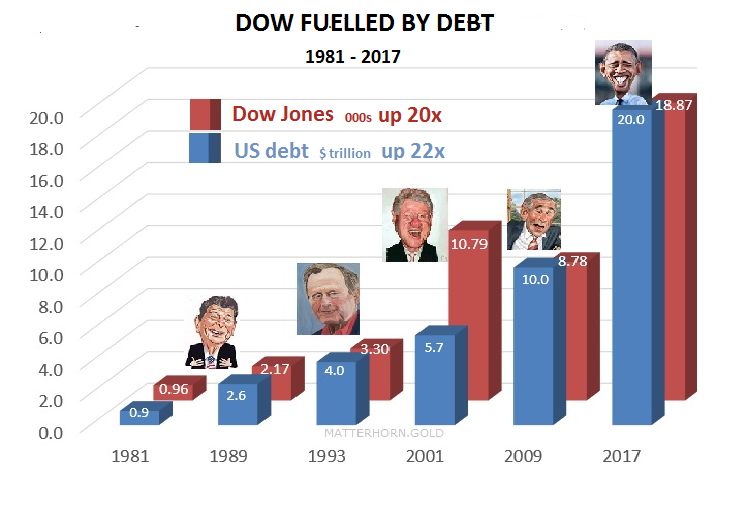
 The Dow Jones Industrial Average provides us with some pretty strong evidence that our “stock market boom” has been fueled by debt. On Wednesday, the Dow crossed the 20,000 mark for the first time ever, and this comes at a time when the U.S. national debt is right on the verge of hitting 20 trillion dollars. Is this just a coincidence? As you will see, there has been a very close correlation between the national debt and the Dow Jones Industrial Average for a very long time.