Bubbles, Bubbles Everywhere

Financial Bubbles - Public DomainIs there any doubt that we are living in a bubble economy?  At this moment in the United States we are simultaneously experiencing a stock market bubble, a government debt bubble, a corporate bond bubble, a bubble in San Francisco real estate, a farmland bubble, a derivatives bubble and a student loan debt bubble.  And of course similar things could be said about most of the rest of the planet as well.  In fact, the total amount of government debt around the world has risen by about 40 percent just since the last recession.  But it is never sustainable when asset prices and debt levels increase much faster than the overall level of economic growth.  History has shown us that all financial bubbles eventually burst.  And when these current financial bubbles in America burst, the pain is going to be absolutely enormous.

You know that things are getting perilous when even the New York Times starts pointing out financial bubbles everywhere.  The following is a short excerpt from a recent NotQuant article

The New York Times points out that just about everything on Earth is expensive by historical standards.   And then asks the seemingly obvious question:  Does that make it a bubble?

Welcome to the Everything Boom — and, quite possibly, the Everything Bubble. Around the world, nearly every asset class is expensive by historical standards. Stocks and bonds; emerging markets and advanced economies; urban office towers and Iowa farmland; you name it, and it is trading at prices that are high by historical standards relative to fundamentals. The inverse of that is relatively low returns for investors.

Quite possibly?”  We’re not sure what definition of the word “bubble” they’re using.   But in our book when the price of literally everything blasts upwards, obliterating the previous ceilings of historical benchmarks, it’s a pretty good indication that you’re in a bubble.

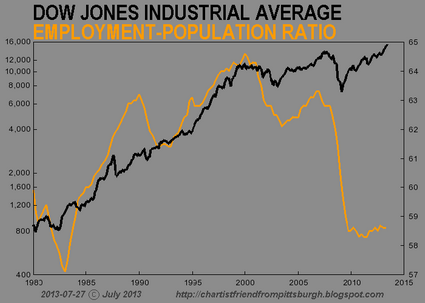
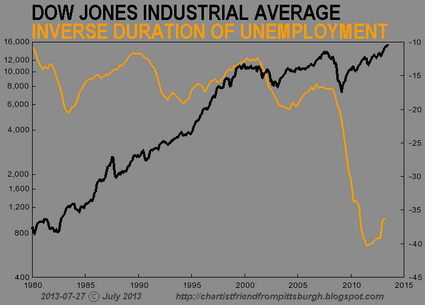
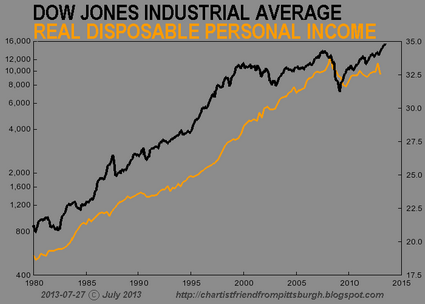
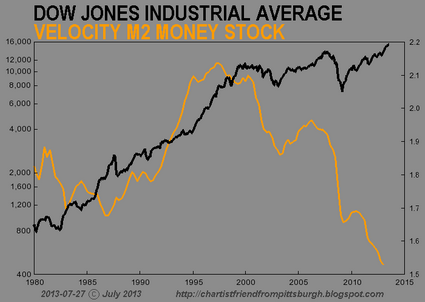
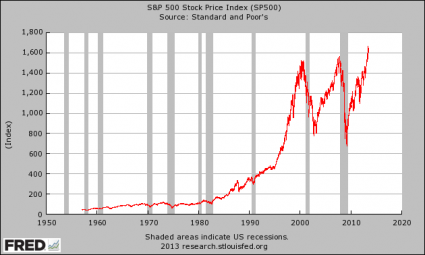
Of course when most people think of financial bubbles the very first thing they think of is the stock market.  And without a doubt we are in a stock market bubble right now.  The Dow has risen more than 10,000 points since the depths of the last recession.  And it is nearly 3,000 points higher than it was at the peak of the last stock market bubble in 2007 when our economy was far stronger than it is now…

Dow Jones Industrial Average 2014

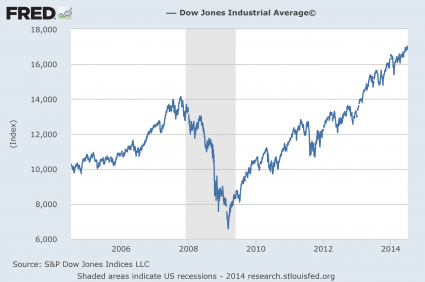
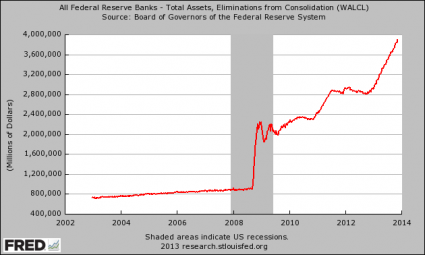
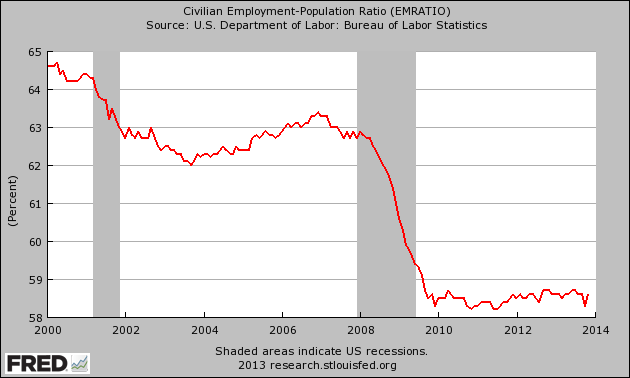
But of course these stock prices do not reflect economic reality in any way whatsoever.  Our economy has not even come close to recovering to the level it was at prior to the last financial crisis, and yet thanks to massive Federal Reserve money printing stock prices have soared to unprecedented heights.

At some point a massive correction is coming.  No stock market bubble lasts forever.  For a whole bunch of technical reasons why serious market turmoil is on the horizon, please see a recent Forbes article entitled “These 23 Charts Prove That Stocks Are Heading For A Devastating Crash“.

The bubbles in the financial markets have become so glaring that even the central bankers are starting to warn us about them.  For example, just consider what the Bank for International Settlements is saying

The Bank for International Settlements has warned that “euphoric” financial markets have become detached from the reality of a lingering post-crisis malaise, as it called for governments to ditch policies that risk stoking unsustainable asset booms.

While the global economy is struggling to escape the shadow of the crisis of 2007-09, capital markets are “extraordinarily buoyant”, the Basel-based bank said, in part because of the ultra-low monetary policy being pursued around the world. Leading central banks should not fall into the trap of raising rates “too slowly and too late”, the BIS said, calling for policy makers to halt the steady rise in debt burdens around the world and embark on reforms to boost productivity.

In its annual report, the BIS also warned of the risks brewing in emerging markets, setting out early warning indicators of possible banking crises in a number of jurisdictions, including most notably China.

“Particularly for countries in the late stages of financial booms, the trade-off is now between the risk of bringing forward the downward leg of the cycle and that of suffering a bigger bust later on,” it said.

Sadly, just like in 2007, most people are choosing not to listen to these warnings.

Another very troubling bubble that is brewing is the massive bubble of consumer credit in the United States.  According to the Wall Street Journal, consumer credit in the United States increased at a 7.4 percent annual rate in May…

The Federal Reserve reported Tuesday that consumer credit—consumer loans excluding real estate debt—in May increased at an annual rate of 7.4% to a record $3.195 trillion. Most of that gain came from a 9.3% increase in nonrevolving credit, the bulk of which is accounted for by auto and student loans. Revolving credit, which is primarily credit-card debt, expanded at a more muted 2.5% rate after jumping 12.3% in May.

That might be okay if our paychecks were increasing at a 7.4% annual rate, but that is not the case at all.  In fact, median household income in America has gone down for five years in a row.  As the quality of our jobs goes down the drain, our paychecks are shrinking even as our bills go up.  This is putting an incredible amount of stress on tens of millions of American families.

And when you look at the overall debt bubble in this country, things become even more frightening.

In a previous article, I shared a chart which shows the incredible growth of total debt in the United States.  Over the past 40 years, it has gone from about 2.2 trillion dollars to nearly 60 trillion dollars

Total Debt


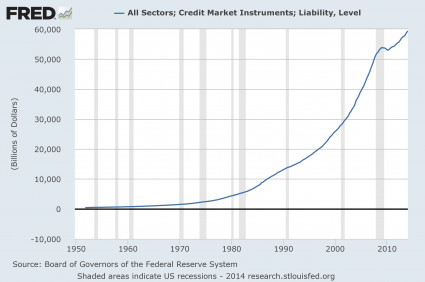
Is this sustainable?

Of course not.

None of these financial bubbles are.

It is not a question of “if” they will burst.  It is only a question of “when”.

And some believe that we are rapidly approaching that point.  In fact, Marc Faber believes that we are seeing signs that it may be starting to happen already…

It’s the question investors everywhere are wrestling with: Are asset prices in a bubble, or do they simply reflect the fact that the global economy is growing once again?

For Marc Faber, editor of the Gloom, Boom & Doom Report, the answer is clear. In fact, he says the bubble may already be bursting.

“I think it’s a colossal bubble in all asset prices, and eventually it will burst, and maybe it has begun to burst already,” Faber said Tuesday on CNBC’s ‘Futures Now‘ as the S&P 500 lost ground for the second-straight session.

So what do you think?

How much time do you believe that we have before these bubbles start to burst?

Please feel free to share your thoughts by posting a comment below…

Is “Dr. Copper” Foreshadowing A Stock Market Crash Just Like It Did In 2008?

Stock Market Decline - Photo by NodulationIs the price of copper trying to tell us something?  Traditionally, “Dr. Copper” has been a very accurate indicator of where the global economy is heading next.  For example, back in 2008 the price of copper dropped from nearly $4.00 to under $1.50 in just a matter of months.  And now it appears that another big decline in the price of copper is starting to happen.  So far this year, the price of copper has dropped from a high of $3.40 back in January to a price of $2.95 as I write this article, and many analysts are warning that this is just the beginning.  By itself, this should be quite alarming to investors, but as you will see below there are a whole host of other signs that a stock market crash may be rapidly approaching.

But before we get to those other signs, let us discuss copper a bit more first.  I cannot remember a time since 2008 when there has been such an overwhelming negative consensus about where the price of copper is heading.  The following is from a CNBC article that was posted this week…

Cascading copper prices have multiple root causes that lead to one conclusion: The anticipated global economic recovery may not be all it’s cracked up to be.

Consequently, analysts are in virtual unison that the extended-term trajectory is lower for the metal often used as a growth barometer. Copper futures are off more than 12 percent in 2014 and 7 percent over just the past three days, though they rose less than 1 percent in Wednesday trading.

A slowdown in the global economy, forced selling by Chinese banks and technical factors have converged in multiple calls for more weakness in a commodity known by traders and economists as “Dr. Copper” for its ability to accurately make economic prognoses.

Of course there are some out there that are trying to claim that “this time is different” and that the price of copper is no longer a useful indicator for the global economy as a whole.

We shall see.

Meanwhile, there are lots of other signs that the financial markets are repeating patterns that we have seen in the past.  For instance, the level of margin debt on Wall Street just soared to another brand new record high

The amount of money investors borrowed from Wall Street brokers to buy stocks rose for a seventh straight month in January to a record $451.3 billion, a potential warning sign that in the past has coincided with irrational exuberance and stock market tops.

We saw margin debt spike dramatically like this just prior to the crash of the dotcom bubble in 2000 and just before the great financial crisis of 2008.  Just check out the chart in this article.

Shouldn’t we be alarmed that it is happening again?

If you listen carefully, there are many prominent voices in the financial world that are trying to warn us about this.  Here is one example

“One characteristic of getting closer to a market top is a major expansion in margin debt,” says Gary Kaltbaum, president of Kaltbaum Capital Management. “Expanding market debt fuels the bull market and is an investors’ best friend when stocks are rising. The problem is when the market turns (lower), it is the market’s worst enemy.

And of course margin debt is far from the only sign that indicates that we are in a massive stock market bubble that is about to crash.  The following is a list of 10 signs that comes from a recent article by Lance Roberts of STA Wealth Management

I was recently discussing the market, current sentiment and other investing related issues with a money manager friend of mine in California. (Normally, I would include a credit for the following work but since he works for a major firm he asked me not to identify him directly.)  However, in one of our many email exchanges he sent me the following note detailing the 10 typical warning signs of stock market exuberance.

(1) Expected strong OR acceleration of GDP and EPS  (40% of 2013’s EPS increase occurred in the 4th quarter)

(2) Large number of IPOs of unprofitable AND speculative companies

(3) Parabolic move up in stock prices of hot industries (not just individual stocks)

(4) High valuations (many metrics are at near-record highs, a few at record highs)

(5) Fantastic high valuation of some large mergers (e.g., Facebook & WhatsApp)

(6) High NYSE margin debt

Margin debt/gdp (March 2000: 2.7%, July 2007: 2.6%, Jan 2014: 2.6%)

Margin debt/market cap (March 2000: 1.8%, July 2007: 2.3%, Jan 2014: 2.0%)

(7) Household direct holdings of equities as % of total financial assets at 24%, second-highest level (data back to 1953, highest was 1998-2000)

(8) Highly bullish sentiment (down slightly from year-end peaks; still high or near record high, depending on the source)

(9) Unusually high ratio of selling to buying by corporate senior managers (the buy/sell ratio of senior corporate officers is now at the record post-1990 lows seen in Summer 2007 and Spring 2011)

(10) Stock prices rise following speculative press releases (e.g., Tesla will dominate battery business after they get partner who knows how to build batteries and they build a big factory.  This also assumes that NO ONE else will enter into that business such as GM, Ford or GE.)

All are true today, and it is the third time in the last 15 years these factors have occurred simultaneously which is the most remarkable aspect of the situation.

And for even more technical indicators such as these, please see Charles Hugh Smith’s excellent article entitled “Why 2014 Is Beginning to Look A Lot Like 2008“.

So do all of these numbers and charts actually prove that something is about to happen?

Not necessarily.

But if we do not learn from the past then we are doomed to repeat it.

At this point, even representatives from the big Wall Street banks are warning about the “euphoria” on Wall Street…

The stock market entered “euphoria mode” late last year and has remained there, except for a week in February, as “speculative froth” bubbles around the market’s hottest sectors, Citi’s chief equity strategist told CNBC on Tuesday.

And even market cheerleader Jim Cramer is warning that the stock market is now exhibiting “top behavior“…

The parabolic moves of stocks such as Plug Power and FuelCell Energy have the stock market exhibiting “top behavior,” CNBC’s Jim Cramer said Wednesday.

Cramer said he has tracked the fuel cells stocks since his days as a hedge fund manager. Runups in Freddie Mac and Fannie Mae also had him worried.

None of what you just read above guarantees that the stock market will crash this week, this month or even this year.

And nobody knows the exact date when the next stock market crash will happen.

But one thing is for certain – this massive stock market bubble will burst at some point, and when it does our economy is far less equipped to handle it than it was the last time.

Based on my research, I am entirely convinced that the coming economic crisis is going to be substantially worse than the last one, and that is very bad news for the United States.

So what do you think?

Do you agree or do you think that I am nuts?

Please feel free to share your opinion by posting a comment below…

Stock Prices Have Fallen For Six Weeks In A Row

Why Is Goldman Sachs Warning That The Stock Market Could Decline By 10 Percent Or More?

Time Is Running OutWhy has Goldman Sachs chosen this moment to publicly declare that stocks are overpriced?  Why has Goldman Sachs suddenly decided to warn all of us that the stock market could decline by 10 percent or more in the coming months?  Goldman Sachs has to know that when they release a report like this that it will move the market.  And that is precisely what happened on Monday.  U.S. stocks dropped precipitously.  So is Goldman Sachs just honestly trying to warn their clients that stocks may have become overvalued at this point, or is another agenda at work here?  To be fair, the truth is that all of the big banks should be warning their clients about the stock market bubble.  Personally, I have stated that the stock market has officially entered “crazytown territory“.  So it would be hard to blame Goldman Sachs for trying to tell the truth.  But Goldman Sachs also had to know that a warning that the stock market could potentially fall by more than 10 percent would rattle nerves on Wall Street.

This report that has just been released by Goldman Sachs has gotten a lot of attention.  In fact, an article about this report was featured at the top of the CNBC website for quite a while on Monday.  Needless to say, news of this report spread on Wall Street like wildfire.  The following is a short excerpt from the CNBC article

A stock market correction is approaching the level of near certainty as Wall Street faces a major paradigm shift in how to achieve price gains, according to a Goldman Sachs analysis.

In a market outlook that garnered significant attention from traders Monday, the firm’s strategists called the S&P 500 valuation “lofty by almost any measure” and attached a 67 percent probability to the chance that the market would fall by 10 percent or more, which is the technical yardstick for a correction.

Of course Goldman Sachs is quite correct to be warning about an imminent stock market correction.  Right now stocks are overvalued according to just about any measure that you could imagine

The current valuation of the S&P 500 is lofty by almost any measure, both for the aggregate market as well as the median stock: (1) The P/E ratio; (2) the current P/E expansion cycle; (3) EV/Sales; (4) EV/EBITDA; (5) Free Cash Flow yield; (6) Price/Book as well as the ROE and P/B relationship; and compared with the levels of (6) inflation; (7) nominal 10-year Treasury yields; and (8) real interest rates. Furthermore, the cyclically-adjusted P/E ratio suggests the S&P 500 is currently 30% overvalued in terms of (9) Operating EPS and (10) about 45% overvalued using As Reported earnings.

There is a lot of technical jargon in the paragraph above, but essentially what it is saying is that stock prices are unusually high right now according to a whole host of key indicators.

And in case you were wondering, stocks did fall dramatically on Monday.  The Dow fell by 179 points, which was the biggest decline of the year by far.

So is Goldman Sachs correct about what could be coming?

Well, the truth is that there are many other analysts that are far more pessimistic than Goldman Sachs is.  For example, David Stockman, the Director of the Office of Management and Budget under President Reagan, believes that the U.S. stock market is heading for “a pretty rude day of awakening”

“This (2014) is the year of the end game. The party is over. We are now just at the point where they are rounding up the Wall Street drunks who are swilling on the fifth consecutive seasonally maladjusted phony recovery. That will become evident in the weeks and months ahead. Then I think the markets are going to have a pretty rude day of awakening.”

For many more forecasts that are similar to this, please see my previous article entitled “Dent, Faber, Celente, Maloney, Rogers – What Do They Say Is Coming In 2014?

There are also some other signs that we are rapidly heading toward a major “turning point” in the financial world in 2014.  One of those signs is the continual decline of Comex gold inventories.  Someone out there (China?) is voraciously gobbling up physical gold.  The following is a short excerpt from a recent article by Steve St. Angelo

After a brief pause in the decline of Comex Gold inventories, it looks like it has continued once again as there were several big withdrawals over the past few days. Not only was there a large removal of gold from the Comex today, the Registered (Dealer) inventories are now at a new record low.

And of course the overall economy continues to get even weaker.  The Baltic Dry Index (a very important indicator of global economic activity) has fallen by more than 40 percent over the past couple of weeks

We noted Friday that the much-heralded Baltic Dry Index has seen the worst start to the year in over 30 years. Today it got worse. At 1,395, the the Baltic Dry index, which reflects the daily charter rate for vessels carrying cargoes such as iron ore, coal and grain, is now down 18% in the last 2 days alone (biggest drop in 6 years), back at 4-month lows. The shipping index has utterly collapsed over 40% in the last 2 weeks.

So does this mean that tough times are just around the corner?

Maybe.

Or perhaps things will stabilize again and this little bubble of false prosperity that we have been enjoying will be extended for a little while longer.

The important thing is to not get too caught up in the short-term numbers.

If you look at our long-term national “balance sheet numbers” and the long-term trends that are systematically destroying our economy, it becomes abundantly clear that a massive economic collapse is on the way.  Our national debt is on pace to more than double during the Obama years, our “too big to fail” banks are now much bigger and much more reckless than they were before the financial crash of 2008, and the middle class in America is steadily shrinking.  In other words, our long-term national “balance sheet numbers” are worse than ever.

We consume far more wealth than we produce, and our entire nation is drowning in a massive ocean of red ink that stretches from sea to shining sea.

This is not sustainable, and it is inevitable that the stock market will catch up with economic reality at some point.

It is just a matter of time.

The Stock Market Has Officially Entered Crazytown Territory

Looney Tunes - Photo by Ramon F VelasquezIt is time to crank up the Looney Tunes theme song because Wall Street has officially entered crazytown territory.  Stocks just keep going higher and higher, and at this point what is happening in the stock market does not bear any resemblance to what is going on in the overall economy whatsoever.  So how long can this irrational state of affairs possibly continue?  Stocks seem to go up no matter what happens.  If there is good news, stocks go up.  If there is bad news, stocks go up.  If there is no news, stocks go up.  On Thursday, the day after Christmas, the Dow was up another 122 points to another new all-time record high.  In fact, the Dow has had an astonishing 50 record high closes this year.  This reminds me of the kind of euphoria that we witnessed during the peak of the housing bubble.  At the time, housing prices just kept going higher and higher and everyone rushed to buy before they were “priced out of the market”.  But we all know how that ended, and this stock market bubble is headed for a similar ending.

It is almost as if Wall Street has not learned any lessons from the last two major stock market crashes at all.  Just look at Twitter.  At the current price, Twitter is supposedly worth 40.7 BILLION dollars.  But Twitter is not profitable.  It is a seven-year-old company that has never made a single dollar of profit.

Not one single dollar.

In fact, Twitter actually lost 64.6 million dollars last quarter alone.  And Twitter is expected to continue losing money for all of 2015 as well.

But Twitter stock is up 82 percent over the last 30 days, and nobody can really give a rational reason for why this is happening.

Overall, the Dow is up more than 25 percent so far this year.  Unless something really weird happens over the next few days, it will be the best year for the Dow since 1996.

It has been a wonderful run for Wall Street.  Unfortunately, there are a whole host of signs that we have entered very dangerous territory.

The median price-to-earnings ratio on the S&P 500 has reached an all-time record high, and margin debt at the New York Stock Exchange has reached a level that we have never seen before.  In other words, stocks are massively overpriced and people have been borrowing huge amounts of money to buy stocks.  These are behaviors that we also saw just before the last two stock market bubbles burst.

And of course the most troubling sign is that even as the stock market soars to unprecedented heights, the state of the overall U.S. economy is actually getting worse…

-During the last full week before Christmas, U.S. store visits were 21 percent lower than a year earlier and retail sales were 3.1 percent lower than a year earlier.

-The number of mortgage applications just hit a new 13 year low.

-The yield on 10 year U.S. Treasuries just hit 3 percent.

For many more signs like this, please see my previous article entitled “37 Reasons Why ‘The Economic Recovery Of 2013’ Is A Giant Lie“.

And most Americans don’t realize this, but the U.S. financial system and the overall U.S. economy are now in much weaker condition than they were the last time we had a major financial crash back in 2008.  Employment is at a much lower level than it was back then and our banking system is much more vulnerable than it was back then.  Just before the last financial crash, the U.S. national debt was sitting at about 10 trillion dollars, but today it has risen to more than 17.2 trillion dollars.  The following excerpt from a recent article posted on thedailycrux.com contains even more facts and figures which show how our “balance sheet numbers” continue to get even worse…

Since the fourth quarter of 2009, the U.S. current account deficit has been more than $100 billion per quarter. As a result, foreigners now own $4.2 trillion more U.S. investment assets than we own abroad. That’s $1.7 trillion more than when Buffett first warned about this huge problem in 2003. Said another way, the problem is 68% bigger now.

And here’s a number no one else will tell you – not even Buffett. Foreigners now own $25 trillion in U.S. assets. And yet… we continue to consume far more than we produce, and we borrow massively to finance our deficits.

Since 2007, the total government debt in the U.S. (federal, state, and local) has doubled from around $10 trillion to $20 trillion.

Meanwhile, the size of Fannie and Freddie’s mortgage book declined slightly since 2007, falling from $4.9 trillion to $4.6 trillion. That’s some good news, right?

Nope. The excesses just moved to a new agency. The “other” federal mortgage bank, the Federal Housing Administration, now is originating 20% of all mortgages in the U.S., up from less than 5% in 2007.

Student debt, also spurred on by government guarantees, has also boomed, doubling since 2007 to more than $1 trillion. Altogether, total debt in our economy has grown from around $50 trillion to more than $60 trillion since 2007.

So don’t be fooled by this irrational stock market bubble.

Just because a bunch of half-crazed investors are going into massive amounts of debt in a desperate attempt to make a quick buck does not mean that the overall economy is in good shape.

In fact, much of the country is in such rough shape that “reverse shopping” has become a huge trend.  Even big corporations such as McDonald’s are urging their employees to return their Christmas gifts in order to bring in some much needed money…

In a stark reminder of how tough things still are for low-income families in America, McDonalds has advised workers to dig themselves “out of holiday debt” by cashing in their Christmas haul.

“You may want to consider returning some of your unopened purchases that may not seem as appealing as they did,” said a website set up for employees.

“Selling some of your unwanted possessions on eBay or Craigslist could bring in some quick cash.”

This irrational stock market bubble is not going to last for too much longer.  And a lot of top financial experts are now warning their clients to prepare for the worst.  For example, David John Marotta of Marotta Wealth Management recently told his clients that they should all have a “bug-out bag” that contains food, a gun and some ammunition…

A top financial advisor, worried that Obamacare, the NSA spying scandal and spiraling national debt is increasing the chances for a fiscal and social disaster, is recommending that Americans prepare a “bug-out bag” that includes food, a gun and ammo to help them stay alive.

David John Marotta, a Wall Street expert and financial advisor and Forbes contributor, said in a note to investors, “Firearms are the last item on the list, but they are on the list. There are some terrible people in this world. And you are safer when your trusted neighbors have firearms.”

His memo is part of a series addressing the potential for a “financial apocalypse.” His view, however, is that the problems plaguing the country won’t result in armageddon. “There is the possibility of a precipitous decline, although a long and drawn out malaise is much more likely,” said the Charlottesville, Va.-based president of Marotta Wealth Management.

So what do you think is coming in 2014?

Please feel free to share your thoughts by posting a comment below…

15 Signs That We Are Near The Peak Of An Absolutely Massive Stock Market Bubble

Bubble - Photo by Jeff KubinaOne of the men that won the Nobel Prize for economics this year says that “bubbles look like this” and that he is “most worried about the boom in the U.S. stock market.”  But you don’t have to be a Nobel Prize winner to see what is happening.  It should be glaringly apparent to anyone with half a brain.  The financial markets have been soaring while the overall economy has been stagnating.  Reckless injections of liquidity into the financial system by the Federal Reserve have pumped up stock prices to ridiculous extremes, and people are becoming concerned.  In fact, Google searches for the term “stock bubble” are now at the highest level that we have seen since November 2007.  Despite assurances from the mainstream media and the Federal Reserve that everything is just fine, many Americans are beginning to realize that we have seen this movie before.  We saw it during the dotcom bubble, and we saw it during the lead up to the horrible financial crisis of 2008.  So precisely when will the bubble burst this time?  Nobody knows for sure, but without a doubt this irrational financial bubble will burst at some point.  Remember, a bubble is always the biggest right before it bursts, and the following are 15 signs that we are near the peak of an absolutely massive stock market bubble…

#1 Bob Shiller, one of the winners of this year’s Nobel Prize for economics, says that “bubbles look like this” and that he is “most worried about the boom in the U.S. stock market.”

#2 The total amount of margin debt has risen by 50 percent since January 2012 and it is now at the highest level ever recorded.  The last two times that margin debt skyrocketed like this were just before the bursting of the dotcom bubble in 2000 and just before the financial crisis of 2008.  When this house of cards comes crashing down, things are going to get very messy

“When the tablecloth gets pulled out from under the place settings, you’re going to have a lot of them crash and smash on the floor,” said Uri Landesman, president of Platinum Partners hedge fund. “That margin’s going to get pulled and everyone’s going to have to cover. That’s when you get really serious corrections.”

#3 Since the bottom of the market in 2009, the Dow has jumped 143 percent, the S&P 500 is up 165 percent and the Nasdaq has risen an astounding 213 percent.  This does not reflect economic reality in any way, shape or form.

#4 Market research firm TrimTabs says that the S&P 500 is “very overpriced” right now.

#5 Marc Faber recently told CNBC that “we are in a gigantic speculative bubble”.

#6 In the United States, Google searches for the term “stock bubble” are at the highest level that we have seen since November 2007 – just before the last stock market crash.

#7 Price to earnings ratios are very high right now…

The Dow was trading at 17.8 times the past four quarters of earnings of its 30 components, according to The Wall Street Journal on Friday. That was up from 13.7 times its earnings a year ago. The S&P 500 is trading at 18.7 times earnings. The Nasdaq-100 Index is trading at 21.5 times earnings. At the very least, the ratios are signaling that stock prices are rich.

#8 According to CNBC, Pinterest is currently valued at more than 3 billion dollars even though it has never earned a profit.

#9 Twitter is a seven-year-old company that has never made a profit.  It actually lost 64.6 million dollars last quarter.  But according to the financial markets it is currently worth about 22 billion dollars.

#10 Right now, Facebook is trading at a valuation that is equivalent to approximately 100 years of earnings, and it is currently supposedly worth about 115 billion dollars.

#11 Howard Marks of Oaktree Capital recently stated that he believes that “markets are riskier than at any time since the depths of the 2008/9 crisis”.

#12 As Graham Summers recently noted, retail investors are buying stocks at a level not seen since the peak of the dotcom bubble back in 2000.

#13 David Stockman, a former director of the Office of Management and Budget under President Ronald Reagan, believes that this financial bubble is going to end very badly

“We have a massive bubble everywhere, from Japan, to China, Europe, to the UK.  As a result of this, I think world financial markets are extremely dangerous, unstable, and subject to serious trouble and dislocation in the future.”

#14 Bob Janjuah of Nomura Securities believes that there “could be a 25% to 50% sell off in global stock markets” over the next couple of years.

#15 According to Tyler Durden of Zero Hedge, the U.S. stock market is repeating a pattern that we have seen many times before.  According to him, we are experiencing “a well-defined syndrome of ‘overvalued, overbought, overbullish, rising-yield’ conditions that has appeared exclusively at speculative market peaks – including (exhaustively) 1929, 1972, 1987, 2000, 2007, 2011 (before a market loss of nearly 20% that was truncated by investor faith in a new round of monetary easing), and at three points in 2013: February, May, and today.”

As I mentioned at the top of this article, this stock market bubble has been fueled by quantitative easing.  Easy money from the Fed has been artificially inflating stock prices, and this has greatly benefited a very small percentage of the U.S. population.  In fact, 82 percent of all individually held stocks are owned by the wealthiest 5 percent of all Americans.

When this stock market bubble does burst, those wealthy Americans are going to be in for a tremendous amount of pain.

But there are some people out there that argue that what we are witnessing is not a stock market bubble at all.  That includes Janet Yellen, the new head of the Federal Reserve.  Recently, she insisted that there is absolutely nothing to be worried about…

“Stock prices have risen pretty robustly,” Yellen said. “But I think that if you look at traditional valuation measures, you would not see stock prices in territory that suggests bubble-like conditions.”

We shall see who was right and who was wrong.  Let’s all file that one away and come back to it in a few years.

So where are stocks going next?

If you had the answer to that question, you could probably make a lot of money.

Yes, the current bubble could burst at any moment, or stocks could continue going up for a little while longer.

After all, the S&P 500 has risen in December about 80 percent of the time over the past thirty years.

Perhaps that will be the case this December as well.

Perhaps not.

Do you feel lucky?

The Federal Reserve Is Monetizing A Staggering Amount Of U.S. Government Debt

Federal Reserve Balance SheetThe Federal Reserve is creating hundreds of billions of dollars out of thin air and using that money to buy U.S. government debt and mortgage-backed securities and take them out of circulation.  Since the middle of 2008, these purchases have caused the Fed’s balance sheet to balloon from under a trillion dollars to nearly four trillion dollars.  This represents the greatest central bank intervention in the history of the planet, and Janet Yellen says that she does not anticipate that it will end any time soon because “the recovery is still fragile”.  Of course, as I showed the other day, the truth is that quantitative easing has done essentially nothing for the average person on the street.  But what QE has done is that it has sent stocks soaring to record highs.  Unfortunately, this stock market bubble is completely and totally divorced from economic reality, and when the easy money is taken away the bubble will collapse.  Just look at what happened a few months ago when Ben Bernanke suggested that the Fed may begin to “taper” the amount of quantitative easing that it was doing.  The mere suggestion that the flow of easy money would start to slow down a little bit was enough to send the market into deep convulsions.  This is why the Federal Reserve cannot stop monetizing debt.  The moment the Fed stops, it could throw our financial markets into a crisis even worse than what we saw back in 2008.

The problems that plagued our financial system back in 2008 have never been fixed.  They have just been papered over temporarily by trillions of easy dollars from the Federal Reserve.  All of this easy money is keeping stocks artificially high and interest rates artificially low.

Right now, the Federal Reserve is buying approximately 85 billion dollars worth of U.S. government debt and mortgage-backed securities each month.  We are told that the portion going to buy U.S. government debt each month is approximately 45 billion dollars, but who knows what the Fed is actually doing behind the scenes.  In any event, by creating money out of thin air and using it to remove U.S. Treasury securities out of circulation, the Federal Reserve is essentially monetizing U.S. government debt at a staggering rate.

But Federal Reserve officials continue to repeatedly deny that what they are doing is monetizing debt.   For instance, Federal Reserve Bank of Atlanta President Dennis Lockhart strongly denied this back in April: “I object to the view that the Fed is monetizing the debt”.

How in the world can Fed officials possibly deny that they are monetizing the debt?

Well, because the Fed is promising that it is going to eventually sell back all of the securities that it is currently buying.

Since the Fed does not plan to keep all of this government debt on its balance sheet indefinitely, that means that they are not actually monetizing it according to their twisted logic.

Try not to laugh.

And of course that will never, ever happen.  There is no possible way that the Fed will ever be able to stop recklessly creating money and then turn around and sell off 3 trillion dollars worth of government debt and mortgage-backed securities that it has accumulated since 2008.  Just look at the chart posted below.  Does this look like something that the Federal Reserve will ever be able to “unwind”?…

Federal Reserve Balance Sheet

Remember, just the suggestion that the Fed would begin to slow down the pace of this buying spree a little bit was enough to send the financial markets into panic mode a few months ago.

If the Fed does decide to permanently stop quantitative easing at some point, stocks will drop dramatically and interest rates will skyrocket because there will be a lot less demand for U.S. Treasuries.  In fact, interest rates have already risen substantially over the past few months even though quantitative easing is still running.

Right now, the Fed is supplying a tremendous amount of the demand for U.S. debt securities in the marketplace.  According to Zero Hedge, Drew Brick of RBS recently made the following statement about the staggering amount of government debt that is currently being monetized by the Fed…

“On a rolling six-month average, in fact, the Fed is now responsible for monetizing a record 70% of all net supply measured in 10y equivalents. This represents a reliance on the Fed that is greater than ever before in history!

Overall, the Federal Reserve now holds 32.47 percent of all 10 year equivalents, and that percentage is rising by about 0.3 percent each week.

If the Federal Reserve does not keep doing this, the financial markets are going to crash because they are being propped up artificially by all of this funny money.

But if the Federal Reserve keeps doing this, it is going to become increasingly obvious to the rest of the world that the Fed is simply monetizing debt and is starting to behave like the Weimar Republic.

The remainder of the planet is watching what the Federal Reserve is doing very carefully, and they are starting to ask themselves some very hard questions.

Why should they continue to use our dollars to trade with one another when the Fed is wildly creating money out of thin air and rapidly devaluing the existing dollars that they are holding?

And why should they continue to lend us trillions of dollars at ultra-low interest rates that are way below the real rate of inflation when the U.S. government is already drowning in debt and the money that will be used to pay those debts back will be steadily losing value with each passing day?

The Federal Reserve is in very dangerous territory.  If the Fed wants the current system to continue, it is going to have to stop this reckless money printing at some point or else the rest of the world will eventually decide to stop participating in it.

If the Fed wants to go ahead and make quantitative easing a permanent part of our system, then eventually it will need to go all the way and start monetizing all of our debt.

Right now, the Fed is stuck in the middle of a “no man’s land” where it is monetizing a significant amount of U.S. government debt but it is trying to sell everyone else on the idea that it is not really monetizing debt.  This is a state of affairs that cannot go on indefinitely.

At some point, the Fed is going to have to make a decision.  And for now the Fed seems to be married to the idea that eventually things will get back to “normal” and they will stop monetizing debt.

Even Janet Yellen is admitting that quantitative easing “cannot continue forever”.

However, she also said on Thursday that it is important not to end quantitative easing too rapidly, “especially when the recovery is still fragile“.

Well, at this point quantitative easing has been going on in one form or another for about five years now.

Will it ever end?

And when it does, how bad will the financial crash be?

Meanwhile, with each passing day the faith that the rest of the world has in our dollar and in our financial system continues to erode.

If the Fed continues to behave this recklessly, it is inevitable that the rest of the globe will begin to move even more rapidly away from the U.S. dollar and will become much more hesitant to lend us money.

Ultimately, the Federal Reserve is faced with only bad choices.  The status quo is not sustainable, ending quantitative easing will cause the financial markets to crash, and going “all the way” with quantitative easing will just turn us into the Weimar Republic.

But anyone with half a brain should have been able to see that this debt-based financial system that the Federal Reserve is at the heart of was going to end tragically anyway.  The 100 year anniversary of the Federal Reserve is coming up, and the truth is that it should have been abolished long ago.

The consequences of decades of very foolish decisions are catching up with us, and this is all going to end very, very badly.

I hope that you are getting ready.

7 Charts That Prove That The Stock Market Has Become Completely Divorced From Reality

7The mainstream media would have us believe that the U.S. economy must be in great shape since the stock market has been setting new all-time record highs this month.  But is that really true?  Yes, surging stock prices have enabled sales of beach homes in the Hamptons to hit a brand new record high.  However, the reality is that stock prices have not risen dramatically in recent years because corporations are doing so much better than before.  In fact, the growth in stock prices has been far, far greater than the growth of corporate revenues.  The only reason that stock prices have been climbing so much is because the Federal Reserve has been flooding the financial system with hundreds of billions of dollars that it has created out of thin air.  The Fed has created an artificial stock market bubble that is completely and totally divorced from economic reality.

Meanwhile, everything is not so fine for the rest of the U.S. economy.  Economic growth projections have been steadily declining over the past two years, and the growth rate of personal income in the United States has been on a huge downward trend since 2008.  The U.S. economy actually lost 240,000 full-time jobs last month, and the middle class continues to shrink.

So welcome to the “new normal” where most Americans struggle at least part of the time.  According to one recent survey, “four out of 5 U.S. adults struggle with joblessness, near poverty or reliance on welfare for at least parts of their lives”.  Things are tough out there, and they are steadily getting tougher.

Yes, the boys and girls up on Wall Street are doing great (for the moment), but most of the rest of the country is really struggling.  We have never even come close to recovering from the last major economic crisis, and now another one is rapidly approaching.

The other day, Chartist Friend from Pittsburgh sent me an email and told me that he had some charts that he wanted to share with me and asked if I wanted to see them.  I said sure, send them over right away.  These charts show very clearly that the stock market has become completely divorced from reality.

In a normal market, stock prices would only rise dramatically if the overall economy was healthy and growing.  Unfortunately, our economy is far from healthy and has been declining for a very long time.  If the financial markets were not being pumped up by so much money printing and so much debt, there is no way that stock prices would be this high.

If we truly did have a free market financial system, stock prices should be a reflection of the overall economy.  Instead, we have a very sick economy and financial markets that have been very highly manipulated.

For example, just check out the first chart that I have posted below.  If the economy was actually getting better, the percentage of working age Americans with a job should be increasing.  Sadly, that is not happening…

CFPGH-DJIA-04

This next chart shows how the average duration of unemployment has absolutely skyrocketed in recent years.  Yes, the duration of unemployment has improved slightly in recent months, but we are still very far from where we used to be.  Meanwhile, the stock market has been soaring to new all-time record highs…

CFPGH-DJIA-11

Traditionally, there has been a high degree of correlation between stock prices and real disposable personal income.  From the chart below, you can see that this relationship held up quite well through the end of the last recession, and then it started breaking down.  This is especially true at the very end of the chart.  Real Disposable income has started to decline sharply but stock prices just continue to soar…

CFPGH-DJIA-19

When an economy is healthy, money tends to circulate through that economy at a healthy pace.  That is why the chart below is so alarming.  The velocity of money is the lowest that it has been in modern times, and this indicates that economic activity should be slowing down.  But the Federal Reserve has enabled the bankers to thrive by pumping massive amounts of money into the financial system…

CFPGH-DJIA-05

When an economy goes into recession, freight shipments tend to go down.  In the chart below, you can see that this happened during the past two recessions.  Unfortunately, we have never even come close to returning to the level that we were at before the last recession, and yet the stock market has been able to soar to unprecedented heights…

CFPGH-DJIA-17

When an economy is growing and people are able to get good jobs, they tend to go out and buy new homes.  Yes, we have seen a bit of an increase in the number of new homes sold recently, but we are still a vast distance away from the level we were at before the last recession.  And now mortgage rates are starting to rise steadily, and this is likely going to cause the number of new homes sold to start going back down.  The chart below clearly shows us that the real estate market is far from healthy at this point…

CFPGH-DJIA-09

For most middle class Americans, their homes are their primary financial assets.  So the fact that home prices have declined so much is absolutely devastating for many families.  But stocks are primarily held by the top 5 percent of all Americans, and as the chart below shows, they have benefited greatly from the antics of the Federal Reserve in recent years…

CFPGH-DJIA-08

There is no way in the world that the stock market should be this high.  The economic fundamentals simply do not justify it.  As a society, we consume far more than we produce, our debt is growing at an exponential pace, our economic infrastructure is being absolutely gutted and our financial system is a giant Ponzi scheme that could collapse at any time.

And no market can stay divorced from reality forever.  At some point this bubble is going to burst, and when financial bubbles burst they tend to do so very rapidly.

As Marc Faber recently said, “one day, this financial bubble will have to adjust on the downside.”

When it does “adjust”, we are likely going to see a financial panic even worse than we witnessed back in 2008.  Credit will freeze up, economic activity will grind to a standstill and millions of Americans will lose their jobs.

Don’t assume that the bubble of false prosperity that we are enjoying right now will last forever.

It won’t.

Use the time that you have right now to prepare for what is ahead.

A great storm is rapidly approaching, and I don’t see any way that it is going to be averted.

Whenever Margin Debt Goes Over 2.25% Of GDP The Stock Market Always Crashes

Bubble - Photo by Jeff KubinaWhat do 1929, 2000 and 2007 all have in common?  Those were all years in which we saw a dramatic spike in margin debt.  In all three instances, investors became highly leveraged in order to “take advantage” of a soaring stock market.  But of course we all know what happened each time.  The spike in margin debt was rapidly followed by a horrifying stock market crash.  Well guess what?  It is happening again.  In April (the last month we have a number for), margin debt rose to an all-time high of more than 384 billion dollars.  The previous high was 381 billion dollars which occurred back in July 2007.  Margin debt is about 29 percent higher than it was a year ago, and the S&P 500 has risen by more than 20 percent since last fall.  The stock market just continues to rise even though the underlying economic fundamentals continue to get worse.  So should we be alarmed?  Is the stock market bubble going to burst at some point?  Well, if history is any indication we are in big trouble.  In the past, whenever margin debt has gone over 2.25% of GDP the stock market has crashed.  That certainly does not mean that the market is going to crash this week, but it is a major red flag.

The funny thing is that the fact that investors are so highly leveraged is being seen as a positive thing by many in the financial world.  Some believe that a high level of margin debt is a sign that “investor confidence” is high and that the rally will continue.  The following is from a recent article in the Wall Street Journal

The rising level of debt is seen as a measure of investor confidence, as investors are more willing to take out debt against investments when shares are rising and they have more value in their portfolios to borrow against. The latest rise has been fueled by low interest rates and a 15% year-to-date stock-market rally.

Others, however, consider the spike in margin debt to be a very ominous sign.  Margin debt has now risen to about 2.4 percent of GDP, and as the New York Times recently pointed out, whenever we have gotten this high before a market crash has always followed…

The first time in recent decades that total margin debt exceeded 2.25 percent of G.D.P. came at the end of 1999, amid the technology stock bubble. Margin debt fell after that bubble burst, but began to rise again during the housing boom — when anecdotal evidence said some investors were using their investments to secure loans that went for down payments on homes. That boom in margin loans also ended badly.

Posted below is a chart of the performance of the S&P 500 over the last several decades.  After looking at this chart, compare it to the margin debt charts that the New York Times recently published that you can find right here.  There is a very strong correlation between these charts.  You can find some more charts that directly compare the level of margin debt and the performance of the S&P 500 right here.  Every time margin debt has soared to a dramatic new high in the past, a stock market crash and a recession have always followed.  Will we escape a similar fate this time?

S&P 500

What makes all of this even more alarming is the fact that a number of things that we have not seen happen in the U.S. economy since 2009 are starting to happen again.  For much more on this, please see my previous article entitled “12 Clear Signals That The U.S. Economy Is About To Really Slow Down“.

At some point the stock market will catch up with the economy.  When that happens, it will probably happen very rapidly and a lot of people will lose a lot of money.

And there are certainly a lot of prominent voices out there that are warning about what is coming.  For example, the following is what renowned investor Alan M. Newman had to say about the current state of the market earlier this year

“If anything has changed yet in 2013, we certainly do not see it. Despite the early post-fiscal cliff rally, this is the same beast we rode to the 2007 highs for the Dow Industrials. The U.S. stock market is over leveraged, overpriced and has been commandeered by mechanical forces to such an extent that all holding periods are now affected by more risk than at any time in history.”

Unfortunately, most Americans never get to hear such voices.  Instead, most Americans rely on the mainstream media to do much of their thinking for them.  And right now the mainstream media is insisting that we are not in a stock market bubble…

Forbes: “Why Stocks Are On Solid Footing And This Is No Bubble

ABC News: “AP Survey: Economists See No Stock Market Bubble

Businessweek: “Prognostications: It’s Not a Stock Bubble

Yahoo: “This Is NOT a Stock Bubble! Says Ben Stein

MarketWatch: “Is a stock bubble coming? No, say economists

So what do you think?

Do you believe that we are in a stock market bubble that is about to burst, or do you believe that everything is going to be just fine?

Please feel free to express your opinion by posting a comment below…