The Next Stock Market Crash Will Be Blamed On Donald Trump But It Will Be The Federal Reserve’s Fault Instead

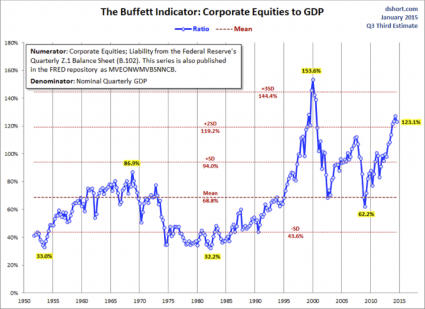
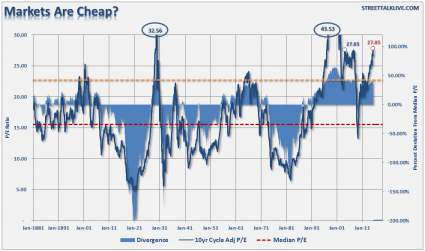
A stock market crash is coming, and the Democrats and the mainstream media are going to blame Donald Trump for it even though it won’t be his fault.  The truth is that we were headed for a major financial crisis no matter who won the election.  The Dow Jones Industrial Average is up a staggering 230 percent since the lows of 2009, and no stock market rally in our history has ever reached the 10 year mark without at least a 20 percent downturn.  At this point stocks are about as overvalued as they have ever been, and every other time we have seen a bubble of this magnitude a historic stock market crash has always followed.  Those that are hoping that this time will somehow be different are simply being delusional.

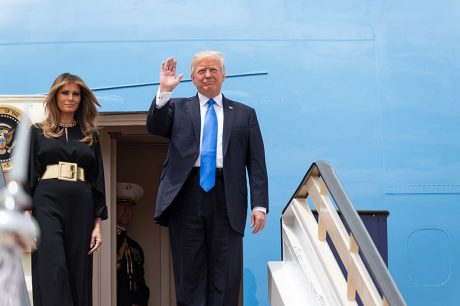
Since November 7th, the Dow is up by about 3,000 points.  That is an extremely impressive rally, and President Trump has been taking a great deal of credit for it.

But perhaps he should not have been so eager to take credit, because what goes up must come down.  The following is an excerpt from a recent Vanity Fair article

According to Douglas Ramsay, chief investment officer of the Leuthold Group, Trump administration officials will come to regret gloating about the market’s performance. That’s because Trump enters the White House during one of the most richly valued stock markets in U.S. history. The last president to come in at such valuations was George W. Bush, and the dot-com bubble burst soon afterward. Bill Clinton began his second term in a more overvalued stock market in 1997, and exited unscathed. But if his timing were different by just a year, he would have been blamed for the early-aughts market crash.

This stock market bubble was not primarily created by Barack Obama, Donald Trump or any other politician.  Rather, the Federal Reserve was primarily responsible for creating it by pushing interest rates all the way to the floor during the Obama era and by flooding the financial system with hot money during several stages of quantitative easing.

But now the economy is slowing down.  Economic growth on an annual basis was just 0.7 percent during the first quarter, and yet the Federal Reserve is talking about raising interest rates anyway.

The Federal Reserve also raised interest rates in a slowing economy in the late 1930s, and that had the effect of significantly extending the economic problems during that decade.

As I noted in my article entitled “The Federal Reserve Must Go”, there have been 18 recessions or depressions since the Federal Reserve was created in 1913, and now we stand on the precipice of another one.

After this next crisis, hopefully Congress will finally understand that it is time to shut the Federal Reserve down for good, and I am going to do all that I can to make that happen.

Ron Paul is someone that I look up to greatly, and he also agrees that the blame for the coming crisis should be placed on the Federal Reserve instead of on Trump…

“There are some dire predictions that say in the next year, or 18 months, we have something arriving worse than 2008 and 2009, the downturn is much worse,” Paul said in a recent interview with liberty-minded anti-globalist radio host Alex Jones. “They’ll say, ah, it’s all Trump’s fault. No. It wasn’t. 08 and 09 wasn’t Obama’s fault. It was the fault of the Federal Reserve, it was the fault of the Keynesian economic model, the spending too much, the deficit. So, unfortunately, there’s nothing he can do — Trump can’t do it.”

Paul, a medical doctor who took a keen interest in economics throughout his celebrated career as a constitutionalist in Congress, said Trump could “help” the situation by pursuing good policies. “But you can’t avoid the correction, the correction is locked in place, because the deficits are there, the malinvestment, everybody agrees interest rates have been too low too long,” he said in the late January interview. “The only thing he can do is allow the recession to come, get it over with, liquidate the debt. Politically, nobody wants that, so you’re going to see runaway inflation before you see this country wake up.”

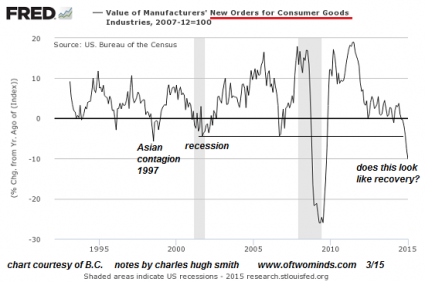
Over the past decade, the U.S. economy has grown at an average rate of just 1.33 percent, and there is no possible way to put a positive spin on that.

And now the economy appears to be entering a fresh slowdown.  A couple of months ago, banking giant UBS warned about “a sudden slowdown in new credit”

There’s been a sudden slowdown in new credit extended to businesses over the last year, one that strategists at UBS are calling “drastic” and “highly uncommon outside of economic downturns.”

And since that time, lending has tightened up even more.  The following comes from Zero Hedge

According to the latest Fed data [7], the all-important C&I loan growth contraction has not only continued, but over the past two months, another 50% has been chopped off, and what in early March was a 4.0% annual growth [4]is now barely positive, down to just 2.0%, and set to turn negative in just a few weeks. This was the lowest growth rate since May 2011, right around the time the Fed was about to launch QE2.

At the same time, total loan growth has likewise continued to decline, and as of the second week of May was down to 3.8%, the weakest overall loan creation in three years.

This is exactly what we would expect to see if we were entering a new recession.  Neil Howe, one of the authors of The Fourth Turning, recently warned that “winter is coming” and I have to admit that I agree with him.

So when the stock market finally crashes, how bad could it be?

Well, one analyst that spoke to CNBC said that other historic market crashes have averaged “about 42 percent”…

“If you look at the market historically, we have had, on average, a crash about every eight to 10 years, and essentially the average loss is about 42 percent,” said Kendrick Wakeman, CEO of financial technology and investment analytics firm FinMason.

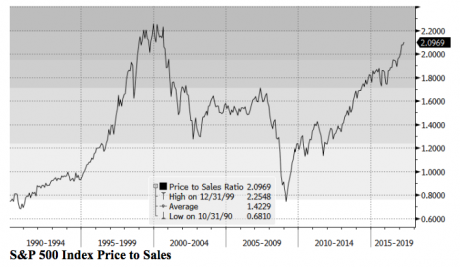
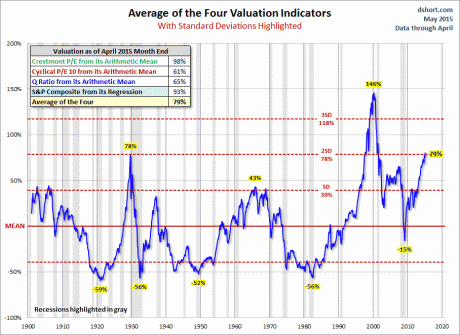
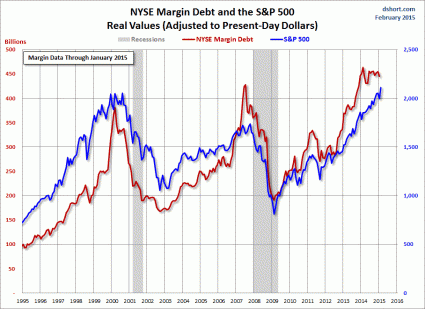
And as I have explained many times in the past, stocks would have to fall about 40 to 50 percent from current levels just for the stock market to get back to “normal” again.  The valuations that we are seeing today are absolutely insane, and there is no possible way that they are sustainable.

When the crash happens, many people will be pointing their fingers at Trump, but it won’t be his fault.

Instead, it will be the Federal Reserve that will be at fault, and hopefully this coming crisis will convince the American people that it is time to end this insidious debt-based central bank for good.

Have We Just Reached Peak Stock Market Absurdity?

Have you ever wondered how tech companies that have been losing hundreds of millions of dollars year after year can somehow be worth billions of dollars according to the stock market?  Because I run a website called “The Economic Collapse“, there are naysayers out there that take glee in mocking me by pointing out how well the stock market has been doing.  This week, the Dow is flirting with 21,000 and the Nasdaq crossed the 6,000 threshold for the first time ever.  But a lot of the “soaring stocks” that have been fueling this rally have been losing giant mountains of money every single year, and just like the first tech bubble this madness will eventually come to an end in a spectacular fiery crash in which investors will lose trillions of dollars.

Anyone that cannot see that we are in the midst of an absolutely insane stock market bubble simply does not understand economics.  Every valuation indicator that you can possibly point to says that we are in a bubble of epic proportions, and history teaches us that all bubbles inevitably come to an end at some point.

Earlier today, I came across an article by Graham Summers in which he persuasively argued that the price to sales ratio indicates that stock prices are far more inflated than they were just prior to the great stock market crash of 2008…

Sales cannot be gimmicked. Either money comes in the door, or it doesn’t. And if a company is caught messing around with its sales numbers, someone is going to jail.

For this reason, Price to Sales is perhaps the single most objective and clear means of measuring stock valuations.

This metric, above all others, you can point to and say, “this is definitively accurate and has not been messed with.”

On that note, as Bill King recently noted, today the S&P 500 is sporting a P/S ratio that is massively higher than it was in 2007 and is only marginally lower than it was during the Tech Bubble (the single largest stock bubble of all time for most measures).

To me, looking at profitability is even more important than looking at sales.

Large tech companies such as Twitter certainly have lots of revenue coming in, but many of them are deeply unprofitable.

In fact, Twitter has never made a yearly profit, and over the past decade it has actually lost more than 2 billion dollars.

But despite all of that, investors absolutely love Twitter stock.  As I write this article, Twitter has a market cap of 11.5 billion dollars.

How in the world is that possible?

How can a company that has never made a single penny be worth more than 11 billion dollars?

Twitter is never going to be more popular than it is now.  If it can’t make a profit at the peak of its popularity, when will it ever happen?

And guess what?  ABC News says that Twitter actually just reported a decline in revenue for the most recent quarter…

Twitter has never turned a profit, and for the first time since going public in 2013, it reported a decline in revenue from the previous year. Its revenue was $548.3 million, down 8 percent.

Net loss was $61.6 million, or 9 cents per share, compared with a loss of $79.7 million, or 12 cents per share, a year earlier.

The only reason why financial black holes such as Twitter can continue to exist is because investors have been willing to pour endless amounts of money into them, but now that bubble is starting to burst.

In his most recent article, Simon Black discussed how Silicon Valley investors are starting to become more cautious because so many of these “unicorns” are now going bust.  One of the examples that he cited in his article was a company called Clinkle…

(Given that investing in an early stage company is high-risk, investors might provide a few hundred thousand dollars in funding, at most. Clinkle raised $25 million.)

The company went on to burn through just about every penny of its investors’ capital.

There were even photos that surfaced of the 21-year old CEO literally setting bricks of cash on fire.

At the end of the farce, Clinkle never actually managed to build its supposedly ‘world-changing’ product, and the website is now all but defunct.

Most of you may have never even heard of Clinkle, but I bet that you have definitely heard of Netflix.

Netflix has revolutionized how movies are delivered to our homes, and that revolution helped drive movie rental stores to the brink of extinction.

There is just one huge problem.  It turns out that Netflix is losing hundreds of millions of dollars

Netflix might be my favorite example.

The company’s most recent earnings report for the period ending March 31, 2017 shows, yet again, negative Free Cash Flow of MINUS $422 million.

Not only is that a record loss, it’s 62% worse than in Q1/2016, and over twice as bad as Q1/2015.

Netflix just keeps losing more and more money.

But even though Netflix is losing money at a pace that is exceedingly difficult to imagine, investors absolutely love the company.

I just checked, and at this moment Netflix has a market cap of 68.4 billion dollars.

Sometimes I just want to scream because of the absurdity of it all.

Companies that are losing hundreds of millions of dollars a year at the peak of their popularity should not be worth billions of dollars.

Nobody can possibly argue that these enormously inflated stock prices are sustainable.  Just like with every other stock market bubble in our history, this one is going to burst too, and I have been warning about this for quite a long time.

But for the moment, the naysayers are having their time to shine.  Despite the fact that U.S. consumers are 12 trillion dollars in debt, and despite the fact that corporate debt has doubled since the last financial crisis, and despite the fact that the federal government is 20 trillion dollars in debt, they seem to be convinced that this irrational stock market bubble can keep inflating indefinitely.

Perhaps they can all put their money where their mouth is by pouring all of their savings into Twitter, Netflix and other tech company stocks.

In the end, we will see who was right and who was wrong.

What Is America Going To Look Like When Stocks, Home Prices And Even Used Cars All Crash By At Least 50 Percent?

Have you ever thought about what comes after the bubble?  In 2008 we got a short preview of what life will be like, but most Americans seem to have come to the conclusion that the last financial crisis was just a minor bump in the road toward endless economic prosperity.  But of course the truth is that the ridiculously high debt-fueled standard of living that we are enjoying now is not sustainable, and after this bubble bursts it will be an extremely painful adjustment for our society.

Since the last financial crisis, the U.S. national debt has nearly doubled, corporate debt has doubled, stock valuations have reached exceedingly ridiculous extremes, the student loan debt bubble has surpassed a trillion dollars, we are facing the largest unfunded pension crisis in U.S. history, and in many parts of the country (particularly the west coast) we are facing a housing bubble that is even worse than the one that burst in 2007 and 2008.

And even with all of these bubbles, U.S. GDP growth has been absolutely anemic.  Even if you believe the grossly manipulated numbers that the federal government puts out, the U.S. economy grew at a “miserably low” rate of just 1.6 percent in 2016…

In terms of GDP, the fourth quarter was revised up slightly, but there were adjustments for prior quarters, and overall GDP growth for the year 2016 remained at a miserably low 1.6%. We’ve come to call this the “stall speed.” It’s difficult for the US economy to stay aloft at this slow speed. As Q4 gutted any hopes for a strong finish, GDP growth in 2016 matched the worst year since the Great Recession.

And corporate profits, despite a stock market that has been surging for years, are even worse. A lot worse. They’ve declined for years. In fact, they declined for years during the prior two stock market bubbles, the dotcom bubble and the pre-Financial-Crisis bubble. Both ended in crashes.

Things have continued to get even worse early in 2016.  At this point, it is being projected that U.S. GDP will grow at an annual rate of just 0.9 percent during the first quarter of 2017.

So anyone that tries to tell you that the U.S. economy is in good shape is simply not being honest with you.

But even though things don’t look great now, they are going to look far, far worse after the biggest debt bubble in human history bursts.

For example, what do you think that America will look like after half of all stock market wealth disappears?  In a recent note to his clients, John P. Hussman stated that his team is projecting that by the end of this current market cycle “roughly half of U.S. equity market capitalization – $17 trillion in paper wealth – will simply vanish”.

And of course that projection lines up perfectly with what I have been saying for quite a while.  In order for key measures of stock market valuation (such as CAPE, etc.) to return to their long-term averages, stocks are going to have to fall at least 40 to 50 percent from their current levels.

As this coming crisis unfolds, other asset classes will experience astounding downturns as well.  This week, Morgan Stanley (one of the too big to fail banks) released a report that said that used car prices “could crash by up to 50%” over the next several years…

For months we’ve been talking about the massive lending bubble propping up the U.S. auto market. Now, noting many of the same concerns that we’ve highlighted repeatedly, Morgan Stanley’s auto team, led by Adam Jonas, has just issued a report detailing why they think used car prices could crash by up to 50% over the next 4-5 years.

Housing prices are primed for a major plunge as well.  This is especially true on the west coast where tech money and foreign purchasers from Asia have pushed home values up to dizzying levels.  Half a million dollars will be lucky to get you a “starter home” in San Francisco, and it was being reported that one poor techie living there was paying $1400 a month just to live in a closet.  Many believe that some cities on the west coast will be quite fortunate if home values only go down by 50 percent during the coming crash.

Everywhere you look there are bubbles.  In a recent piece, Daniel Lang pointed out some more of them

  • Eric Rosengren, the president of the Federal Reserve Bank of Boston, recently made a startling tacit admission. We may be in the midst of yet another real estate bubble. Major financial institutions in this country are in possession of over $14 trillion worth of residential real estate loans. That’s well over $40,000 for every man woman and child in America.
  • Low interest rates have fueled a bubble in subprime auto loans, and that bubble appears to be reaching its limits. There are now over 1 million ordinary and subprime auto loans that are delinquent, a number that hasn’t been this high since 2009.
  • There is now well over a trillion dollars worth of student loan debt in this country; much of it owned by low income families. And there’s little hope that these students will ever see a return on their investment. That’s why at least 27% of student loans are in default. While more than one in four students are in default now, that number was one in nine a decade ago. And if current trends continue, there could be $3.3 trillion of student loan debt by the end of the next decade.

At some point the imbalances become just too great and the system collapses in upon itself.

In other words, we are heading for a massive implosion.

And once the implosion happens, people are going to go absolutely nuts.  Anger and frustration are already rising to the boiling point all over the country, and it isn’t going to take much to push millions of Americans completely over the edge.

In a recent interview with Greg Hunter, author James Rickards warned that when things get really bad in America we could actually see what he refers to as “money riots”

So, could we be facing a “Mad Max” world if the financial system totally crashes? Rickards says, “In ‘Road to Ruin,’ I talk about what I call the money riots.  There is a lot of reasons for rioting.  When you start shutting banks and the stock exchange and they say you can’t get your money, it’s only temporary, trust us, people will go out and start to burn down banks.  The government is ready for that also with emergency response and martial law. . . . Governments don’t go down without a fight. . . . You can see the shutdown coming because they will try to buy time until they come up with a solution, whether it’s gold, Special Drawing Rights (SDR), guarantees or whatever it might be.  There are only two or three possibilities here, but all of them will take time, and they will have to shut down the system. . . . People will not sit for that.  So, that means people will riot.  They’ll burn down banks.  They will smash windows, but what is the reaction to that?  The answer is martial law, militarized police, actual military units and you get something that looks like fascism pretty quickly.”

I very much agree with his assessment.

All it is going to take is another major financial crisis and this nation will go completely and utterly insane.

Unfortunately, all of our long-term economic problems have proceeded to get a lot worse since the last time around, and so when things fall apart this time we will likely be looking at a scenario that is absolutely unprecedented in American history.

A lot of people have become very complacent out there these days, but that is a huge mistake.

Just because a crisis is delayed does not mean that it is canceled.  And because our leaders have kept making this economic bubble larger and larger, that just means that the coming crisis will be even more painful than it otherwise could have been.

The Federal Reserve Just Made Another Huge Mistake

The Great Seal Of The United States - A Symbol Of Your Enslavement - Photo by IpankoninAs stocks continue to crash, you can blame the Federal Reserve, because the Fed is more responsible for creating the current financial bubble that we are living in than anyone else.  When the Federal Reserve pushed interest rates all the way to the floor and injected lots of hot money into the financial markets during their quantitative easing programs, this pushed stock prices to wildly artificial levels.  The only way that it would have been possible to keep stock prices at those wildly artificial levels would have been to keep interest rates ultra-low and to keep recklessly creating lots of new money.  But now the Federal Reserve has ended quantitative easing and has embarked on a program of very slowly raising interest rates.  This is going to have very severe consequences for the markets, but Janet Yellen doesn’t seem to care.

There is a reason why the financial world hangs on every single word that is issued by the Fed.  That is because the massively inflated stock prices that we see today were a creation of the Fed and are completely dependent on the Fed for their continued existence.

Right now, stock prices are still 30 to 40 percent above what the economic fundamentals say that they should be based on historical averages.  And if we are now plunging into a very deep recession as I contend, stock prices should probably fall by a total of more than 50 percent from where they are now.

The only way that stock prices could have ever gotten this disconnected from economic reality is with the help of the Federal Reserve.  And since the U.S. dollar is the primary reserve currency of the entire planet, the actions of the Fed over the past few years have created stock market bubbles all over the globe.

But the only way to keep the party going is to keep the hot money flowing.  Unfortunately for investors, Janet Yellen and her friends at the Fed have chosen to go the other direction.  Not only has quantitative easing ended, but the Fed has also decided to slowly raise interest rates.  The Fed left rates unchanged on Wednesday, but we were told that we are probably still on schedule for another rate hike in March.

So how did the markets respond to the Fed?

Well, after attempting to go green for much of the day, the Dow started plunging very rapidly and ended up down 222 points.

The markets understand the reality of what they are now facing.  They know that stock prices are artificially high and that if the Fed keeps tightening that it is inevitable that they will fall back to earth.

In a true free market system, stock prices would be far, far lower than they are right now.  Everyone knows this – including Jim Cramer.  Just check out what he told CNBC viewers earlier today…

Jim Cramer was tempted to resurface his “they know nothing” rant after hearing the Fed speak on Wednesday. He was hoping that a few boxes on his market bottom checklist might be checked off, but it seems that the bear market has not yet run its course.

The Fed’s wishy-washy statement on interest rates today left stocks sinking back into oblivion after a nice rally yesterday,” the “Mad Money” host said.

Without artificial help from the Fed, stocks will most definitely continue to sink into oblivion.

That is because these current stock prices are not based on anything real.

And so as this new financial crisis continues to unfold, the magnitude of the crash is going to be much worse than it otherwise would have been.

It has often been said that the higher you go the farther you have to fall.  Because the Federal Reserve has pumped up stock prices to ridiculously high levels, that just means that the pain on the way down is going to be that much worse.

It is also important to remember that stocks tend to fall much more rapidly than they rise.  And when we see a giant crash in the financial markets, that creates a tremendous amount of fear and panic.  The last time there was great fear and panic for an extended period of time was during the crisis of 2008 and 2009, and this created a tremendous credit crunch.

During a credit crunch, financial institutions because very hesitant to lend to one another or to anyone else.  And since our economy is extremely dependent on the flow of credit, economic activity slows down dramatically.

As this current financial crisis escalates, you are going to notice certain things begin to happen.  If you own a business or you work at a business, you may start to notice that fewer people are coming in, and those people that do come in are going have less money to spend.

As economic activity slows, employers will be forced to lay off workers, and many businesses will shut down completely.  And since 63 percent of all Americans are living paycheck to paycheck, many will suddenly find themselves unable to meet their monthly expenses.  Foreclosures will skyrocket, and large numbers of people will go from living a comfortable middle class lifestyle to being essentially out on the street very, very rapidly.

At this point, many experts believe that the economic outlook for the coming months is quite grim.  For example, just consider what Marc Faber is saying

It won’t come as a surprise to market watchers that “Dr. Doom” Marc Faber isn’t getting any more cheerful.

But the noted bear at least found a sense of humor on Wednesday into which he could channel his bleakness.

The publisher of the “Gloom, Boom & Doom Report” told attendees at the annual “Inside ETFs” conference that the medium-term economic outlook has become “so depressing” that he may as well fill a newly installed pool with beer instead of water.

If the Federal Reserve had left interest rates at more reasonable levels and had never done any quantitative easing, we would have been forced to address our fundamental economic problems more honestly and stock prices would be far, far lower today.

But now that the Fed has created this giant artificial financial bubble, the coming crash is going to be much worse than it otherwise would have been.  And the tremendous amount of panic that this crash will cause will paralyze much of the economy and will ultimately lead to a far deeper economic downturn than we witnessed last time around.

Once the Fed started wildly injecting money into the system, they had no other choice but to keep on doing it.

By removing the artificial support that they had been giving to the financial markets, they are making a huge mistake, and they are setting the stage for an economic tragedy that will affect the lives of every man, woman and child in America.

Is The Stock Market Overvalued?

Stock Market Overvalued - Public DomainAre stocks overvalued?  By just about any measure that you could possibly name, stocks are at historically high prices right now.  From a technical standpoint, the stock market is more overvalued today than it was just prior to the last financial crisis.  The only two moments in U.S. history that even compare to our current state of affairs are the run up to the stock market crash of 1929 and the peak of the hysteria just before the dotcom bubble burst.  It is so obvious that stocks are in a bubble that even Janet Yellen has talked about it, but of course she will never admit that the Federal Reserve has played a key role in creating this bubble.  They say that hindsight is 20/20, but what is happening right in front of our eyes in 2015 is so obvious that everyone should be able to see it.  Just like with all other financial bubbles throughout our history, someday people will look back and talk about how stupid we all were.

Why can’t we ever learn from history?  We just keep on making the same mistakes over and over again.  And without a doubt, some of the smartest members of our society are trying to warn us about what is coming.  For example, Yale economics professor Robert Shiller has repeatedly tried to warn us that stocks are overvalued

I think that compared with history, US stocks are overvalued. One way to assess this is by looking at the CAPE (cyclically adjusted P/E) ratio that I created with John Campbell, now at Harvard, 25 years ago. The ratio is defined as the real stock price (using the S&P Composite Stock Price Index deflated by the CPI) divided by the ten-year average of real earnings per share. We have found this ratio to be a good predictor of subsequent stock market returns, especially over the long run. The CAPE ratio has recently been around 27, which is quite high by US historical standards. The only other times it has been that high or higher were in 1929, 2000, and 2007—all moments before market crashes.

But the CAPE ratio is not the only metric I watch. In my book Irrational Exuberance (3rd Ed., Princeton 2015) I discuss several metrics that help judge what’s going on in the market. These include my stock market confidence indices. One of the indicators in that series is based on a single question that I have asked individual and institutional investors over the years along the lines of, “Do you think the stock market is overvalued, undervalued, or about right?” Lately, what I call “valuation confidence” captured by this question has been on a downward trend, and for individual investors recently reached its lowest point since the stock market peak in 2000.

Other analysts prefer to use different valuation indicators than Shiller does.  But no matter which indicators you use, they all show that stocks are tremendously overvalued in mid-2015.  For instance, just consider the following chart.  It comes from Doug Short, and it shows the average of four of his favorite valuation indicators.  As you can see, there is only one other time in all of our history when stocks have been more overvalued than they are today according to the average of these four indicators…

Four Valuation Indicators - Doug Short

Another danger sign that many analysts are pointing to is the dramatic rise in margin debt that we have seen in recent years.  Investors are borrowing tremendous amounts of money to fund purchases of stock.  This is something that we witnessed during the dotcom bubble, it was something that we witnessed just prior to the financial collapse of 2008, and now it is happening again.  In fact, margin debt just surged to a brand new all-time record high.  Once again, the following chart comes from Doug Short

NYSE Margin Debt - Chart by Doug Short

All of this margin debt has helped drive stocks to ridiculous highs, but it can also serve to drive stock prices down very rapidly when the market turns.  This was noted by Henry Blodget of Business Insider in a recent editorial…

What is “margin debt”?

It’s the amount of money stock investors have collectively borrowed via traditional margin accounts to fund stock purchases.

In a bull market, the growth of margin debt serves as a turbocharger that helps drive stock prices higher.

As with a home mortgage, the more investors borrow, the more house or stock they can buy. So as margin debt grows, collective buying power grows. The borrowed money gets used to fund new stock purchases, which helps drives the prices of those stocks higher. The higher prices, in turn, allow traders to borrow more money to fund additional purchases. And so on.

It’s a self-reinforcing cycle.

The trouble is that it’s a self-reinforcing cycle on the way down, too.

If the overall U.S. economy was absolutely booming, these ultra-high stock prices would not be as much of a concern.  But the truth is that the financial markets have become completely divorced from economic reality.  Right now, corporate profits are actually falling and our exports are way down.  U.S. GDP shrunk during the first quarter, and there are a whole host of economic trouble signs on the horizon.  I am calling this a “recession within a recession“, and I believe that we are heading into another major economic downturn.

Unfortunately, our “leaders” are absolutely clueless about what is coming.  They assure us that everything is going to be just fine – just like they did back in 2008 before everything fell apart.  But the truth is that things are already so bad that even the big banks are sounding the alarm.  For instance, just consider the following words from Deutsche Bank

At issue is whether or not the Fed in particular but the market in general has properly understood the nature of the economic problem. The more we dig into this, the more we are afraid that they do not. So aside from a data revision tsunami, we would suggest that the Fed has the outlook not just horribly wrong, but completely misunderstood.

Ultimately, most people believe what they want to believe.

Our politicians want to believe that the economy is going to get better, and so do the bureaucrats over at the Federal Reserve.  The mainstream media wants to put a happy face on things, and they want all of us to continue to have faith in the system.

Unfortunately for them, the system is failing.  I truly do hope that this bubble can last for a few more months, but I don’t see it going on for much longer than that.

The greatest financial crisis in U.S. history is fast approaching, and it is going to be extraordinarily painful.

When it arrives, it is not just going to destroy faith in the system.  In the end, it is going to destroy the system altogether.

If Anyone Doubts That We Are In A Stock Market Bubble, Show Them This Article

Bubble In Hands - Public DomainThe higher financial markets rise, the harder they fall.  By any objective measurement, the stock market is currently well into bubble territory.  Anyone should be able to see this – all you have to do is look at the charts.  Sadly, most of us never seem to learn from history.  Most of us want to believe that somehow “things are different this time”.  Well, about the only thing that is different this time is that our economy is in far worse shape than it was just prior to the last major financial crisis.  That means that we are more vulnerable and will almost certainly endure even more damage this time around.  It would be one thing if stocks were soaring because the U.S. economy as a whole was doing extremely well.  But we all know that isn’t true.  Instead, what we have been experiencing is clearly artificial market behavior that has nothing to do with economic reality.  In other words, we are dealing with an irrational financial bubble, and all irrational financial bubbles eventually burst.  And as I wrote about yesterday, the way that stocks have moved so far this year is eerily reminiscent of the way that stocks moved in early 2008.  The warning signs are there – if you are willing to look at them.

The first chart that I want to share with you today comes from Doug Short.  It is a chart that shows that the ratio of corporate equities (stocks) to GDP is the second highest that it has been since 1950.  The only other time it has been higher was just before the dotcom bubble burst…

The Buffett Indicator from Doug Short

Does that look like a bubble to you?

It sure looks like a bubble to me.

In order for the corporate equities to GDP ratio to get back to the mean (average) level, stock prices would have to fall nearly 50 percent.

If that happens, people will be calling it a crash, but in truth it would just be a return to normalcy.

This next chart comes from Phoenix Capital Research.  The CAPE ratio (cyclically adjusted price-to-earnings ratio) is considered to be an extremely accurate measure of the true value of stocks…

As I’ve noted before, the single best predictor of stock market performance is the cyclically adjusted price-to-earnings ratio or CAPE ratio.

Corporate earnings are heavily influenced by the business cycle. Typically the US experiences a boom and bust once every ten years or so. As such, companies will naturally have higher P/E’s at some points and lower P/E’s at other. This is based solely on the business cycle and nothing else.

CAPE adjusts for this by measuring the price of stocks against the average of ten years’ worth of earnings, adjusted for inflation. By doing this, it presents you with a clearer, more objective picture of a company’s ability to produce cash in any economic environment.

Based on a study completed Vanguard, CAPE was the single best metric for measuring future stock returns.

When the CAPE ratio is too high, that means that stocks are overpriced and are not a good value.  And right now the CAPE ratio is the 3rd highest that it has been since 1890.  That only times it has been higher than this were in 1929 (we all remember what happened then) and just before the dotcom bubble burst…

CAPE - Phoenix Capital Research

The funny thing is that stocks have continued to rise even as corporate revenues have begun to fall.

According to Wolf Richter, in the first quarter of 2015 corporate revenues are projected to decline at the fastest pace that we have seen since the depths of the last recession…

Week after week, corporations and analysts have been whittling down their estimates. By now, revenues of the S&P 500 companies are expected to decline 2.8% in Q1 from a year ago – the worst year-over-year decline since Q3 of crisis year 2009.

This next chart I want to share with you shows how the Nasdaq has performed over the past decade.  Looking at this chart alone, you would think that the U.S. economy must have been absolutely roaring since the end of the last recession.  But what is really going on is rampant speculation.  Some of the tech companies that make up the Nasdaq are not making any profits at all and yet they are supposedly worth billions of dollars.  If you cannot see a bubble in this chart, you need to get your vision checked…

NASDAQ Chart

And this kind of irrational euphoria is not just happening in the United States.

For example, Chinese stocks are up nearly 80 percent over the past nine months.

Meanwhile, the overall Chinese economy is growing at the slowest pace that we have seen in about 20 years.

Right now, we are in the calm before the storm.  We are right at the door of the next great financial crisis, and most of the people that work in the industry know this.

And once in a while they let the cat out of the bag.

For example, consider what Hans-Jörg Vetter, the CEO of Landesbank Baden-Württemberg in Germany, had to say during one recent press conference

“Risk is no longer priced in,” he said. And these investors aren’t paid for the risks they’re taking. This applies to all asset classes, he said. The stock and the bond markets, he said, are now both seeing “the mother of all bubbles.”

This can’t go on forever. Or for very long. But he couldn’t see the future either and pin down a date, which is what everyone wants to know so that they can all get out in time. “I cannot tell you when it will rumble,” he said, “but eventually it will rumble again.”

By “again” he meant the sort of thing that had taken the bank down last time, the Financial Crisis. It had been triggered by horrendous risk-taking, where risks hadn’t been priced into all kinds of securities. When those securities – mortgage-backed securities, for example, that were hiding the inherent risks under a triple-A rating – blew up, banks toppled.

What Vetter is telling us is what I have been warning about for a long time.

Another great stock market crash is coming.

It is just a matter of time.

7 Signs That A Stock Market Peak Is Happening Right Now

Stock Market Crash - Public DomainIs this the end of the last great run for the U.S. stock market?  Are we witnessing classic “peaking behavior” that is similar to what occurred just before other major stock market crashes?  Throughout 2014 and for the early stages of 2015, stocks have been on quite a tear.  Even though the overall U.S. economy continues to be deeply troubled, we have seen the Dow, the S&P 500 and the Nasdaq set record after record.  But no bull market lasts forever – particularly one that has no relation to economic reality whatsoever.  This false bubble of financial prosperity has been enjoyable, and even I wish that it could last much longer.  But there comes a time when we all must face reality, and the cold, hard facts are telling us that this party is about to end.  The following are 7 signs that a stock market peak is happening right now…

#1 Just before a stock market crash, price/earnings ratios tend to spike, and that is precisely what we are witnessing.  The following commentary and chart come from Lance Roberts

The chart below shows Dr. Robert Shiller’s cyclically adjusted P/E ratio. The problem is that current valuations only appear cheap when compared to the peak in 2000. In order to put valuations into perspective, I have capped P/E’s at 30x trailing earnings. The dashed orange line measures 23x earnings which has been the level where secular bull markets have previously ended. I have noted the peak valuations in periods that have exceeded that 30x earnings.

markets are cheap - StreetTalkLive

At 27.85x current earning the markets are currently at valuation levels where previous bull markets have ended rather than continued. Furthermore, the markets have exceeded the pre-financial crisis peak of 27.65x earnings. If earnings continue to deteriorate, market valuations could rise rapidly even if prices remain stagnant.

#2 The average bull market lasts for approximately 3.8 years. The current bull market has already lasted for six years.

#3 The median total gain during a bull market is 101.5 percent.  For this bull market, it has been 213 percent.

#4 Usually before a stock market crash we see a divergence between the relative strength index and the stock market itself.  This happened prior to the bursting of the dotcom bubble, it happened prior to the crash of 2008, and it is happening again right now

The first technical warning sign that we should heed is marked by a significant divergence between the relative strength index (RSI) and the market itself. This is noted by a declining pattern of lower highs in the RSI as stocks continue to make higher highs, a sign that the market is “topping out”. In the late ‘90s this divergence persisted for many years as the tech bubble reached epic valuation levels. In 2007 this divergence lasted over a much shorter period (6 months) before the market finally peaked and succumbed to massive selling. With last month’s strong rally to new records, we now have a confirmed divergence between the long-term relative strength index and the market’s price action.

#5 In the past, peaks in margin debt have been very closely associated with stock market peaks.  The following chart comes from Doug Short, and I included it in a previous article

Margin Debt

#6 As I have discussed previously, we usually witness a spike in 10 year Treasury yields just about the time that the stock market is peaking right before a crash.

Well, according to Business Insider, we just saw the largest 5 week rate rally in two decades…

Lots of guys and gals went home this past weekend thinking about the implications of the recent rise in the 10-year Treasury bond’s yield.

Chris Kimble notes it was the biggest 5-week rate rally in twenty years!

#7 A lot of momentum indicators seem to be telling us that we are rapidly approaching a turning point for stocks.  For example, James Stack, the editor of InvesTech Research, says that the Coppock Guide is warning us of “an impending bear market on the not-too-distant horizon”

A momentum indicator dubbed the Coppock Guide, which serves as “a barometer of the market’s emotional state,” has also peaked, Stack says. The indicator, which, “tracks the ebb and flow of equity markets from one psychological extreme to another,” is also flashing a warning flag.

The Coppock Guide’s chart pattern is flashing a “double top,”  which suggests that “psychological excesses are present” and that “secondary momentum has peaked” in this bull market, according to Stack.

“All of this is just another reason for concern about an impending bear market on the not-too-distant horizon,” Stack writes.

So if we are to see a stock market crash soon, when will it happen?

Well, the truth is that nobody knows for certain.

It could happen this week, or it could be six months from now.

In fact, a whole lot of people are starting to point to the second half of 2015 as a danger zone.  For example, just consider the words of David Morgan

“Momentum is one indicator and the money supply. Also, when I made my forecast, there is a big seasonality, and part of it is strict analytical detail and part of it is being in this market for 40 years. I got a pretty good idea of what is going on out there and the feedback I get. . . . I’m in Europe, I’m in Asia, I’m in South America, I’m in Mexico, I’m in Canada; and so, I get a global feel, if you will, for what people are really thinking and really dealing with. It’s like a barometer reading, and I feel there are more and more tensions all the time and less and less solutions. It’s a fundamental take on how fed up people are on a global basis. Based on that, it seems to me as I said in the January issue of the Morgan Report, September is going to be the point where people have had it.”

Time will tell if Morgan was right.

But without a doubt, lots of economic warning signs are starting to pop up.

One that is particularly troubling is the decline in new orders for consumer goods.  This is something that Charles Hugh-Smith pointed out in one of his recent articles…

The financial news is astonishingly rosy: record trade surpluses in China, positive surprises in Europe, the best run of new jobs added to the U.S. economy since the go-go 1990s, and the gift that keeps on giving to consumers everywhere, low oil prices.

So if everything is so fantastic, why are new orders cratering? New orders are a snapshot of future demand, as opposed to current retail sales or orders that have been delivered.

Posted below is a chart that he included with his recent article.  As you can see, the only time things have been worse in recent decades was during the depths of the last financial crisis…

Charles Hugh-Smith New Orders

To me, it very much appears that time is running out for this bubble of false prosperity that we have been living in.

But what do you think?  Please feel free to contribute to the discussion by posting a comment below…

Stock Market Bubble: Wall Street Is Ecstatic As The NASDAQ Closes Above 5000

Bubble In Hands - Public DomainAre we at the tail end of the stock market bubble to end all stock market bubbles?  Wall Street was full of glee Monday when the Nasdaq closed above 5000 for the first time since the peak of the dotcom bubble in March 2000.  And almost everyone in the financial world seems convinced that things are somehow “different” this time around.  Even though by almost every objective measure stocks are wildly overpriced right now, and even though there are a whole host of signs that economic trouble is on the horizon, the overwhelming consensus is that this bull market is just going to keep charging ahead.  But of course that is what they thought just before the last two stock market crashes in 2001 and 2008 as well.  No matter how many times history repeats, we never seem to learn from it.

Back in October 2002, the Nasdaq hit a post-dotcom bubble low of 1108.  From there, it went on an impressive run.  In late 2007, it briefly moved above 2800 before losing more than half of its value during the stock market crash of 2008.

So the fact that the Nasdaq has now closed above 5000 is a really big deal.  The following is how USA Today described what happened on Monday…

The Nasdaq Composite capped its long march back to 5000 Monday, eclipsing, then closing above the long-hallowed mark for the first time since March 2000.

The arduous climb came on the heels of a 10-day winning streak that ended last week, Nasdaq’s longest since July 2009. That helped fuel the technology-heavy market index to a 7% gain in February, the sixth-largest monthly climb since its 1971 launch.

The chart below shows how the Nasdaq has performed over the past decade.  As you can see, we are coming dangerously close to doubling the peak that was hit just before the last stock market collapse…

NASDAQ since 2005

By looking at that chart, you would be tempted to think that the overall U.S. economy must be doing great.

But of course that is not the case at all.

For example, just take a look at what has happened to the employment-population ratio over the past decade.  The percentage of the working age U.S. population that is currently employed is actually far lower than it used to be…

Employment Population Ratio Since 2005

So why is the stock market doing so well if the overall economy is not?

Well, the truth is that stocks have become completely divorced from economic reality at this point.  Wall Street has been transformed into a giant casino, and trading stocks has been transformed into a high stakes poker game.

And one of the ways that we can tell that a stock market bubble has formed is when people start borrowing massive amounts of money to invest in stocks.  As you can see from the commentary and chart from Doug Short below, margin debt is peaking again just like it did just prior to the last two stock market crashes…

Unfortunately, the NYSE margin debt data is a month old when it is published. Real (inflation-adjusted) debt hit its all-time high in February 2014, after which it margin declined sharply for two months, but by June it had risen to a level about two percent below its high and then oscillated in a relatively narrow range. The latest data point for January is four percent off its real high eleven month ago.

Margin Debt - Doug Short

So why can’t more people see this?

We are in the midst of a monumental stock market bubble and most on Wall Street seem willingly blind to it.

Fortunately, there are a few sober voices in the crowd.  One of them is John Hussman.  He is warning that now is the time to get out of stocks

Unless we observe a rather swift improvement in market internals and a further, material easing in credit spreads – neither which would relieve the present overvaluation of the market, but both which would defer our immediate concerns about downside risk – the present moment likely represents the best opportunity to reduce exposure to stock market risk that investors are likely to encounter in the coming 8 years.

Last week, the cyclically-adjusted P/E of the S&P 500 Index surpassed 27, versus a historical norm of just 15 prior to the late-1990’s market bubble. The S&P 500 price/revenue ratio surpassed 1.8, versus a pre-bubble norm of just 0.8. On a wide range of historically reliable measures (having a nearly 90% correlation with actual subsequent S&P 500 total returns), we estimate current valuations to be fully 118% above levels associated with historically normal subsequent returns in stocks. Advisory bullishness (Investors Intelligence) shot to 59.5%, compared with only 14.1% bears – one of the most lopsided sentiment extremes on record. The S&P 500 registered a record high after an advancing half-cycle since 2009 that is historically long-in-the-tooth and already exceeds the valuation peaks set at every cyclical extreme in history but 2000 on the S&P 500 (across all stocks, current median price/earnings, price/revenue and enterprise value/EBITDA multiples already exceed the 2000 extreme). Equally important, our measures of market internals and credit spreads, despite moderate improvement in recent weeks, continue to suggest a shift toward risk-aversion among investors. An environment of compressed risk premiums coupled with increasing risk-aversion is without question the most hostile set of features one can identify in the historical record.

Everyone knows that the stock market cannot stay detached from economic reality forever.

At some point the bubble is going to burst.

If you want to know what the real economy is like, just ask Alison Norris of Detroit, Michigan

When Alison Norris couldn’t find work in Detroit, she searched past city limits, ending up with a part-time restaurant job 20 miles away, which takes at least two hours to get to using public transportation.

Norris has to take two buses to her job at a suburban mall in Troy, Michigan, using separate city and suburban bus systems.

For many city residents with limited skills and education, Detroit is an employment desert, having lost tens of thousands of blue-collar jobs in manufacturing cutbacks and service jobs as the population dwindled.

Sadly, her story is not an anomaly.  I get emails from readers all the time that are out of work and just can’t seem to find a decent job no matter how hard they try.

It would be one thing if the stock market was soaring because the U.S. economy was thriving.

But we all know that is not true.

So that means the current stock market mania that we are witnessing is artificial.

How long will it last?

Give us your opinion by posting a comment below…