If History Is Any Indication, Junk Bonds And Copper Are Telling Us Exactly Where Stocks Are Heading Next

Stock Market - Public Domain
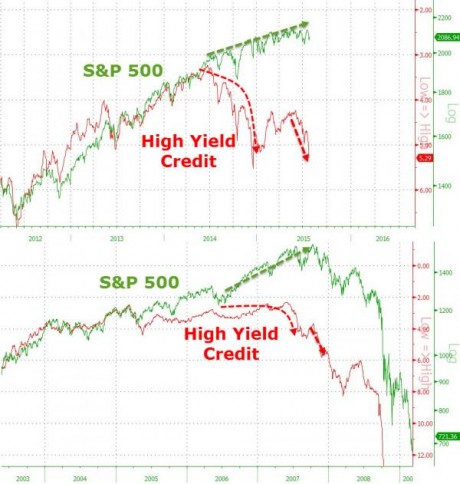
Yields on the riskiest junk bonds are absolutely soaring and the price of copper just hit a fresh six year low.  To most people, those pieces of financial news are meaningless.  But if you understand history, and you are aware of the patterns that immediately preceded previous stock market crashes, then you know how how huge both of those signs are.  During the summer of 2008, junk bond prices absolutely cratered as junk bond yields skyrocketed.  This was a very clear signal that financial markets were about to crash, and sure enough a couple of months later it happened.  Now the exact same thing is happening again.  The following comes from a Wall Street On Parade article that was posted on Tuesday entitled “Keep Your Eye on Junk Bonds: They’re Starting to Behave Like ‘08“…

According to data from Bloomberg, corporations have issued a stunning $9.3 trillion in bonds since the beginning of 2009. The major beneficiary of this debt binge has been the stock market rather than investment in modernizing the plant, equipment or new hires to make the company more competitive for the future. Bond proceeds frequently ended up buying back shares or boosting dividends, thus elevating the stock market on the back of heavier debt levels on corporate balance sheets.

Now, with commodity prices resuming their plunge and currency wars spreading, concerns of financial contagion are back in the markets and spreads on corporate bonds versus safer, more liquid instruments like U.S. Treasury notes, are widening in a fashion similar to the warning signs heading into the 2008 crash. The $2.2 trillion junk bond market (high-yield) as well as the investment grade market have seen spreads widen as outflows from Exchange Traded Funds (ETFs) and bond funds pick up steam.

And right now we are seeing the most volatility in the junkiest of the junk bonds.

The following comes from Wolf Richter, and my jaw just about dropped to the floor when I first saw this…

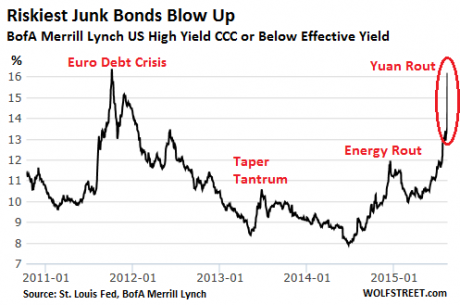
This chart of yields at the riskiest end of the junk bond market – bonds rated CCC and below – shows what happened. These bonds have been selling off over the past 12 months, with exception of the sucker rally earlier this year, and their yields more than doubled from less than 7.9% in June a year ago to 16.2% by Thursday evening. And Thursday was a massacre:

riskiest junk bonds

On Thursday, yields jumped 2.6 percentage points, from 13.58% to 16.18%, as these junk bonds plunged. Those kinds of single-day vertigo-inducing sell-offs are rare in normal times, and there haven’t been any since the Financial Crisis.

Amazingly, the Federal Reserve is actually thinking about raising interest rates in this environment.

If that sounds like a really bad idea to you, that is because it is a really bad idea.

Raising interest rates would just add fuel to the fire of this junk bond rout.  DoubleLine Capital’s co-founder Jeffrey Gundlach agrees with me

To raise interest rates when junk bonds are nearly at a four-year low is a bad idea,” Gundlach said in a telephone interview.

Gundlach, widely followed for his prescient investment calls, said if the Fed begins raising interest rates in September, “it opens the lid on Pandora’s Box of a tightening cycle.”

Gundlach said the selling pressure in copper and commodity prices driven by worries over China’s growth outlook “should be a huge concern. It is the second-biggest economy in the world.”

Meanwhile, as Gundlach mentioned, the price of copper continues to plunge.

On Tuesday, it set a brand new six year low.  It is now the lowest that it has been since the days of the last financial crisis.

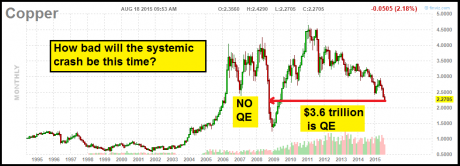
And as you can see from this excerpt from a recent Investment Research Dynamics article, the price of copper started crashing before the stock market crash of 2008…

I wanted to keep this simple and just look at what is considered perhaps the best barometer of global economic activity:

Copper Chart - Investment Research Dynamics

You’ll note that the price of copper is headed lower and is back to the price level where it was in the middle of 2008, right before the great financial collapse.  You’ll note that $3.6 trillion in Federal Reserve money printing – on top of trillions in Bank of Japan, ECB and People’s Bank of China money printing – has not been able to keep the price of copper from crashing again.

In case you haven’t figured it out by now, the global financial system is in real trouble.

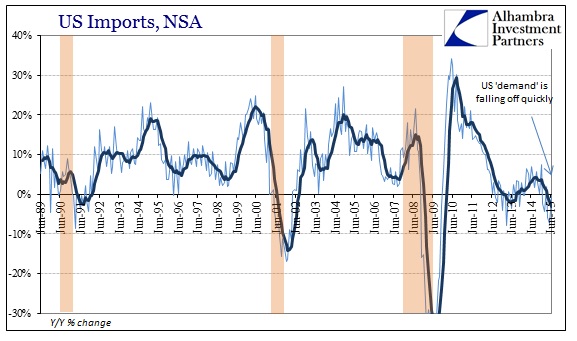
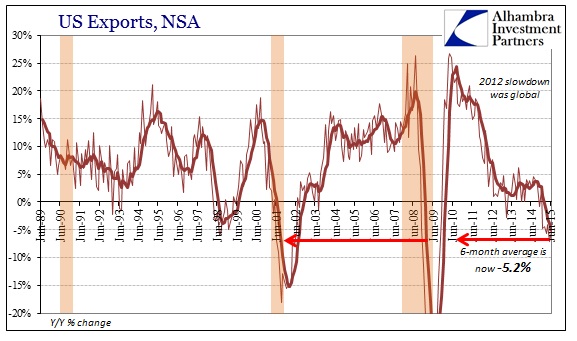
Another sign that rough waters are ahead is the fact that global shipping has fallen into a dramatic slump.  The following comes from the Telegraph

World shipping has fallen into a deep slump over the late summer, dashing hopes of a quick recovery from the global trade recession earlier this year and heightening fears that the six-year economic expansion may be on its last legs.

Freight rates for container shipping from Asia to Europe fell by over 20pc in the second week of August, even though trade volumes should be picking up at this time of the year. The Shanghai Containerized Freight Index (SCFI) for routes to north European ports crashed by 23pc in five trading days.

Global economic activity is clearly slowing down, and there are 23 nations around the planet that are already experiencing stock market crashes.

The financial markets of the western world have not totally crashed just yet, but they are more leveraged and more vulnerable than ever.  The following comes from Zero Hedge

  • The REAL problem for the financial system is the bond bubble. In 2008 when the crisis hit it was $80 trillion. It has since grown to over $100 trillion.
  • The derivatives market that uses this bond bubble as collateral is over $555 trillion in size.
  • Many of the large multinational corporations, sovereign governments, and even municipalities have used derivatives to fake earnings and hide debt. NO ONE knows to what degree this has been the case, but given that 20% of corporate CFOs have admitted to faking earnings in the past, it’s likely a significant amount.
  • Corporations today are more leveraged than they were in 2007. As Stanley Druckenmiller noted recently, in 2007 corporate bonds were $3.5 trillion… today they are $7 trillion: an amount equal to nearly 50% of US GDP.
  • The Central Banks are now all leveraged at levels greater than or equal to where Lehman Brothers was when it imploded. The Fed is leveraged at 78 to 1. The ECB is leveraged at over 26 to 1. Lehman Brothers was leveraged at 30 to 1.
  • The Central Banks have no idea how to exit their strategies. Fed minutes released from 2009 show Janet Yellen was worried about how to exit when the Fed’s balance sheet was $1.3 trillion (back in 2009). Today it’s over $4.5 trillion.

As I explained during a recent interview with Kate Dalley of Fox News radio, what is coming should be obvious to anyone that is willing to look at the numbers honestly.

The global financial system is going to crash.

Yes, this crisis is going to take years to fully play out, but by the time it is all said and done it is going to be much worse than what we experienced back in 2008 and 2009.

So buckle up tight and hold on for your life, because we are in for one wild ride.

The Dow Has Already Fallen Nearly 900 Points From The Peak Of The Market

Financial Crisis Stocks - Public DomainIn an eerie repeat of what we witnessed in 2008, U.S. stocks are steadily sliding throughout the summer as we head toward the month of September.  From August 1st, 2008 to September 1st, 2008 the Dow fell by nearly 700 points.  And of course we all remember what happened the following month.  Right now, we are watching a similar thing happen.  The Dow has plummeted nearly 700 points since July 16th, and it is down nearly 900 points from the peak of the market back in May.  At this point the Dow has now fallen for six days in a row and eleven of the last thirteen.  Of course most of the talking heads on television are still insisting that everything is going to be just fine and that a repeat of 2008 is not possible.  So what do you think?  Should we trust them?

Personally, I find that I put a lot more faith in cold, hard numbers than in what the talking heads on television have to say.  And at this moment, the cold, hard numbers are telling us that another financial crisis in imminent.

This is one of the reasons why I am such a fan of Zero Hedge.  Nobody stays on top of the hard financial numbers like Zero Hedge does.  And according to Zero Hedge, market internals are absolutely screaming that a U.S. stock market crash is right around the corner

In early 2007, market internals began to weaken dramatically. Talking heads and asset gatherers said fears were overblown, risk was contained, Fed has it under control, stay the course. Six months later, the equity markets began to collapse and then accelerated lower. Today, in an eery case of deja vu all over again, it has been six months now since US equity market internals began to decouple from the manipulated index levels that manufacture wealth and happiness across America… what would you do?

Here is the chart that immediately followed that paragraph.  As you can see, we are repeating the exact same pattern that we witnessed back during the last financial crisis…

Internals - Zero Hedge chart

Meanwhile, the second largest stock market in the world is already crashing.  The Chinese have spent approximately 1.3 trillion dollars propping up stocks in China, but they just continue to fall.  They were down again on Wednesday night, and nobody is quite sure when the carnage is going to end.

And remember, Chinese stocks started to crash before U.S. stocks did in 2008 as well.

Another eerie similarity to 2008 is the behavior of oil.  In the summer of 2008, the price of oil crashed hard, and then a stock crash followed a couple of months later.

Well, guess what?

The price of oil is crashing hard once again.  The following comes from CNBC

Oil set multi-month lows on Thursday as investors and traders sought clues about the market’s next bottom after a large drop in U.S. crude inventories failed to boost prices.

A bigger-than-expected build in U.S. gasoline stockpiles last week proved more important to investors than crude storage numbers that came in three times below forecast on Wednesday.

U.S. crude was down 50 cents at $44.65 a barrel at 1:30 p.m. EDT (1730 GMT), after touching a 4½ month bottom at $44.20.

Why can’t more people see the signs?

They are so obvious.

We are also getting indications that the real economy is starting to be affected by all of this chaos.  The mainstream media has been very quiet about this, but the number of job cuts just hit a four year high

Challenger, Gray & Christmas has released its monthly job cuts for July, and it is ugly. The 105,696 job cuts was the highest number since 2011. To put this in perspective, the July job cuts total is a whopping 136% higher than the 44,842 job cuts reported in June, as well as 125% higher than the in same report a year ago.

The July report showed that the last time more than 100,000 job cuts were announced was back in September 2011, when there were some 115,730 layoffs.

Another bad trend is that July’s surge now brings the year-to-date job cuts up to a total of 393,368. That is 34% higher than the run rate for the same period in 2014.

If alarm bells are going off in your head right now, that is good, because they should be.

A 34 percent increase in job cuts is not a good thing.

Of course it would probably help if the Obama administration was not bringing in far more immigrant workers than the limits that have been officially set by Congress.  Just check out these numbers

In written responses to the Senate Judiciary Immigration and the National Interest Subcommittee Republicans obtained by Breitbart News, U.S. Citizenship and Immigration Services reveal that the Obama administration has been approving work authorizations for immigrants beyond admission limits and for some categories of immigrants that Congress never intended to work in the U.S.

Beyond those limits each year, these new and renewed work permit approvals amounted to about 1.23 million in fiscal year 2009, 1.08 million in FY 2010, 970,277 in FY 2011, 1.24 million in FY 2012, 1.68 million in FY 2013 and 1.24 million in FY 2014.

Also, this is the first time that imports and exports have both been declining on a year over year basis since the last recession.  Just check out this chart and this chart.

When imports and exports are both falling, that means that economic activity is slowing down.  And we are seeing a similar thing happen all over the planet.  At this point, global trade has fallen by a total of about 2 percent over the past six months.

Are you starting to get the picture?

Just like in the summer of 2008, global economic activity is diminishing and things in the financial world are lining up in textbook fashion for a major crisis.

But for those that are not convinced by now, there is not that much more that I can do.  I could keep throwing out numbers and charts and graphs, but if people refuse to see the truth they simply will not see it.

Less than a month from now, we will officially be in the danger zone.

September is coming, and I truly hope that you are already prepared for it.

8 Financial Experts That Are Warning That A Great Financial Crisis Is Imminent

Earth Clock Pocketwatch - Public DomainWill there be a financial collapse in the United States before the end of 2015?  An increasing number of respected financial experts are now warning that we are right on the verge of another great economic crisis.  Of course that doesn’t mean that it will happen.  Experts have been wrong before.  But without a doubt, red flags are popping up all over the place and things are lining up in textbook fashion for a new financial crisis.  As I write this article, U.S. stocks have declined four days in a row, the Dow is down more than 750 points from the peak of the market in May, and one out of every five U.S. stocks is already in a bear market.  I fully expect the next several months to be extremely chaotic, and I am far from alone.  The following are 8 financial experts that are warning that a great financial crisis is imminent…

#1 During one recent interview, Doug Casey stated that we are heading for “a catastrophe of historic proportions”

“With these stupid governments printing trillions and trillions of new currency units,” says investor Doug Casey, “it’s building up to a catastrophe of historic proportions.”

Doug Casey, a wildly successful investor who’s the head of the outfit Casey Research, is predicting doom and gloom for the global economy.

“I wouldn’t keep significant capital in banks,” he told Reason magazine Editor-in-Chief Matt Welch. “Most of the banks in the world are bankrupt.”

#2 Bill Fleckenstein is warning that U.S. markets could be headed for calamity in the coming months

Noted short seller Bill Fleckenstein, who correctly predicted the financial crisis in 2007, says he is one step closer to opening up a short-focused fund for the first time since 2009. In the meantime, Fleckenstein says the entire market could be heading for calamity in the coming months.

The market is uniquely crash-prone,” Fleckenstein told CNBC’s “Fast Money” this week. “I think the market is very brittle because of high-frequency trading, ETFs, a lot of momentum investors. I don’t think there’s going to be any painless back door.”

#3 Richard Russell believes that the bear market that is coming “will tear apart the current economic system”

From my standpoint, this is the strangest period that I have gone through since the 1940s. The Industrials are declining faster than the Transports. If this continues, at some point the Industrials will touch the Transports. When that happens, I believe a bear market will be signaled, as both Industrials and Transports accelerate on the downside.

I expect a brief period of higher prices which will draw in the amateurish retail public. This brief breather will be followed by an historic bear market that will tear apart the current economic system.

#4 Larry Edelson is “100% confident” that a global financial crisis will be triggered “within the next few months”…

On October 7, 2015, the first economic supercycle since 1929 will trigger a global financial crisis of epic proportions. It will bring Europe, Japan and the United States to their knees, sending nearly one billion human beings on a roller-coaster ride through hell for the next five years. A ride like no generation has ever seen. I am 100% confident it will hit within the next few months.”

#5 John Hussman is warning that market conditions such as we are observing right now have only happened at a few key moments throughout our history

In any event, this is no time to be on autopilot. Look at the data, and you’ll realize that our present concerns are not hyperbole or exaggeration. We simply have not observed the market conditions we observe today except in a handful of instances in market history, and they have typically ended quite badly (see When You Look Back on This Moment in History and All Their Eggs in Janet’s Basket for a more extended discussion of current conditions). In my view, this is one of the most important moments in a generation to examine all of your risk exposures, the extent to which you believe historical evidence is informative, your tolerance for loss, your comfort or discomfort with missing out on potential rallies even in a wickedly overvalued market, and your true investment horizon.

#6 During a recent appearance on CNBC, Marc Faber suggested that U.S. stocks could soon plummet by up to 40 percent

The U.S. stock market could “easily” drop 20 percent to 40 percent, closely followed contrarian Marc Faber said Wednesday—citing a host of factors including the growing list of companies trading below their 200-day moving average.

In recent days, “there were [also] more declining than advancing stocks, and the list of 12-month new lows was very high on Friday,” the publisher of The Gloom, Boom & Doom Report told CNBC’s “Squawk Box.”

“It shows you a lot of stocks are already declining.”

#7 In a previous article, I noted that Henry Blodget of Business Insider is suggesting that U.S. stocks could soon drop by up to 50 percent

As regular readers know, for the past ~21 months I have been worrying out loud about US stock prices. Specifically, I have suggested that a decline of 30% to 50% would not be a surprise.

I haven’t predicted a crash. But I have said clearly that I think stocks will deliver returns that are way below average for the next seven to 10 years. And I certainly won’t be surprised to see stocks crash. So don’t say no one warned you!

#8 Egon von Greyerz is even more bearish.  He recently told King World News that we are heading for “the most historic wealth destruction ever”…

Eric, there are now more problem areas in the world, rather than stable situations. No major nation in the West can repay its debts. The same is true for Japan and most of the emerging markets. Europe is a failed experiment for socialism and deficit spending. China is a massive bubble, in terms of its stock markets, property markets and shadow banking system. Japan is also a basket case and the U.S. is the most indebted country in the world and has lived above its means for over 50 years.

So we will see twin $200 trillion debt and $1.5 quadrillion derivatives implosions. That will lead to the most historic wealth destruction ever in global stock, with bond and property markets declining at least 75 – 95 percent. World trade will also contract dramatically and we will see massive hardship across the globe.

So are they right?

We’ll know soon.

And of course they are not the only ones with a bad feeling about what is ahead.  A recent WSJ/NBC News survey found that 65 percent of all Americans believe that the country is currently on the wrong track.

Also, Gallup’s Economic Confidence Index just plunged to the lowest level that we have seen so far in 2015

Americans confidence in the US economy dropped sharply in July to its lowest level in 2015, according to a new US Economic Confidence Index rating released by Gallup on Tuesday.

“Gallup’s Economic Confidence Index declined to an average of —12 in July from —8 in June. This is the lowest monthly average since last October, and is a noticeable departure from the +3 average in January,” the polling company said.

Gallup said that “unsettled economic” conditions, including tumult in Chinese markets and uncertainty in Europe over a Greek debt deal, as well as US stock market volatility are factors driving lower confidence in the US economy.

These “bad feelings” are also reflected in the hard economic data.  U.S. consumer spending has declined for three months in a row, and U.S. factory orders have fallen for eight months in a row.

The numbers are screaming that we are heading for another major recession.

But could it be possible that this is just another false alarm?

Could it be possible that the blind optimists are right and that everything will work out okay somehow?

Please feel free to join the discussion by posting a comment below…

Crashing: Apple, Twitter, Oil, Commodities, Greek Stocks, Chinese Stocks

Crash - Public DomainThe month of August sure has started off with a bang.  Tech stocks are crashing, oil is crashing, industrial commodities are crashing, Greek stocks crashed the moment that the Greek stock market reopened for trading, and Chinese stocks continue to crash.  At this point we have not seen a broad crash of U.S. stocks yet, but it is important to note that the Dow is already down more than 700 points from the peak in May.  If it continues to slide like it has in recent days, it won’t be too long before we will officially reach “correction” territory.  Just a few days ago, I described August as a “pivotal month“, and so far that is indeed turning out to be the case.

A full-blown financial crisis has not erupted yet, but we are well on the way.  In this article, I want to look at a few of the “crashes” that are already happening…

Apple

This is more of a “correction” than a “crash”, but it is very noteworthy because it is happening to one of the most important U.S. stocks of all.  The price of Apple stock has already broken through the 200 day moving average, and at this point it is down nearly 11 percent from the peak

Shares of Apple are down 10.9% from their highest point in a year — which places the stock squarely in what’s considered to be a correction. The unofficial definition of a correction is a 10% or greater drop from a recent high. Shares of Apple hit a 52-week (and all-time) high on $134.54 on April 28.

Twitter

If you want to see a real crash, just look at what is happening to Twitter.  The stock was down close to 6 percent on Monday, and overall it has fallen 58 percent since early last year.  The price of Twitter stock has never been lower than it is right now, and many investors are very apprehensive about what comes next…

Twitter shares hit a record low on Monday, closing down nearly 6% to $29.27.

That is 58% below their peak in January 2014.

Shares have fallen to their lowest point since the company went public in November 2014 weighed down by negative comments on growth from company executives that rattled investors. Its previous low was $30.50 in May 2014 as concerns over slowing user growth began to take a toll.

Of course there are tech companies that are in far worse shape than Twitter.  For example, just consider what is happening to Yelp.  Shares of Yelp recently plummeted 25 percent in a single day, and they are down about 70 percent over the past year.

Greece

The Greek government was quite eager to reopen their stock market this week.

Perhaps they should have waited longer.

On Monday, we witnessed the greatest stock bloodbath in Greek history.  The following comes from Reuters

Greece’s stock market closed with heavy losses on Monday after a five-week shutdown brought on by fears that the country was about to be dumped from the euro zone.

Bank shares plummeted 30 percent before loss limits kicked in to stop investors selling any more. The main Athens stock index .ATG ended down 16.2 percent, recovering slightly after plunging nearly 23 percent at the open.

It was the worst daily performance since at least 1985 when modern records began, including a 15 percent fall when Wall Street crashed in 1987.

Puerto Rico

Things also continue to unravel for “America’s Greece”.  On Monday, a U.S. commonwealth territory defaulted on debt for the first time ever

Puerto Rico’s Government Development Bank announced Monday that it was only able to make a partial payment on its Public Finance Corporation (PFC) debt service due over the weekend.

In response to the non-payment of the full service, Moody’s said it viewed the situation as a default.

“Due to the lack of appropriated funds for this fiscal year the entirety of the PFC payment was not made today (the first business day after the Saturday deadline),” GDB President Melba Acosta-Febo said in a statement. This was a decision that reflects the serious concerns about the Commonwealth’s liquidity in combination with the balance of obligations to our creditors and the equally important obligations to the people of Puerto Rico to ensure the essential services they deserve are maintained.”

China

As I noted the other day, the Shanghai Composite Index declined 13.4 percent during the month of July.  It was the worst month for stocks in China since October 2009.

On Monday, Chinese stocks were down another 1.11 percent.  Since closing at 5,166.35 on June 12th, the Shanghai Composite Index has fallen precipitously.  As I write this, it is sitting at just 3622.86.

Oil

In the months prior to the financial crisis of 2008, the price of oil crashed hard.

Now it is happening again.

In July, the price of oil plunged 21 percent.  That was the worst monthly decline that we have seen since October 2008.

And on Monday, the oil crash continued.  The following comes from Business Insider

On Monday in New York, West Texas Intermediate (WTI) crude fell more than 4% and slipped below $45 per barrel, a level it hasn’t touched since March.

Brent crude oil, the international benchmark that joined WTI in a bear market last week, dropped more than 4%, below $50 per barrel for the first time since January.

Commodities

In recent weeks, I have been writing over and over about industrial commodities.  This is yet another striking similarity to the last financial crisis.  In 2008, they started crashing before stocks did, and now it is happening again

We see the Bloomberg Commodities index now at a 13-year low. Copper is down 28 percent for the year, tin is down 30 percent, and nickel is down 44 percent.

This is a giant red flag that indicates that we are plunging into a deflationary cycle.  When global economic activity slows down, so does demand for industrial commodities.  I don’t understand why more people can’t see this.

I have been warning that a deflationary downturn was coming for a very long time, and so have others.  For instance, just consider the following excerpt from a recent article by Nicole Foss

Our consistent theme here at the Automatic Earth since its inception has been that we are facing a very powerful deflationary depression, following on from the bursting of an epic financial bubble. What we have witnessed in our three decades of expansion and inflation is nothing short of a monetary supernova, and that period has been the just culmination of a much larger upward trend going back many decades at least. We have lived through a credit hyper-expansion for the record books, with an unprecedented generation of excess claims to underlying real wealth. In doing so we have created the largest financial departure from reality in human history.

Bubbles are not new – humanity has experienced them periodically going all the way back to antiquity – but the novel aspect of this one, apart from its scale, is its occurrence at a point when we have reached or are reaching so many limits on a global scale. The retrenchment we are about to experience as this bubble bursts is also set to be unprecedented, given that the scale of a bust is predictably proportionate to the scale of the excesses during the boom that precedes it. We have built an incredibly complex economic system, but despite its robust appearance it is over-extended, brittle and fragile after decades of fueling its continued expansion by feeding on its own substance.

Things continue to line up in textbook fashion for a major financial crisis during the fall and winter.

I hope that you are prepared for what comes next.

11 Red Flag Events That Just Happened As We Enter The Pivotal Month Of August 2015

Red Flags - Public DomainAre you ready for what is coming in August?  All over America, economic, political and social tensions are building, and the next 30 days could turn out to be pivotal.  In July, we saw things start to turn.  As you will read about below, a major six year trendline for the S&P 500 was finally broken this month, Chinese stocks crashed, commodities crashed, and debt problems started erupting all over the planet.  I fully expect that this next month (August) will be a month of transition as we enter an extremely chaotic time in the fall and winter.  Things are unfolding in textbook fashion for another major global financial crisis in the months ahead, and yet most people refuse to see what is happening.  In their blind optimism, they want to believe that things will somehow be different this time.  Well, the coming months will definitely reveal who was right and who was wrong.  The following are 11 red flag events that just happened as we enter the pivotal month of August 2015…

#1 Puerto Rico is going to default on a 58 million dollar debt payment that is due on Saturday.  Even though this has serious implications for the U.S. financial system, Barack Obama has said that there will be no bailout for “America’s Greece”.

#2 As James Bailey has pointed out, the most important trendline for the S&P 500 has finally been broken after holding up for six years.  This is a critical technical signal that will likely motivate a significant number of investors to sell off their holdings in the weeks ahead.

#3 The IMF is indicating that it will not take part in the new Greek debt deal.  As a result, the whole thing may completely fall apart

Leaked minutes of the fund’s latest board meeting, which took place on Wednesday, showed staff “cannot reach agreement at this stage” on whether to take part in the new €86bn (£60bn) bailout for Greece. The document said there were doubts over the capacity of the Athens Government to implement economic reforms, as well as the over the sustainability of the country’s sovereign debt pile, which is now projected to hit 200 percent of GDP.

The German Chancellor, Angela Merkel, only sanctioned a new Greek deal earlier this month on the condition that the IMF takes part.

#4 Italy is going down the exact same path as Greece, but Italy is going to be a much larger problem for Europe because it has a far, far larger economy.  This week, we learned that youth unemployment in Italy has reached a 38-year high of 44 percent, and Italy’s debt to GDP ratio has now hit 135 percent.

#5 The Canadian economy has officially entered a new recession.  This is something that was not supposed to happen.

#6 The price of oil plummeted close to 20 percent during the month of July.  It was the worst month for the price of oil that we have seen since October 2008, which just happened to be during the height of the last financial crisis.

#7 Commodities just had their worst month in almost four years.  As I have written about previously, we witnessed a collapse in commodity prices just before the stock market crash of 2008 too.

#8 Thanks to Barack Obama, the U.S. coal industry is imploding, and some of the largest coal producers in the entire country have just announced that they are declaring bankruptcy

On Thursday, Bloomberg reported that the biggest American producer of coking coal, Alpha Natural Resources, could file for bankruptcy as soon as Monday.

Competitor Walter Energy filed for bankruptcy earlier this month, and several others have done the same this year.

#9 For the month of July, the Shanghai Composite Index was down 13.4 percent.  Despite unprecedented government intervention to prop up the market, it was the worst month for Chinese stocks since October 2009.

#10 A major red flag that a recession in the United States is fast approaching is the fact that Exxon Mobile just announced their worst earnings for a single quarter since 2009.  Compared to the same time period one year ago, Exxon Mobile’s earnings were down 51 percent.

#11 Chevron is another oil giant that has seen earnings plunge.  In the second quarter of this year, Chevron’s earnings were down an eye-popping 90 percent from a year ago.

And in this list I didn’t even mention the economic chaos that is happening down in South America.  For full coverage of that, please see my previous article entitled “The South American Financial Crisis Of 2015“.

To a certain extent, I can understand why most Americans are not alarmed about the months ahead.  The relative stability of the past several years has lulled most of us into a false sense of security, and the mainstream media is assuring everyone that everything is going to be just fine and that brighter days are ahead.  At this point, many believe that it is patently absurd to suggest that we could see an economic collapse in 2015.  But of course even though the signs were glaringly apparent, very few of us anticipated the financial crisis of 2008 either.

A few weeks ago, I authored a piece entitled “The Last Days Of ‘Normal Life’ In America“, and I stand by every single word of that article.  I truly believe that the era of debt-fueled prosperity that we have been enjoying for so long is coming to an end, and our standard of living will never again get back to this level.

Just yesterday, I had the chance to go over and stock up on some emergency supplies at a dollar store.  It always astounds me what you can still buy for a dollar.  The combined cost of raw materials, manufacturing, packaging, shipping and retailing most of these items shouldn’t be less than a dollar, but thanks to having the reserve currency of the world we are still able to go to these big box stores and fill up our carts with lots and lots of extremely inexpensive merchandise.

Unfortunately, this massively inflated standard of living is going to come crashing to a halt.  This next financial crisis is going to destroy the system that is currently producing such comfortable lifestyles for the vast majority of us, and that will be an extremely painful experience.

So enjoy this summer for as long as it lasts.  Even though August threatens to be pivotal, it is going to be nothing compared to what will follow.

Fall and winter are coming.

Prepare while there is still time to do so.

An Expert That Correctly Called The Last Two Stock Market Crashes Is Now Predicting Another One

Hussman ChartWhat I am about to share with you is quite stunning.  A well-respected financial expert that correctly predicted the last two stock market crashes is now warning that we are right on the verge of the next one.  John Hussman is a former professor of economics and international finance at the University of Michigan, and the information in his latest weekly market comment is staggering.  Since 1970, there have only been a handful of times when a combination of market signals that Hussman uses have indicated that a major market peak has been reached.  In 1972, 2000 and 2007 each of those peaks was followed by a dramatic stock market crash.  Now, for the first time since the last financial crisis, all four of those signals appeared once again during the week of July 17th.  If Hussman’s analysis is correct, this could very well mean that the next great stock market crash in the United States is imminent.

It was an excellent article by Jim Quinn of the Burning Platform that first alerted me to Hussman’s latest warning.  If you don’t follow Quinn’s work already, you should, because it is excellent.

When someone is repeatedly correct about the financial markets, we should all start paying attention.  Back in late 2007, Hussman warned us about what was coming in 2008, but most people did not listen.

Now he is sounding the alarm again.  According to Hussman, when there is a confluence of four key market indicators, that tells us that the market has peaked and is in danger of crashing.  The following comes from Newsmax

He cited the metric among the indicators that foreshadowed declines after peaks in 1972, 2000 and 2007:

*Less than 27 percent of investment advisers polled by Investors Intelligence who say they are bearish.

*Valuations measured by the Shiller price-to-earnings ratio are greater than 18 times.

*Less than 60 percent of S&P 500 stocks above their 200-day moving averages.

*Record high on a weekly closing basis.

The most recent warning was the week ended July 17, 2015,” Hussman said. “It’s often said that they don’t ring a bell at the top, and that’s true in many cycles. But it’s interesting that the same ‘ding’ has been heard at the most extreme peaks among them.”

It is quite rare for the market to set a new record high on a weekly closing basis and have more than 40 percent of stocks below their 200-day moving averages at the same time.  That is why a confluence of all these factors is fairly uncommon.  Hussman elaborated on this in his recent report

The remaining signals (record high on a weekly closing basis, fewer than 27% bears, Shiller P/E greater than 18, fewer than 60% of S&P 500 stocks above their 200-day average), are shown below. What’s interesting about these warnings is how closely they identified the precise market peak of each cycle. Internal divergences have to be fairly extensive for the S&P 500 to register a fresh overvalued, overbullish new high with more than 40% of its component stocks already falling – it’s evidently a rare indication of a last hurrah. The 1972 warning occurred on November 17, 1972, only 7 weeks and less than 4% from the final high before the market lost half its value. The 2000 warning occurred the week of March 24, 2000, marking the exact weekly high of that bull run. The 2007 instance spanned two consecutive weekly closing highs: October 5 and October 12. The final daily high of the S&P 500 was October 9 – right in between. The most recent warning was the week ended July 17, 2015.

The following is the chart that immediately followed the paragraph in his report that you just read…

Hussman Chart

When I first took a look at that chart I could hardly believe it.

It appears that Hussman’s signals are able to indicate major stock market crashes with stunning precision.

And considering the fact that we just hit a new “ding” for the first time since the last financial crisis, what Hussman is saying is more than just a little bit ominous.

According to Hussman this is not just a recent phenomenon either.  Even though advisory sentiment figures were not available back in 1929, he believes that his indicators would have given a signal that a market crash was imminent in August of that year as well

Though advisory sentiment figures aren’t available prior to the mid-1960’s, imputed data suggest that additional instances likely include the two consecutive weeks of August 19, 1929 and August 26, 1929. We can infer unfavorable market internals in that instance because we know that cumulative NYSE breadth was declining for months before the 1929 high. The week of the exact market peak would also be included except that stocks closed down that week after registering a final high on September 3, 1929. Another likely instance, based on imputed sentiment data, is the week of November 10, 1961, which was immediately followed by a market swoon into June 1962.

Of course the past is the past, and what has happened in the past will not necessarily happen in the future.

So is Hussman wrong this time?  With all of the other things that are happening in the financial world right now, I certainly would not bet against him.

Other financial professionals are concerned that a market crash could be imminent as well.  The following comes from a piece authored by Andrew Adams

More than 13% of stocks on the New York Stock Exchange are at 52-week lows, which is about 6 standard deviations above the average over the last three years (1.62%) and an extreme only seen one other time during said period (last October when the S&P 500 was percentage points away from a 10% correction).

This dichotomy has created what I believe to be the biggest question about the stock market right now – have we already experienced a stealth correction in the majority of stocks that will soon come to an end or will the market leaders finally succumb to the weight of the laggards and join in on the sell-off? The answer to this could end up being worth at least $2.2 trillion, which is how much money would essentially be wiped out of the stock market if we finally get the much-discussed 10% correction in the overall market (the total U.S. stock market capitalization was $22.5 trillion as of June 30, according to the Center for Research in Security Prices).

Sometimes, a picture is worth more than a thousand words.  I could share many more quotes from the “experts” about why they are concerned about a potential stock market collapse, but instead I want to share with you a “bonus chart” that Zero Hedge posted on Tuesday

Bonus Chart - Zero Hedge

Do you understand what that is saying?

In 2007 and 2008, junk bonds started crashing well before stocks did.

Now, we are witnessing a similar divergence.  If a similar pattern holds up this time, stocks have a long, long way to fall.

Like Hussman and so many others, I believe that a stock market crash and a new financial crisis are imminent.

The month of August is usually a slow month in the financial world, so hopefully we can get through it without too much chaos.  But once we roll into the months of September and October we will officially be in “the danger zone”.

Keep an eye on China, keep an eye on Europe, and keep listening for serious trouble at “too big to fail” banks all over the planet.

The next several months are going to be extremely significant, and we all need to be getting ready while we still can.

Now Is The Time – Fear Rises As Financial Markets All Over The Planet Start To Crash

Fear - Public DomainCan you feel the panic in the air?  CNN Money’s Fear & Greed Index measures the amount of fear in the financial world on a scale from 0 to 100.  The closer it is to zero, the higher the level of fear.  Last Monday, the index was sitting at a reading of 36.  As I write this article, it has fallen to 7.  The financial turmoil which began last week is threatening to turn into an avalanche. On Sunday night, we witnessed the second largest one day stock market collapse in China ever, and this pushed stocks all over the planet into the red.  Meanwhile, the twin blades of an emerging market currency crisis and a commodity price crash are chewing up economies that are dependent on the export of natural resources all over the globe.  For a long time, I have been warning about what would happen in the second half of 2015, and now it is here.  The following is a summary of the financial carnage that we have seen over the past 24 hours…

-On Sunday night, the Shanghai Composite Index plunged 8.5 percent.  It was the largest one day stock market crash in China since 2007, and it was the second largest in history.  The Chinese government is promising to directly intervene in order to prevent Chinese stocks from going down even more.

-Over 1,500 stocks in China fell by their 10 percent daily maximum.  This list includes giants such as China Unicom, Bank of Communications and PetroChina.

-Ever since peaking in June, the Shanghai Composite Index has dropped by a total of 28 percent.

-Even Chinese stocks that are listed on U.S. stock exchanges are being absolutely hammered.  The following comes from USA Today

The 144 China-based stocks with primary listings on major U.S. exchanges have erased nearly $40 billion in paper wealth since the Shanghai Composite index peaked on June 12. It’s an enormous destruction of wealth that in effects wipes out the market value of a company the size of cruise ship operator Carnival.

-The Chinese stock market crash pushed European stocks significantly lower on Monday…

The pan-European FTSEurofirst 300 provisionally closed 2.1 percent lower, while the Germany’s DAX and France’s CAC closed respectively 2.4 percent and 2.5 percent lower.

The U.K.’s benchmark FTSE outperformed its euro zone peers, but still closed unofficially down 1.0 percent.

-Overall, European stocks have been falling steadily since the beginning of last week.  To get an idea of how much damage has been done already, just check out this chart.

-As I mentioned above, an emerging market currency crisis is causing havoc for economies all over the planet.  The following comes from an article that was published by the Telegraph

The currencies of Brazil, Mexico, South Africa and Turkey have all crashed to multi-year lows as investors flee emerging markets and commodity prices crumble.

The drastic moves came as fears of imminent monetary tightening by the US Federal Reserve combined with shockingly weak figures from China, which stoked fears that the country may be sliding into a deeper downturn and sent tremors through East Asia, Latin America and Africa.

-The government of Puerto Rico has announced that it does not have enough cash to make a scheduled debt payment of 169 million dollars on August 1st.  The Obama administration says that there are no plans in the works to bail out Puerto Rico.

-On Monday, the Dow was down another 127 points.  It was the fifth day in a row that the Dow and the S&P 500 have both declined.

-Overall, the Dow is now down more than 650 points since July 20th.

-480 stocks on the New York Stock Exchange have hit new 52-week lows.  Many analysts consider this to be a very, very ominous sign.

-I have repeatedly written about the danger of the commodity collapse that we are currently witnessing, and the Bloomberg Commodity Index fell another 1.22 percent on Monday to a fresh low of 92.1493.

-On Monday, the price of U.S. oil hit a 52-week low of $46.92.

-So far, the price of U.S. oil has fallen about 20 percent this month.

-Back in June 2014, the price of a barrel of West Texas Intermediate crude was above 107 dollars.  Since then, the price of U.S. oil has fallen an astounding 56 percent.

-Thanks in large part to the collapse in energy prices, junk bonds are cratering.  This is something that happened just before the financial crisis of 2008, and now it is happening again.  The following comes from Wolf Street

Among the bonds: Cliffs Natural Resources down 27.6%, SandBridge down 30%, Murray Energy down 21.2%, and Linn Energy down 22.3%, according to Bloomberg.

For example, Linn Energy 6.25% notes due in 2019 were trading at 78 cents on the dollar at the beginning of July and at 58 on Friday, according to LCD. There was bloodshed beyond energy, such as AK Steel’s 7.625% notes due in 2021. They were trading at 62 cents on the dollar, down 22% from the beginning of July.

“The performance is a disappointment to investors who purchased about $40 billion of junk-rated bonds from energy companies this year, thinking that the worst of the slump was over,” Bloomberg noted.

This is exactly what we would expect to see during the early stages of a financial crisis.

Of course global financial markets may bounce back somewhat tomorrow.  If you will remember, some of the largest one day gains in stock market history happened right in the middle of the stock market collapse of 2008.  So don’t get fooled by what happens on any one particular day.

With so much fear in the air, literally anything could happen in the weeks and months ahead of us.  One month ago, I issued a red alert for the last six months of this year.  I warned that a major financial crisis was imminent and that people needed to start protecting themselves immediately.

As I write this article on Monday evening, financial markets are already opening up over in Asia.  Japanese stocks are already down 251 points even though the market has only been open for about an hour over there.

We have entered a time when what is happening to global stock markets will once again be headline news.  We are right on the precipice of another great financial crisis, only this one is going to ultimately end up being much worse than the last one.

Now is the time.

Please get prepared while you still can.

The Stock Market Will Start To Fall In July? The Dow Plummeted More Than 500 Points Last Week

Falling - Public DomainWas last week a preview of things to come? There are quite a few people out there that believe that the stock market would begin to decline in July, and that appears to be precisely what is happening. Last week, the Dow Jones Industrial Average fell by more than 530 points. It was the biggest one week decline that we have seen so far in 2015, and some are suggesting that this could only be just the beginning. By just about any measurement that you might want to use, the stock market is overvalued. But we have been in this bubble for so long that many people have come to believe that this is “the new normal”. In fact, earlier today someone that I know dropped me a line and suggested that our financial overlords may be able to use the tools at their disposal to get this current bubble to persist indefinitely. Unfortunately, the truth is that no financial bubble ever lasts forever, and right now some very alarming things are starting to happen behind the scenes. Over the past couple of weeks, the smart money has been dumping stocks like crazy, and the lack of liquidity in the bond markets is beginning to become acute.  Could it be possible that another great financial crisis is just around the corner?

Last week took a lot of investors by surprise. The following is how Zero Hedge summarized the carnage…

-Russell 2000 -3.1% – worst week since Oct 2014 (Bullard)
-Dow -2.8% – worst week since Dec 2014
-S&P -2.1% – worst week since Jan 2015
-Trannies -2.8% – worst week since Mar 2015
-Nasdaq -2.2% – worst week since Mar 2015

The talking heads on television were not quite sure what to make of this sudden downturn. On CNBC, analysts mainly blamed the usual suspects…

“I think the market’s very much concerned about the commodity (decline),” said John Lonski, chief economist at Moody’s. “The contraction in China manufacturing activity is gaining momentum and the credit market has yet to signal that rates are not about to go higher.”

He also noted a surprising decline in new home sales and continued lack of revenue growth in earnings. Nearly all the commodities are in a bear market and gold and crude settled at lows Friday.

“You’ve got some major growth concerns and that is what’s weighing on investors minds,” said Peter Boockvar, chief market strategist at The Lindsey Group.

And without a doubt, there are some new numbers that are deeply troubling for Wall Street. For example, it is being projected that S&P 500 companies will collectively report a 2.2 percent decline in earnings for the second quarter of 2015. If this comes to pass, it will be the first drop that we have seen since the third quarter of 2012.

The biggest reason for this decline in earnings is the implosion of U.S. energy companies due to the crash in oil prices. The following comes from CNBC

Thanks to a collapse in the price of oil, the energy sector is slated to report a monster 54 percent drop in earnings and 28 percent swoon in revenue, compared to the second quarter in the year prior.

Hmm – unlike what so many others were saying initially, it turns out that the oil crash is bad for the U.S. economy after all.

But just like at this time of the year in 2008, most people fully expect that everything is going to be just fine. So many of the exact same patterns that we witnessed the last time around are playing out once again, and yet most of the “experts” refuse to see what is happening right in front of their eyes.

When things crash this time, it won’t just be stocks that collapse. As I have been writing about so frequently, we are also headed for an implosion of the bond markets as well. The following comes from Dr. David Eifrig

In the U.S. Treasury securities market, financial-services giant JPMorgan Chase estimates that five years ago, you could move about $280 million worth of Treasury securities before your trades moved the market’s price. Now, that’s down to $80 million… a decline of more than 70%.

When a panic sets in, reduced liquidity can cause big swings in market prices.

There is that word “liquidity” again. This is something that I have repeatedly been taking about. Just check out this article from a little over a month ago. A bond is only worth what someone else is willing to pay for it, and if the market runs out of buyers that can cause seismic shifts in price very rapidly. Here is more from Eifrig

In a run-of-the-mill bear market, you just have a downward trend… When enough investors are selling bonds, it drives down prices. Falling prices lead more investors to start selling. We see that all the time.

A liquidity crisis goes even further. It’s like a classic run on a bank… Without sufficient liquidity, the sellers don’t just see lower prices… they see no prices. Since no one wants to buy bonds at this particular time, the price for them effectively becomes zero.

There has been a lot of speculation about what will happen in the second half of 2015.

We only have a little over five months to go in the year, so it won’t be too long before we see who was right and who was wrong.

Our perceptions of the future are very much shaped by our worldviews. All the time, I get “Obamabots” that come to my website and leave comments on my articles telling me how Barack Obama has “turned the economy around” and has set the stage for a new era of prosperity in America.

Despite all the evidence to the contrary, they choose to believe that things are in great shape because that is what they want to believe. Just check out the results from one recent survey

While 55 percent of Democrats reported feeling positive about the economy, for example, just 25 percent of Republicans felt the same from March 25 to May 27.

When asked if they thought the economy would improve over the next 12 months, 53 percent of Democrats said yes. Only 23 percent of the Republicans in the survey agreed.

The same perception gap extends to the far future, with 41 percent of Democrats believing that the next generation will be better off than their parents, and just 24 percent of Republicans saying the same.

To me, those numbers are quite striking.

Many Democrats very much want to believe that things are getting better because Barack Obama is in the White House.

Many Republicans very much want to believe that things are totally falling apart because Barack Obama is in the White House.

So who is right and who is wrong?

Please feel free to share what you think by posting a comment below…