19 Very Surprising Facts About The Messed Up State Of The U.S. Economy

19 - Public Domain
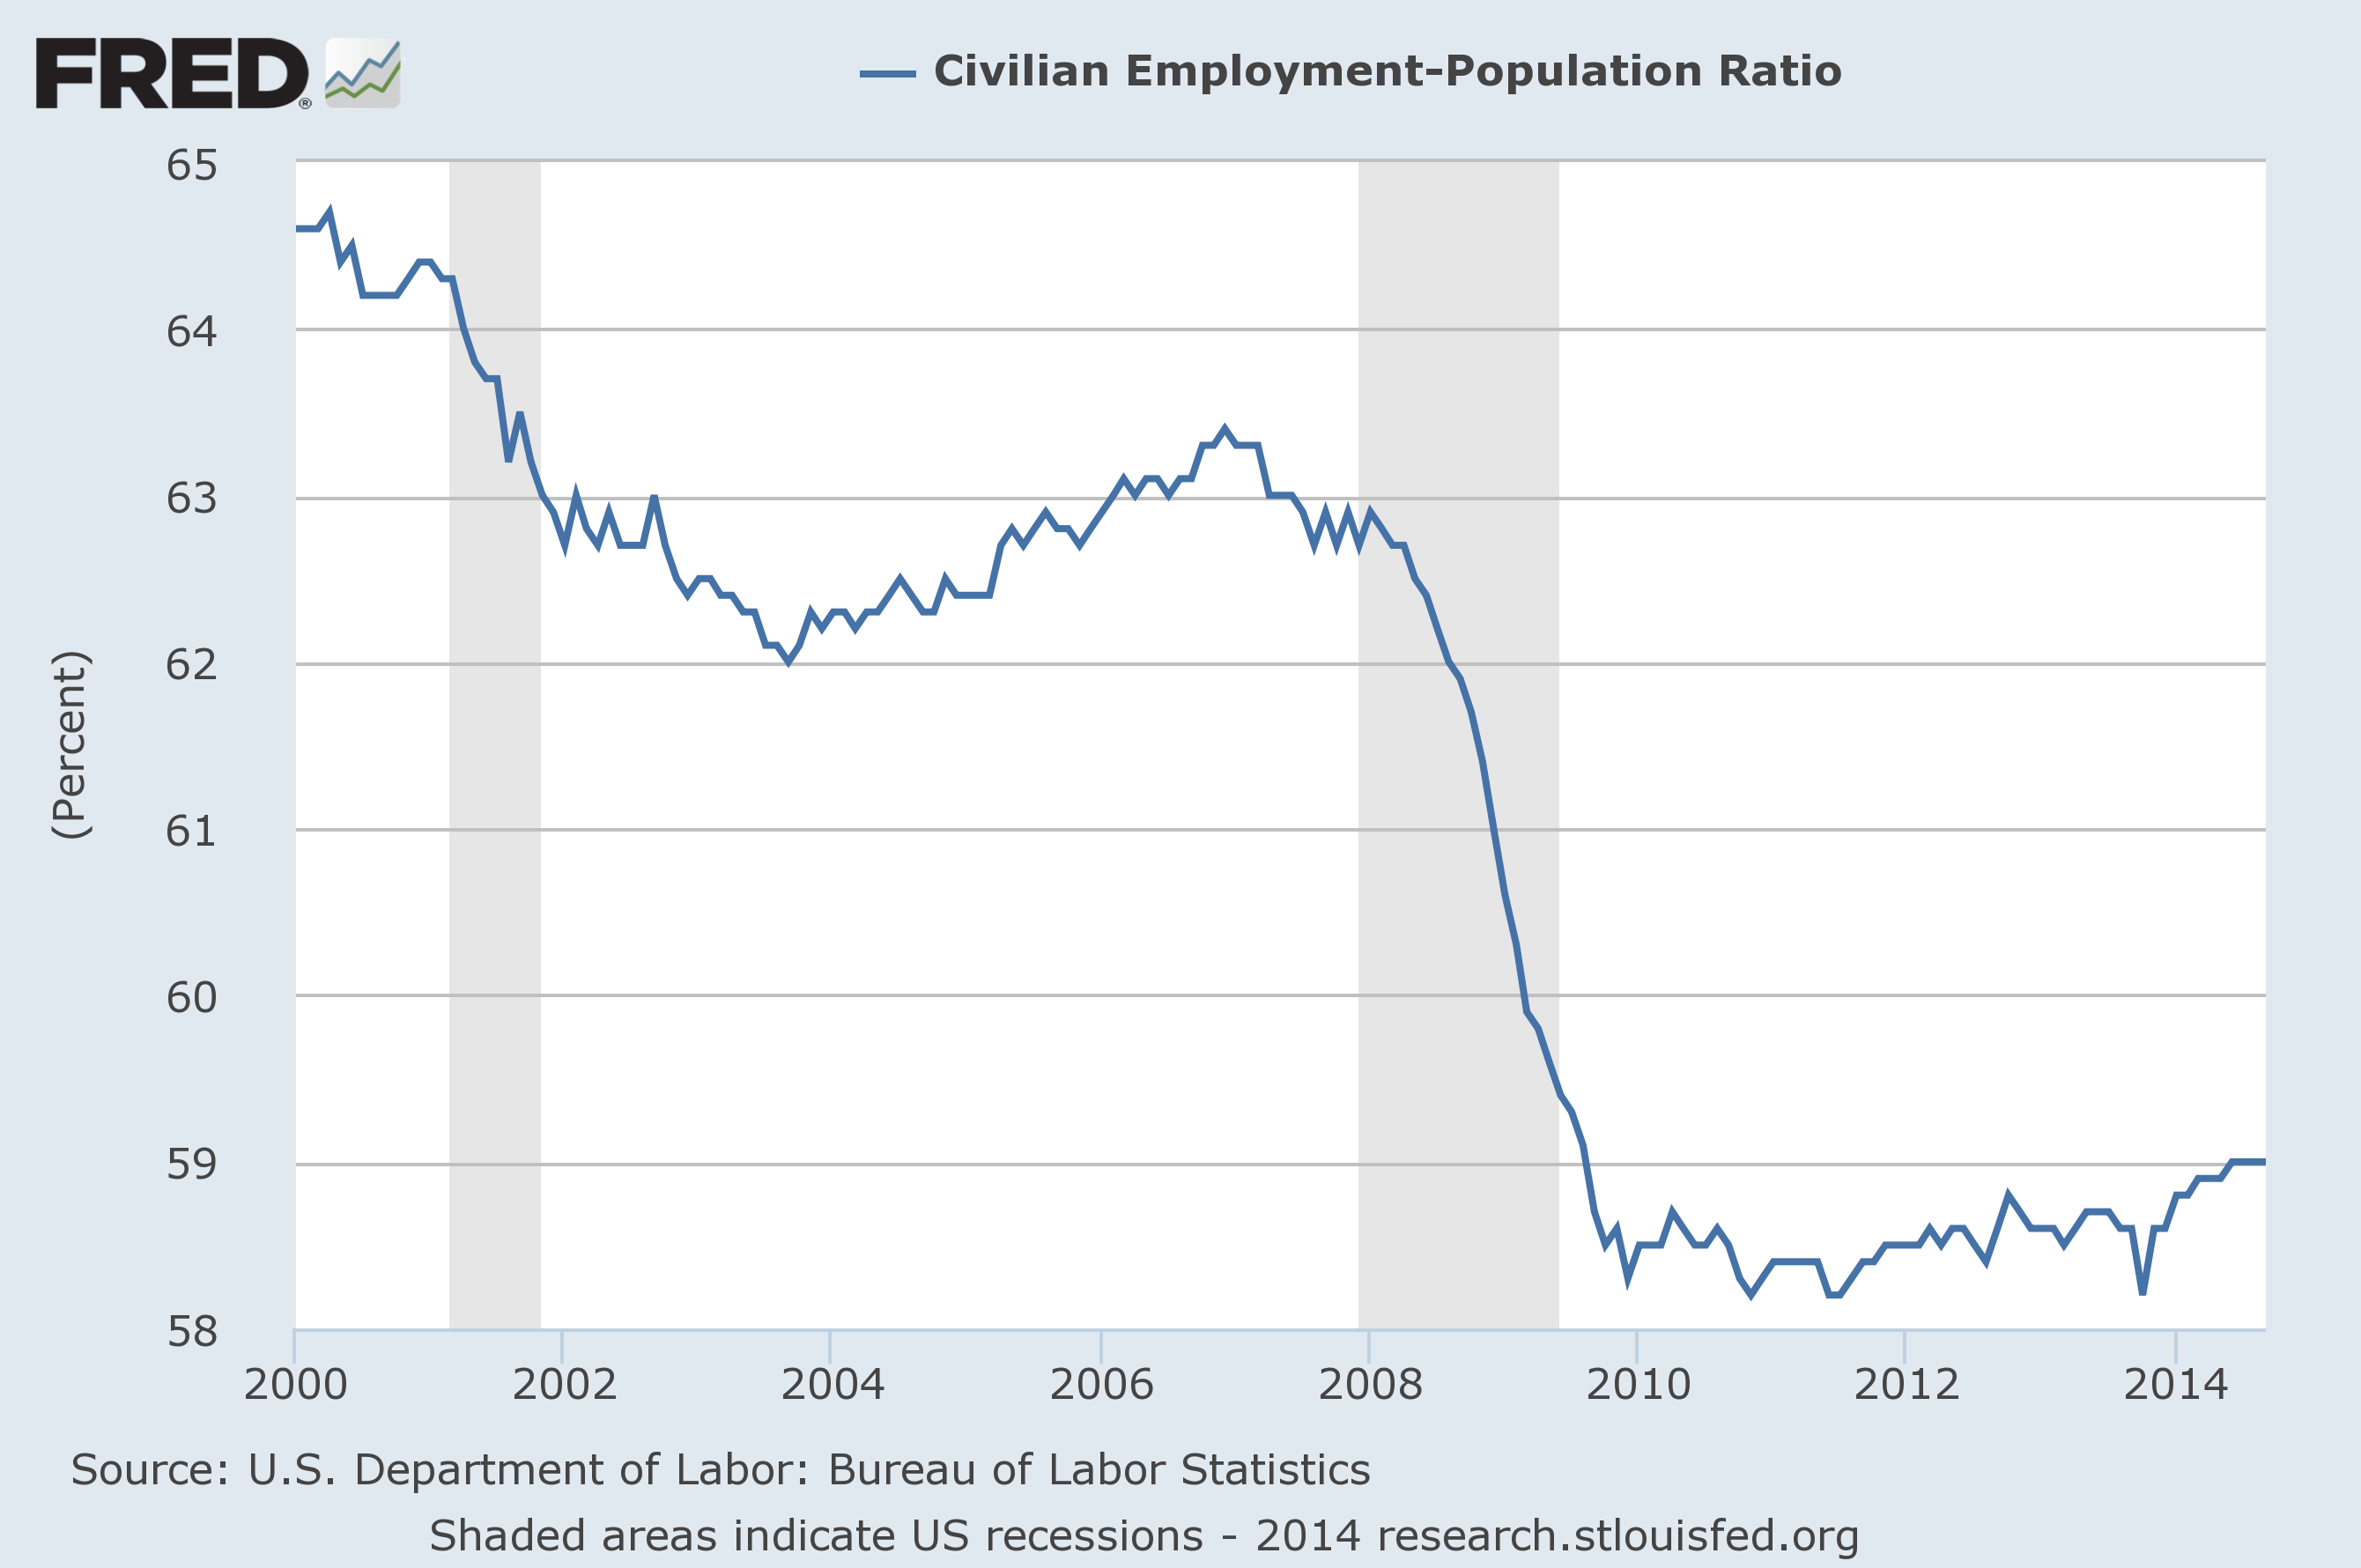
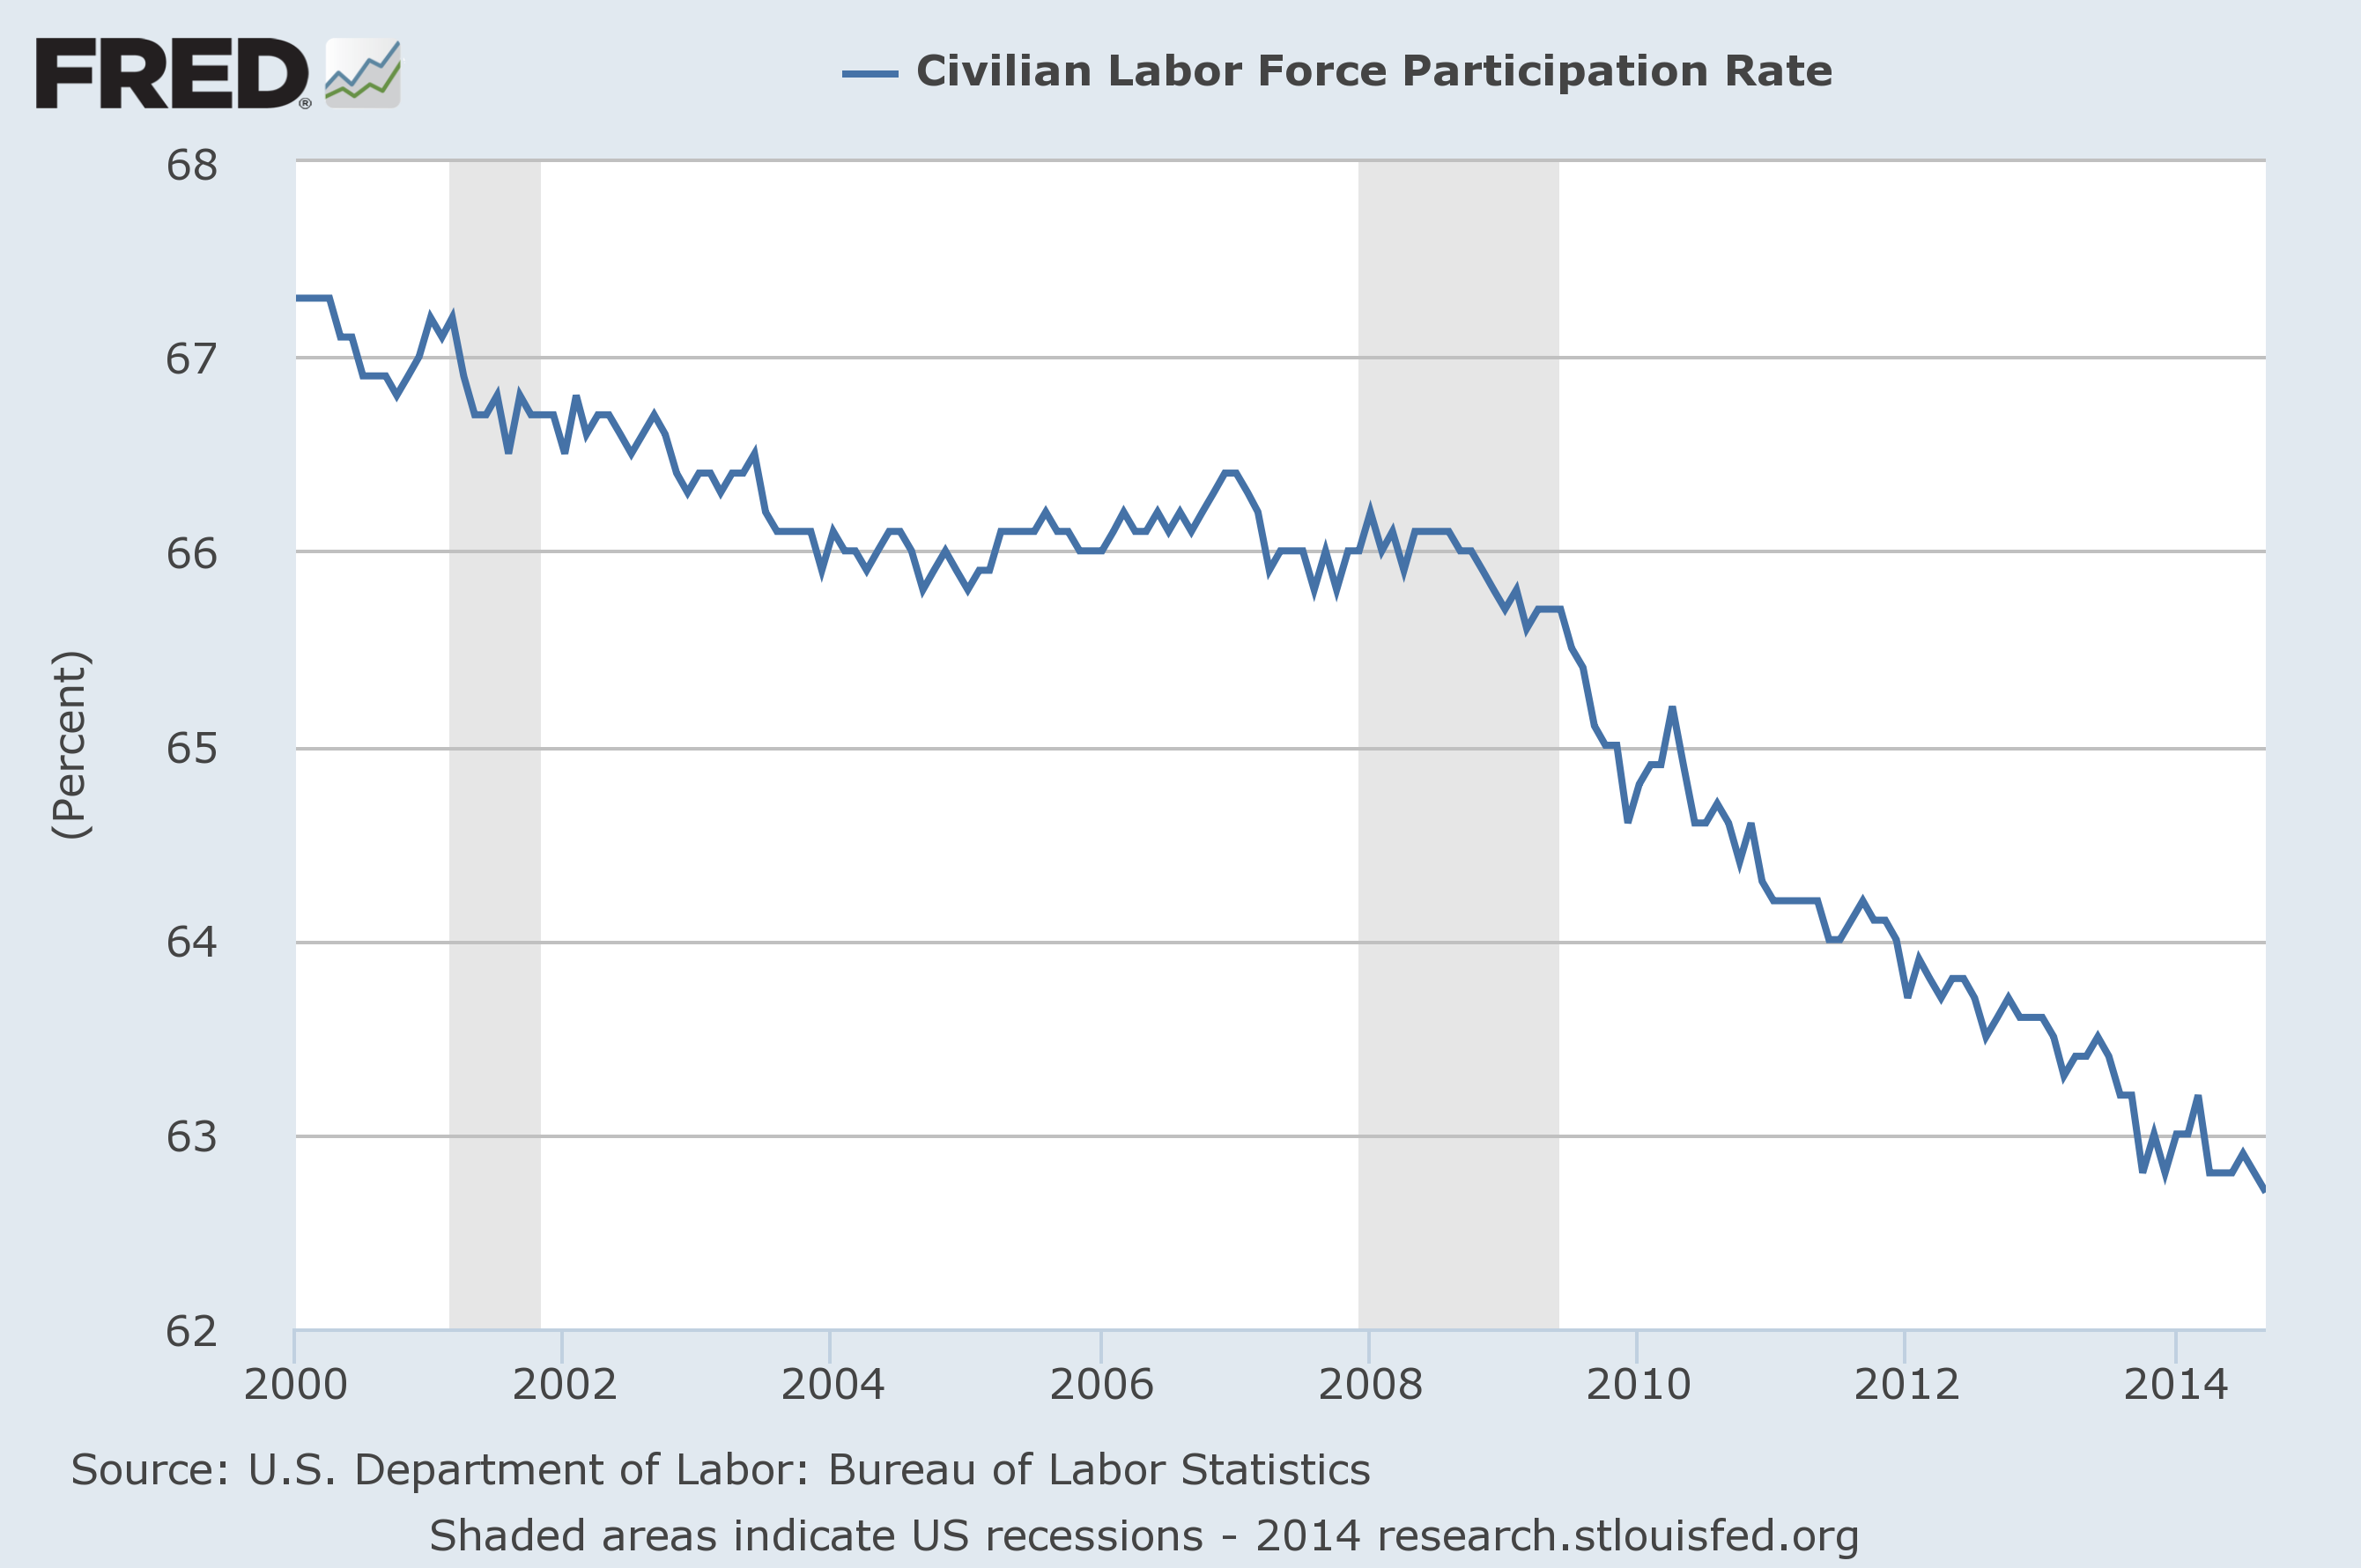
Barack Obama and the Federal Reserve are lying to you.  The “economic recovery” that we all keep hearing about is mostly just a mirage.  The percentage of Americans that are employed has barely budged since the depths of the last recession, the labor force participation rate is at a 36 year low, the overall rate of homeownership is the lowest that it has been in nearly 20 years and approximately 49 percent of all Americans are financially dependent on the government at this point.  In a recent article, I shared 12 charts that clearly demonstrate the permanent damage that has been done to our economy over the last decade.  The response to that article was very strong.  Many people were quite upset to learn that they were not being told the truth by our politicians and by the mainstream media.  Sadly, the vast majority of Americans still have absolutely no idea what is being done to our economy.  For those out there that still believe that we are doing “just fine”, here are 19 more facts about the messed up state of the U.S. economy…

#1 After accounting for inflation, median household income in the United States is 8 percent lower than it was when the last recession started in 2007.

#2 The number of part-time workers in America has increased by 54 percent since the last recession began in December 2007.  Meanwhile, the number of full-time jobs has dropped by more than a million over that same time period.

#3 More than 7 million Americans that are currently working part-time jobs would actually like to have full-time jobs.

#4 The jobs gained during this “recovery” pay an average of 23 percent less than the jobs that were lost during the last recession.

#5 The number of unemployed workers that have completely given up looking for work is twice as high now as it was when the last recession began in December 2007.

#6 When the last recession began, about 17 percent of all unemployed workers had been out of work for six months or longer.  Today, that number sits at just above 34 percent.

#7 Due to a lack of decent jobs, half of all college graduates are still relying on their parents financially when they are two years out of school.

#8 According to a new method of calculating poverty devised by the U.S. Census Bureau, the state of California currently has a poverty rate of 23.4 percent.

#9 According to the New York Times, the “typical American household” is now worth 36 percent less than it was worth a decade ago.

#10 In 2007, the average household in the top 5 percent had 16.5 times as much wealth as the average household overall.  But now the average household in the top 5 percent has 24 times as much wealth as the average household overall.

#11 In an absolutely stunning development, the rate of small business ownership in the United States has plunged to an all-time low.

#12 Subprime loans now make up 31 percent of all auto loans in America.  Didn’t that end up really badly when the housing industry tried the same thing?

#13 The average cost of producing a barrel of shale oil in the United States is approximately 85 dollars.  Now that the price of oil is starting to slip under that number, the “shale boom” in America could turn into a bust very rapidly.

#14 On a purchasing power basis, China now actually has a larger economy than the United States does.

#15 It is hard to believe, but there are 49 million people that are dealing with food insecurity in America today.

#16 There are six banks in the United States that pretty much everyone agrees fit into the “too big to fail” category.  Five of them have more than 40 trillion dollars of exposure to derivatives.

#17 The 113 top earning employees at the Federal Reserve headquarters in Washington D.C. make an average of $246,506 a year.  It turns out that ruining the U.S. economy is a very lucrative profession.

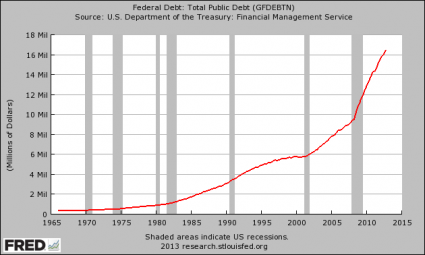
#18 We are told that the federal deficit is under control, but the truth is that the U.S. national debt increased by more than a trillion dollars during fiscal year 2014.

#19 An astounding 40 million dollars has been spent just on vacations for Barack Obama and his family.  Perhaps he figures that if we are going down as a nation anyway, he might as well enjoy the ride.

If our economy truly was “recovering”, there would be lots of good paying middle class jobs available.

But that is not the case at all.

I know so many people in their prime working years that spend day after day searching for a job.  Most of them never seem to get anywhere.  It isn’t because they don’t have anything to offer.  It is just that the labor market is absolutely saturated with qualified job seekers.

For example, USA Today recently shared the story of 42-year-old Alex Gomez…

“I’ve had to seriously downgrade my living situation,” said Alex Gomez, a 42-year-old with a master’s degree in entrepreneurship. Gomez lost his last full-time job in 2009 and has been looking for work since a short-term contract position ended in 2012.

Gomez’s home was foreclosed on, so the Tampa resident lives with three roommates in a college neighborhood. He drained his 401(k) trying to save his house, and he has around $150,000 in student loans. His mother is tapping her 401(k) to pay his rent. Gomez subsists on that and about $200 a month in food stamps.

“I have been applying and looking for pretty much anything at this stage,” he said. Although he’s looking for work in engineering or data management, “I applied to a supermarket as a deli clerk because I used to be a deli clerk as a teenager,” he said. He was told he was overqualified and turned down.

Does Alex Gomez have gifts and abilities to share with our society?

Of course he does.

So why can’t he find a job?

It is because we have a broken economy.

We are in the midst of a long-term economic decline and the system simply does not work properly anymore.

And thanks to decades of very foolish decisions, this is only the start of our problems.

Things are only going to get worse from here.

40 Statistics About The Fall Of The U.S. Economy That Are Almost Too Crazy To Believe

40 Statistics About The Fall Of The U.S. Economy That Are Almost Too Crazy To BelieveIf you know someone that actually believes that the U.S. economy is in good shape, just show them the statistics in this article.  When you step back and look at the long-term trends, it is undeniable what is happening to us.  We are in the midst of a horrifying economic decline that is the result of decades of very bad decisions.  30 years ago, the U.S. national debt was about one trillion dollars.  Today, it is almost 17 trillion dollars.  40 years ago, the total amount of debt in the United States was about 2 trillion dollars.  Today, it is more than 56 trillion dollars.  At the same time that we have been running up all of this debt, our economic infrastructure and our ability to produce wealth has been absolutely gutted.  Since 2001, the United States has lost more than 56,000 manufacturing facilities and millions of good jobs have been shipped overseas.  Our share of global GDP declined from 31.8 percent in 2001 to 21.6 percent in 2011.  The percentage of Americans that are self-employed is at a record low, and the percentage of Americans that are dependent on the government is at a record high.  The U.S. economy is a complete and total mess, and it is time that we faced the truth.

The following are 40 statistics about the fall of the U.S. economy that are almost too crazy to believe…

#1 Back in 1980, the U.S. national debt was less than one trillion dollars.  Today, it is rapidly approaching 17 trillion dollars…

National Debt

#2 During Obama’s first term, the federal government accumulated more debt than it did under the first 42 U.S presidents combined.

#3 The U.S. national debt is now more than 23 times larger than it was when Jimmy Carter became president.

#4 If you started paying off just the new debt that the U.S. has accumulated during the Obama administration at the rate of one dollar per second, it would take more than 184,000 years to pay it off.

#5 The federal government is stealing more than 100 million dollars from our children and our grandchildren every single hour of every single day.

#6 Back in 1970, the total amount of debt in the United States (government debt + business debt + consumer debt, etc.) was less than 2 trillion dollars.  Today it is over 56 trillion dollars…

Total Debt

#7 According to the World Bank, U.S. GDP accounted for 31.8 percent of all global economic activity in 2001.  That number dropped to 21.6 percent in 2011.

#8 The United States has fallen in the global economic competitiveness rankings compiled by the World Economic Forum for four years in a row.

#9 According to The Economist, the United States was the best place in the world to be born into back in 1988.  Today, the United States is only tied for 16th place.

#10 Incredibly, more than 56,000 manufacturing facilities in the United States have been permanently shut down since 2001.

#11 There are less Americans working in manufacturing today than there was in 1950 even though the population of the country has more than doubled since then.

#12 According to the New York Times, there are now approximately 70,000 abandoned buildings in Detroit.

#13 When NAFTA was pushed through Congress in 1993, the United States had a trade surplus with Mexico of 1.6 billion dollars.  By 2010, we had a trade deficit with Mexico of 61.6 billion dollars.

#14 Back in 1985, our trade deficit with China was approximately 6 million dollars (million with a little “m”) for the entire year.  In 2012, our trade deficit with China was 315 billion dollars.  That was the largest trade deficit that one nation has had with another nation in the history of the world.

#15 Overall, the United States has run a trade deficit of more than 8 trillion dollars with the rest of the world since 1975.

#16 According to the Economic Policy Institute, the United States is losing half a million jobs to China every single year.

#17 Back in 1950, more than 80 percent of all men in the United States had jobs.  Today, less than 65 percent of all men in the United States have jobs.

#18 At this point, an astounding 53 percent of all American workers make less than $30,000 a year.

#19 Small business is rapidly dying in America.  At this point, only about 7 percent of all non-farm workers in the United States are self-employed.  That is an all-time record low.

#20 Back in 1983, the bottom 95 percent of all income earners in the United States had 62 cents of debt for every dollar that they earned.  By 2007, that figure had soared to $1.48.

#21 In the United States today, the wealthiest one percent of all Americans have a greater net worth than the bottom 90 percent combined.

#22 According to Forbes, the 400 wealthiest Americans have more wealth than the bottom 150 million Americans combined.

#23 The six heirs of Wal-Mart founder Sam Walton have as much wealth as the bottom one-third of all Americans combined.

#24 According to the U.S. Census Bureau, more than 146 million Americans are either “poor” or “low income”.

#25 According to the U.S. Census Bureau, 49 percent of all Americans live in a home that receives direct monetary benefits from the federal government.  Back in 1983, less than a third of all Americans lived in a home that received direct monetary benefits from the federal government.

#26 Overall, the federal government runs nearly 80 different “means-tested welfare programs”, and at this point more than 100 million Americans are enrolled in at least one of them.

#27 Back in 1965, only one out of every 50 Americans was on Medicaid.  Today, one out of every 6 Americans is on Medicaid, and things are about to get a whole lot worse.  It is being projected that Obamacare will add 16 million more Americans to the Medicaid rolls.

#28 As I wrote recently, it is being projected that the number of Americans on Medicare will grow from 50.7 million in 2012 to 73.2 million in 2025.

#29 At this point, Medicare is facing unfunded liabilities of more than 38 trillion dollars over the next 75 years.  That comes to approximately $328,404 for every single household in the United States.

#30 Right now, there are approximately 56 million Americans collecting Social Security benefits.  By 2035, that number is projected to soar to an astounding 91 million.

#31 Overall, the Social Security system is facing a 134 trillion dollar shortfall over the next 75 years.

#32 Today, the number of Americans on Social Security Disability now exceeds the entire population of Greece, and the number of Americans on food stamps now exceeds the entire population of Spain.

#33 According to a report recently issued by the Pew Research Center, on average Americans over the age of 65 have 47 times as much wealth as Americans under the age of 35.

#34 U.S. families that have a head of household that is under the age of 30 have a poverty rate of 37 percent.

#35 As I mentioned recently, the homeownership rate in America is now at its lowest level in nearly 18 years.

#36 There are now 20.2 million Americans that spend more than half of their incomes on housing.  That represents a 46 percent increase from 2001.

#37 45 percent of all children are living in poverty in Miami, more than 50 percent of all children are living in poverty in Cleveland, and about 60 percent of all children are living in poverty in Detroit.

#38 Today, more than a million public school students in the United States are homeless.  This is the first time that has ever happened in our history.

#39 When Barack Obama first entered the White House, about 32 million Americans were on food stamps.  Now, more than 47 million Americans are on food stamps.

#40 According to one calculation, the number of Americans on food stamps now exceeds the combined populations of “Alaska, Arkansas, Connecticut, Delaware, District of Columbia, Hawaii, Idaho, Iowa, Kansas, Maine, Mississippi, Montana, Nebraska, Nevada, New Hampshire, New Mexico, North Dakota, Oklahoma, Oregon, Rhode Island, South Dakota, Utah, Vermont, West Virginia, and Wyoming.”