 In an eerie repeat of what we witnessed in 2008, U.S. stocks are steadily sliding throughout the summer as we head toward the month of September. From August 1st, 2008 to September 1st, 2008 the Dow fell by nearly 700 points. And of course we all remember what happened the following month. Right now, we are watching a similar thing happen. The Dow has plummeted nearly 700 points since July 16th, and it is down nearly 900 points from the peak of the market back in May. At this point the Dow has now fallen for six days in a row and eleven of the last thirteen. Of course most of the talking heads on television are still insisting that everything is going to be just fine and that a repeat of 2008 is not possible. So what do you think? Should we trust them?
Personally, I find that I put a lot more faith in cold, hard numbers than in what the talking heads on television have to say. And at this moment, the cold, hard numbers are telling us that another financial crisis in imminent.
This is one of the reasons why I am such a fan of Zero Hedge. Nobody stays on top of the hard financial numbers like Zero Hedge does. And according to Zero Hedge, market internals are absolutely screaming that a U.S. stock market crash is right around the corner…
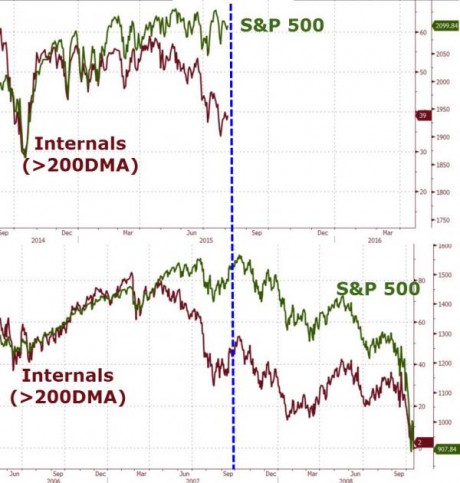
In early 2007, market internals began to weaken dramatically. Talking heads and asset gatherers said fears were overblown, risk was contained, Fed has it under control, stay the course. Six months later, the equity markets began to collapse and then accelerated lower. Today, in an eery case of deja vu all over again, it has been six months now since US equity market internals began to decouple from the manipulated index levels that manufacture wealth and happiness across America… what would you do?
Here is the chart that immediately followed that paragraph. As you can see, we are repeating the exact same pattern that we witnessed back during the last financial crisis…
Meanwhile, the second largest stock market in the world is already crashing. The Chinese have spent approximately 1.3 trillion dollars propping up stocks in China, but they just continue to fall. They were down again on Wednesday night, and nobody is quite sure when the carnage is going to end.
And remember, Chinese stocks started to crash before U.S. stocks did in 2008 as well.
Another eerie similarity to 2008 is the behavior of oil. In the summer of 2008, the price of oil crashed hard, and then a stock crash followed a couple of months later.
Well, guess what?
The price of oil is crashing hard once again. The following comes from CNBC…
Oil set multi-month lows on Thursday as investors and traders sought clues about the market’s next bottom after a large drop in U.S. crude inventories failed to boost prices.
A bigger-than-expected build in U.S. gasoline stockpiles last week proved more important to investors than crude storage numbers that came in three times below forecast on Wednesday.
U.S. crude was down 50 cents at $44.65 a barrel at 1:30 p.m. EDT (1730 GMT), after touching a 4½ month bottom at $44.20.
Why can’t more people see the signs?
They are so obvious.
We are also getting indications that the real economy is starting to be affected by all of this chaos. The mainstream media has been very quiet about this, but the number of job cuts just hit a four year high…
Challenger, Gray & Christmas has released its monthly job cuts for July, and it is ugly. The 105,696 job cuts was the highest number since 2011. To put this in perspective, the July job cuts total is a whopping 136% higher than the 44,842 job cuts reported in June, as well as 125% higher than the in same report a year ago.
The July report showed that the last time more than 100,000 job cuts were announced was back in September 2011, when there were some 115,730 layoffs.
Another bad trend is that July’s surge now brings the year-to-date job cuts up to a total of 393,368. That is 34% higher than the run rate for the same period in 2014.
If alarm bells are going off in your head right now, that is good, because they should be.
A 34 percent increase in job cuts is not a good thing.
Of course it would probably help if the Obama administration was not bringing in far more immigrant workers than the limits that have been officially set by Congress. Just check out these numbers…
In written responses to the Senate Judiciary Immigration and the National Interest Subcommittee Republicans obtained by Breitbart News, U.S. Citizenship and Immigration Services reveal that the Obama administration has been approving work authorizations for immigrants beyond admission limits and for some categories of immigrants that Congress never intended to work in the U.S.
Beyond those limits each year, these new and renewed work permit approvals amounted to about 1.23 million in fiscal year 2009, 1.08 million in FY 2010, 970,277 in FY 2011, 1.24 million in FY 2012, 1.68 million in FY 2013 and 1.24 million in FY 2014.
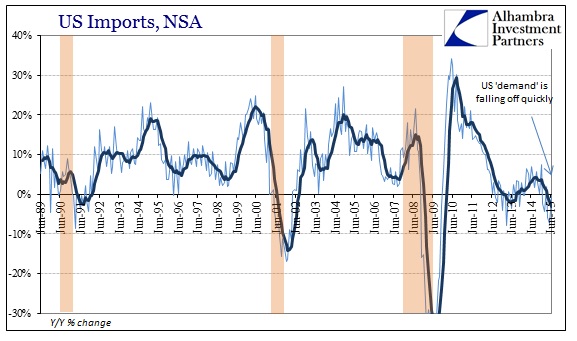
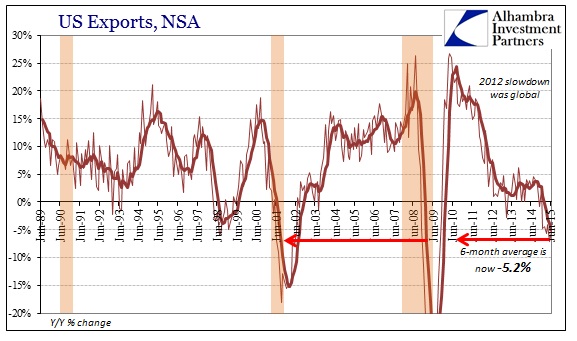
Also, this is the first time that imports and exports have both been declining on a year over year basis since the last recession. Just check out this chart and this chart.
When imports and exports are both falling, that means that economic activity is slowing down. And we are seeing a similar thing happen all over the planet. At this point, global trade has fallen by a total of about 2 percent over the past six months.
Are you starting to get the picture?
Just like in the summer of 2008, global economic activity is diminishing and things in the financial world are lining up in textbook fashion for a major crisis.
But for those that are not convinced by now, there is not that much more that I can do. I could keep throwing out numbers and charts and graphs, but if people refuse to see the truth they simply will not see it.
Less than a month from now, we will officially be in the danger zone.
September is coming, and I truly hope that you are already prepared for it.