Tech Stocks Experience Their Longest Losing Streak In 5 Years As Panic Begins To Grip The Market

S&P 500 tech stocks have now fallen for 9 days in a row.  The last time tech stocks declined for so many days in a row was in 2012, and that was the only other time in history when we have seen such a long losing streak.  As I have stated before, the post-election “Trump rally” is officially done, and the market is starting to roll over as investors begin to realize that all of the buying momentum has completely evaporated.  Tech stocks tend to be particularly volatile, and so the fact that they are starting to lead the way down should definitely be alarming to many in the investing community.

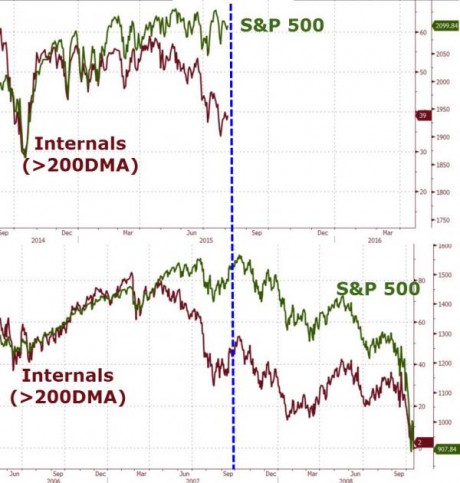
Of course it isn’t just tech stocks that are falling.  The Dow was down another 59 points on Wednesday, and the S&P 500 has closed beneath its 50 day moving average for the very first time since the election.  For those that have been waiting for a key technical signal before getting out of the market, there is one for you.

The price of gold was up again, and that is definitely not surprising in this geopolitical environment.  The closer we get to war the higher gold and silver prices will go, and if we actually get into a major conflict we will see them blast into the stratosphere.

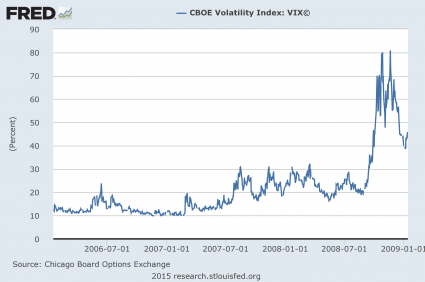
Another key indicator that I am watching very closely is the VIX.  On Wednesday it shot up above 16 for the very first time since the day after Trump’s election victory, and many believe that it could soon go much higher.  The following is an excerpt from a CNBC report

The VIX measures the size of the S&P 500’s expected moves over the next 30 days, and consequently tends to run just a bit hotter than volatility over the past 30 days. Yet one-month realized volatility is just 6.7, meaning the VIX is at a roughly 9-point premium, which Chintawongvanich calls “highly unusual.”

That said, he notes that implied volatility was also at a large premium preceding the U.K. referendum to leave the EU and the U.S. presidential election. The obvious conclusion is that the market is now similarly preparing itself for the French presidential election, which is set to be held on April 23. Some fear that a populist candidate could prevail, which may cause more problems for the European Union and thus for economic stability.

As noted in that excerpt, the upcoming French election is absolutely huge.  If the election goes “the wrong way” according to the globalists, it could literally mean the end of the European Union as it is configured today.

And of course of even greater concern is the global march toward war.  It is being reported that North Korea is on the verge of a major nuclear weapons test, and such an act of defiance could be enough to push Donald Trump into conducting a major military strike.

But if Trump does hit North Korea, it is quite likely that North Korea will hit back.  The North Koreans are promising to use nuclear weapons in any conflict with the United States, and if Trump bungles this thing we could easily be looking at a scenario in which millions of people end up dead.

Things also continue to get more tense in the Middle East.  The Russians and the Iranians are promising to respond to any additional U.S. strikes “with force”, and on Wednesday Trump declared that our relationship with Russia “may be at an all-time low”.

Of course this came shortly after Secretary of State Rex Tillerson used similar language following his face to face meeting with Russian President Vladimir Putin

Secretary of State Rex Tillerson and Russian President Vladimir Putin held more than two hours of “very frank” talks Wednesday in the Kremlin amid tensions over a U.S. airstrike against a Syria air base blamed for last week’s deadly chemical attack.

In remarks to reporters after the meeting, Tillerson said he told the Russian leader that current relations between the two countries are at a “low point.”

If the Trump administration conducts any more strikes on Syria, it is quite likely that the Russians and Iranians will make good on their threats and will start firing back.

And once U.S. aircraft or U.S. naval vessels come under fire, the calls for war in Washington will become absolutely deafening.

Unfortunately, Trump is not likely to back down any time soon because the recent missile strike in Syria has dramatically boosted his popularity.  According to every recent survey, the American people overwhelmingly approve of what Trump did…

A Morning Consult/Politico poll released Wednesday found that 57% of Americans supported airstrikes in Syria, 58% supported establishing a no-fly zone over parts of Syria including strikes against Syria’s air-defense systems, and 63% of Americans thought the US should do more to end the Syrian conflict. Even more, 66% of respondents said they supported the Trump administration’s strike last week specifically.

This mirrored results of another recent poll from CBS News in which 57% of Americans said they approved of the US strike. A Pew Research Center survey from this week showed a similar level of support, with 58% of Americans approving of the strike.

Sadly, this is a time when the majority is dead wrong.  Many of those that are supporting military action against Syria now were vehemently against it when Barack Obama was considering it.

Even Donald Trump spoke out very strongly against military intervention in Syria in 2013, and he was quite right to do so, and so what has suddenly changed that now makes it okay?

There is nothing to be gained in Syria, but we could very easily end up in a direct military conflict with Russia, Iran and Hezbollah which could ultimately prove to be the spark that sets off World War III.

And of course a military strike on North Korea could also potentially spark a global war.  The first Korean War resulted in a direct military conflict between the United States and China, and the second Korean War could easily result in the exact same thing happening again.

Do the American people really want war with both Russia and China at the same time?

It has been said that you should be careful what you wish for, because you just might get it.

This Is EXACTLY What The Early Phases Of A Market Meltdown Look Like

Stock Market Collapse Toilet Paper - Public DomainThere is so much confusion out there.  On the days when the Dow goes down by several hundred points, lots of people pat me on the back and tell me that I “nailed” my call for the second half of this year.  But on the days when the Dow goes up by several hundred points, I get lots of people contacting me and telling me that they are confused because they thought the stock market was supposed to go down.  Well, the truth is that if there is going to be a full-blown market meltdown, we would expect for there to be wildly dramatic swings in the market both up and down.  A perfect example of this is what we experienced during the financial crisis of 2008.  9 of the 20 largest single day declines in stock market history happened that year, but 9 of the 20 largest single day increases in stock market history also happened that year.  If we are moving into another great financial crisis, there should be massive ups and massive downs, and that is precisely what we are witnessing right now.

On Tuesday, the Dow surged several hundred points.  There was much celebrating in the mainstream media over this, but what they failed to realize was that this was another big red flag.  And we saw this volatility carry over into Wednesday.  The Dow was up 171 points early in the day before ending down 239 points.

By themselves, those two days don’t mean a whole lot.  The key is to look at them in context.  And in context, we have already witnessed the most dramatic stock market crash since the last financial crisis.

There will be more days when the stock market absolutely plummets and there will be more days when it absolutely soars.  No stock market crash in U.S. history has ever gone in just one direction continually.  There are always giant waves of momentum that cause panic selling and panic buying.

There is one thing that could change that.  A major “black swan event” such as a historic natural disaster, an unprecedented terror attack, or the outbreak of war could potentially be enough to chase all of the buyers out of the marketplace.  And considering the times that we are moving into, those things should not be ruled out.

But minus some type of event like that, we should expect lots of wild swings in both directions.

Over the past couple of years, I have repeatedly attempted to explain the general principle that markets tend to go up when they are calm and they tend to go down when they are volatile.

If you want the bull market to return, you should be rooting for lots of really, really boring days on Wall Street.

When things are boring, investors make money.

Days that are “exciting” are really bad for Wall Street.  Investors like a world that is predictable, and when conditions start changing rapidly they get very, very nervous.

In the months ahead, trillions of dollars are going to be lost in stock markets all over the planet.  Feel bad for the retirees and the hard working families that are going to get wiped out by this, but don’t feel bad for the banksters.  They have been laughing it up while most of the country has been suffering during our ongoing economic decline.  If you don’t believe me, just check out this YouTube clip.

A lot of people are going to be paralyzed during this time, because they won’t know what to do.  They didn’t heed the warnings up until now, and they thought that they would be able to safely get out of the market when things started getting crazy.  The big ups and big downs in the markets will confuse them, and the mainstream media will be telling them that everything is just fine.

If you have been waiting for the market to send you “warning signals”, then you can stop waiting because it is happening right in front of your eyes.

Now is not a time for fear.  Personally, I seek to live my live in a constant state of peace without any fear even though I write about some very hard realities almost every day.

This is part of the reason why I so adamantly encourage people to prepare for what is ahead.  Knowledge and preparation can help eliminate fear.

If you already know what is coming and you are already prepared for it, you won’t be freaking out like the rest of the general population will be when things start really going crazy.

I want to share something with you that Brandon Smith wrote recently

Panic betrays and fear kills. The preparedness culture is built upon the ideal that one must defeat fear in order to live. How a person goes about removing uncertainty from the mind is really up to the individual. For me, combat training and mixed martial arts is a great tool. If you get used to people trying to hurt you in a ring, it’s not quite as surprising or terrifying when it happens in the real world. If you can handle physical and mental trauma in a slightly more controlled environment, then fear is less likely to take hold of you during a surprise disaster.

Six months may be enough time to enter a state of mental preparedness, it may not be, but more than anything else, this is what you should be focusing on. All other survival actions depend on it. Your ability to function personally, your ability to work with others, your ability to act when necessary, all rely on your removal of fear. Take the precious time you have now and ensure you are ready to handle whatever the future throws at you.

Life in America in the years ahead is going to look dramatically different from what life in America looks like right now.

Do you have some specific tips on getting prepared for what is coming that you would like to share with the rest of us?  Please feel free to join the discussion by posting a comment below…

A Death Cross, Wild Market Swings And A Currency War – And We Haven’t Even Gotten To September Yet

Financial Despair - Public DomainThings continue to line up in textbook fashion for a major financial crisis by the end of 2015.  This week, Wall Street has been buzzing about the first “death cross” that we have seen for the Dow since 2011.  When the 50-day moving average moves below the 200-day moving average, that is a very important psychological moment for the market.  And just like during the run up to the stock market crash of 2008, we are starting to witness lots of wild swings up and down.  The Dow was up more than 200 points on Monday, the Dow was down more than 200 points on Tuesday, and it took a nearly 700 point roundtrip on Wednesday.  This is exactly the type of behavior that we would expect to see during the weeks or months leading up to a crash.  As any good sailor will tell you, when the waters start getting very choppy that is not a good sign.  Of course what China is doing is certainly not helping matters.  On Wednesday, the Chinese devalued the yuan for a second day in a row, and many believe that a new “currency war” has now begun.

So what does all of this mean?

Does this mean that the time of financial “shaking” has now arrived?

Let’s start with what is happening to the Dow.  When the 50-day moving average crosses over the 200-day moving average, it is a very powerful signal.  For example, as Business Insider has pointed out, if you would have got into stocks when the 50-day moving average moved above the 200-day moving average in December 2011, you would have experienced a gain of 43 percent by now…

The Dow Jones Industrial Average has been on an unrelenting upward trajectory since its October 2011 low.

The signal that convinced many traders that the market was now moving with a bullish bias was when the 50-day moving average of the index price rose above the 200-day moving average a couple of months later at the end of December.

Since then the market rallied 6,200 points to a high of 18,333 before pulling back to last night’s close of 17,404. That’s a gain of around 43% even though the market is 5% off its high.

But now a cross is happening in the other direction.  That is why it is called a “death cross”.  It is quite understandable why a lot of investors are freaking out about the fact that the 50-day moving average has moved below the 200-day moving average for the first time in four years.  Every major stock market in history has been preceded by a death cross.

Of course no indicator is perfect.  Sometimes these death crosses come just before market crashes, and other times nothing much seems to happen.  The following comes from MarketWatch

The 50-day moving average (or “MA”) crossed below a rising 200-day MA on July 7, 2010, when the Dow closed at 10,018.28. The Dow’s closing low for 2010 was actually hit two sessions earlier, at 9,686.48.

But the Dow fell another 5.9% over six weeks after the Aug. 24, 2011 death cross, and tumbled as much as 50% over 14 months after the one appearing on Jan. 3, 2008.

And keep in mind that when the January 2008 death cross appeared, the Dow had lost just 7.8% from its Oct. 9, 2007 peak. That means the bull market was still firmly in place, as the rule of thumb is a bear market is defined by a decline of at least 20% from a significant peak. In addition, the 200-day moving average didn’t turn lower until two weeks after the death cross appeared.

But this is not the only indicator pointing to trouble ahead.  Even while we have many stocks hitting 52-week highs, we also have an extraordinary number hitting 52-week lows.  This is called a “split market”, and this is a very ominous sign.  In fact, according to Peter Boockvar 62 percent of all stocks on the New York Stock Exchange are already trading below their 200-day moving average…

Peter Boockvar, market strategist at Lindsey Group, said he believes the market is in a correction that began a few weeks ago, starting with commodities names getting hit. The small-cap Russell 2000 was also a leader of the declines. “The key is it’s infecting other areas of the market. You have every headwind and every reason to continue this correction,” he said.

Going into today, 62 percent of the NYSE stocks were trading below the 200-day moving average,” said Boockvar. “More and more companies are dropping out of the bull market.”

At this point, we have already had more than 50 “split days” this year.  King World News has just released an article which has pointed out this has only happened four times before, and a major stock market crash has followed each occurrence…

The only other times in history we’ve seen more than 50 split days during the past year were March 1968, August 1972, October 2000 and July 2006.

After all four of those, stocks lost more than a third of their value at some point during the next two years.

Are you starting to see?

A stock market crash is coming.

Another thing that has investors concerned is the fact that we have seen a large divergence between high yield credit and stocks.  As Bloomberg has pointed out, when this happens a significant stock market decline follows more than 70 percent of the time…

While not without precedent, instances when anxiety in bonds didn’t seep into equities are rare. More than 70 percent of the time since 1996, as spreads widened as much as they have since April, the S&P 500 has fallen, with the average decline exceeding 10 percent, data compiled by Bloomberg show.

This is something that sooner or later is going to impact the stock market,” said Russ Koesterich, global chief investment strategist at New York-based BlackRock Inc., which oversees $4.7 trillion. “Credit market conditions have not been benign and easy as where they were last summer.”

On top of everything else, it looks like a global currency war could be erupting.

According to USA Today, this desperate move by China to devalue the yuan may indicate that the Chinese economy is in far worse shape than most had thought…

One, China’s move suggests that its economy is in worst shape than believed. “It highlights the fragility of the global economy,” says Donald Luskin, chief investment officer at TrendMacro. Second, a weaker yuan means a stronger dollar, and a stronger dollar means U.S. products sold in China are more expensive, which means fewer sales of Apple iPhones, hotel rooms offered by Wynn Resorts and computer chips made by Micron Technology.

Lastly, there is a fear that other nations will respond to China by devaluing their own currencies to stay competitive.

When people start talking about ‘currency wars,’ it’s never a good thing,” says Michael Farr, president of money-management firm Farr, Miller & Washington. “China’s move to devalue its currency could be the first shot across the bow towards a wider currency war.”

As I discussed yesterday, it seems like the phrase “currency war” has been thrown around a lot lately.

But what would that look like, and what would that mean for the global economy?

Well, former IMF economist Stephen Jen is suggesting that we could soon see major currencies all over the planet being devalued by up to 50 percent

[The] devaluation of the yuan risks a new round of competitive easing that may send currencies from Brazil’s real to Indonesia’s rupiah tumbling by an average 30 percent to 50 percent in the next nine months, according to investor and former International Monetary Fund economist Stephen Jen.

Volatility measures were already signaling rising distress in emerging markets even before China’s shock move. An index of anticipated price swings climbed above a rich-world gauge at the end of July, reversing the trend seen for most of the past six months.

The surging U.S. dollar combined with crashing prices for commodity exports has already created a state of crisis in South America.  If emerging markets such as Brazil are forced to devalue their currencies to stay competitive with nations such as China, that is going to just exacerbate the problems.

For a long time, things in the financial world were pretty quiet.

But now events are beginning to accelerate.

A lot of people are extremely concerned about what is going to happen in September, and I think that there are very good reasons to be concerned.

Throughout our history, the majority of our stock market crashes have happened in the fall.  Just remember what happened in 1929, 1987 and 2008.

Now we are approaching that time of the year once again, and things are lining up perfectly for a major financial crisis.

So what do you personally think will happen?  Please feel free to join the discussion by posting a comment below…

The Dow Has Already Fallen Nearly 900 Points From The Peak Of The Market

Financial Crisis Stocks - Public DomainIn an eerie repeat of what we witnessed in 2008, U.S. stocks are steadily sliding throughout the summer as we head toward the month of September.  From August 1st, 2008 to September 1st, 2008 the Dow fell by nearly 700 points.  And of course we all remember what happened the following month.  Right now, we are watching a similar thing happen.  The Dow has plummeted nearly 700 points since July 16th, and it is down nearly 900 points from the peak of the market back in May.  At this point the Dow has now fallen for six days in a row and eleven of the last thirteen.  Of course most of the talking heads on television are still insisting that everything is going to be just fine and that a repeat of 2008 is not possible.  So what do you think?  Should we trust them?

Personally, I find that I put a lot more faith in cold, hard numbers than in what the talking heads on television have to say.  And at this moment, the cold, hard numbers are telling us that another financial crisis in imminent.

This is one of the reasons why I am such a fan of Zero Hedge.  Nobody stays on top of the hard financial numbers like Zero Hedge does.  And according to Zero Hedge, market internals are absolutely screaming that a U.S. stock market crash is right around the corner

In early 2007, market internals began to weaken dramatically. Talking heads and asset gatherers said fears were overblown, risk was contained, Fed has it under control, stay the course. Six months later, the equity markets began to collapse and then accelerated lower. Today, in an eery case of deja vu all over again, it has been six months now since US equity market internals began to decouple from the manipulated index levels that manufacture wealth and happiness across America… what would you do?

Here is the chart that immediately followed that paragraph.  As you can see, we are repeating the exact same pattern that we witnessed back during the last financial crisis…

Internals - Zero Hedge chart

Meanwhile, the second largest stock market in the world is already crashing.  The Chinese have spent approximately 1.3 trillion dollars propping up stocks in China, but they just continue to fall.  They were down again on Wednesday night, and nobody is quite sure when the carnage is going to end.

And remember, Chinese stocks started to crash before U.S. stocks did in 2008 as well.

Another eerie similarity to 2008 is the behavior of oil.  In the summer of 2008, the price of oil crashed hard, and then a stock crash followed a couple of months later.

Well, guess what?

The price of oil is crashing hard once again.  The following comes from CNBC

Oil set multi-month lows on Thursday as investors and traders sought clues about the market’s next bottom after a large drop in U.S. crude inventories failed to boost prices.

A bigger-than-expected build in U.S. gasoline stockpiles last week proved more important to investors than crude storage numbers that came in three times below forecast on Wednesday.

U.S. crude was down 50 cents at $44.65 a barrel at 1:30 p.m. EDT (1730 GMT), after touching a 4½ month bottom at $44.20.

Why can’t more people see the signs?

They are so obvious.

We are also getting indications that the real economy is starting to be affected by all of this chaos.  The mainstream media has been very quiet about this, but the number of job cuts just hit a four year high

Challenger, Gray & Christmas has released its monthly job cuts for July, and it is ugly. The 105,696 job cuts was the highest number since 2011. To put this in perspective, the July job cuts total is a whopping 136% higher than the 44,842 job cuts reported in June, as well as 125% higher than the in same report a year ago.

The July report showed that the last time more than 100,000 job cuts were announced was back in September 2011, when there were some 115,730 layoffs.

Another bad trend is that July’s surge now brings the year-to-date job cuts up to a total of 393,368. That is 34% higher than the run rate for the same period in 2014.

If alarm bells are going off in your head right now, that is good, because they should be.

A 34 percent increase in job cuts is not a good thing.

Of course it would probably help if the Obama administration was not bringing in far more immigrant workers than the limits that have been officially set by Congress.  Just check out these numbers

In written responses to the Senate Judiciary Immigration and the National Interest Subcommittee Republicans obtained by Breitbart News, U.S. Citizenship and Immigration Services reveal that the Obama administration has been approving work authorizations for immigrants beyond admission limits and for some categories of immigrants that Congress never intended to work in the U.S.

Beyond those limits each year, these new and renewed work permit approvals amounted to about 1.23 million in fiscal year 2009, 1.08 million in FY 2010, 970,277 in FY 2011, 1.24 million in FY 2012, 1.68 million in FY 2013 and 1.24 million in FY 2014.

Also, this is the first time that imports and exports have both been declining on a year over year basis since the last recession.  Just check out this chart and this chart.

When imports and exports are both falling, that means that economic activity is slowing down.  And we are seeing a similar thing happen all over the planet.  At this point, global trade has fallen by a total of about 2 percent over the past six months.

Are you starting to get the picture?

Just like in the summer of 2008, global economic activity is diminishing and things in the financial world are lining up in textbook fashion for a major crisis.

But for those that are not convinced by now, there is not that much more that I can do.  I could keep throwing out numbers and charts and graphs, but if people refuse to see the truth they simply will not see it.

Less than a month from now, we will officially be in the danger zone.

September is coming, and I truly hope that you are already prepared for it.

Stocks Began Falling Right At This Time Of The Year Just Prior To The Last Financial Crisis

Stock Market Crash Bear - Public DomainHave you heard of the saying “sell in May and go away”?  Traditionally, the period from May through October has been a time of weakness for stocks.  In fact, on average stocks hit their lowest point of the year on October 27th.  And most people don’t remember this, but the Dow Jones Industrial Average actually began plunging right at this time of the year just prior to the financial crisis of 2008.  Most people do remember the huge stock crash that happened in the fall of that year, but the market actually started to slide in May.  Throughout the first four and a half months of 2008, stocks moved up and down in a fairly narrow range, and the Dow closed at a short-term peak of 13,028.16 on May 19th.  From there it was all downhill for the rest of the year.  So will a similar thing happen in 2015 as we approach the next great financial crisis?  Since March 20th, the Dow Jones Transportation Average has already fallen by almost 800 points.  So will the Dow Jones Industrial Average soon follow?  Well, only time will tell, but the Dow was down 190 points on Tuesday.  Signs of trouble are popping up all over the place, and the “smart money” is getting out while the getting is good.

The chart that I have posted below shows how the Dow Jones Industrial Average performed during 2008.  As you can see, stocks began plummeting long before the financial crisis in the fall.  From May 19th through early July, the Dow fell by about 2,000 points.  Should we expect to see a similar pattern this summer?…

Dow Jones Industrial Average 2008

Like I stated earlier in this article, red flags and warning signs are starting to pop up all over the place.  The following are just a few of the trouble signs that we have seen this week…

-On Tuesday, the VIX (a closely watched measure of market volatility) jumped by the highest percentage that we have seen so far in 2015.  As I have explained so often before, markets tend to go up in calm markets and they tend to go down in volatile markets.  So the fact that volatility is on the rise is not a good sign.

-The U.S. dollar index is surging again.  In fact, we just witnessed the largest seven day rise in the U.S. dollar index since the collapse of Lehman Brothers.  This is another indication that big trouble is ahead.  For much more on this, please see my previous article entitled “Guess What Happened The Last Time The U.S. Dollar Skyrocketed In Value Like This?…

-Thanks to the ongoing Greek crisis, the euro is falling again.  It just hit a fresh one-month low, and if I am right it is going to go quite a bit lower as the European financial crisis intensifies.

-In the U.S., orders for durable goods have fallen year over year for four months in a row.  When orders for durable goods start going negative for a few months, it is usually a signal that we are entering a recession.

-After rebounding a little bit, the price of crude oil is falling again.  It just hit a new one-month low, and the number of oil rigs in operation has declined for 24 weeks in a row.  Once again, this is highly reminiscent of what happened back in 2008.

-Unfortunately, it isn’t just oil that is declining.  A whole host of other commodity prices are going down right now as well.  This happened just prior to the financial crisis of 2008, and it is a sign that we are heading into a deflationary economic slowdown.

The reason why I talk so much about what happened the last time around is that we should be able to learn from it.

Looking back, there were so many warning signs leading up to the financial crisis of 2008 but most people totally missed them.  Now, so many of those exact same signs are appearing once again, but they are being ignored.

Only this time the global financial system is in far worse shape than it was back in 2008.  Debt levels all over the planet have absolutely exploded over the past seven years, and the debt to GDP ratio for the entire world is now up to a mind blowing 286 percent.  In the United States, our national debt has approximately doubled since just prior to the last recession, and at this point it is mathematically impossible to pay it off.  We are in the midst of the greatest stock market bubble of all time, the greatest bond bubble of all time (76 trillion dollars) and the greatest derivatives bubble of all time.  Anyone that cannot see the trouble that is approaching is willingly blind.

In the western world, we have extremely short attention spans and we suffer deeply from something called “normalcy bias”.  The following is how “normalcy bias” is defined by Wikipedia

The normalcy bias, or normality bias, is a mental state people enter when facing a disaster. It causes people to underestimate both the possibility of a disaster and its possible effects. This may result in situations where people fail to adequately prepare for a disaster, and on a larger scale, the failure of governments to include the populace in its disaster preparations.

The assumption that is made in the case of the normalcy bias is that since a disaster never has occurred then it never will occur. It can result in the inability of people to cope with a disaster once it occurs. People with a normalcy bias have difficulties reacting to something they have not experienced before. People also tend to interpret warnings in the most optimistic way possible, seizing on any ambiguities to infer a less serious situation.

That is such a perfect description of what is happening in the western world today.  But just because things have always been a certain way in our past does not mean that they will continue to be that way in the future.  A great economic storm is rapidly approaching, and the signs of the times are all around us.

Hopefully more people will start listening to the warnings, because we have almost run out of time to prepare.

This Is Exactly How Markets Behave Right Before They Crash

Roller Coaster - Photo by NeukolnWhen the stock market starts to behave like a roller coaster, that is a sign that a major move to the downside is right around the corner.  As I have stated repeatedly, when the market is very calm it tends to go up.  But when the waters start getting really choppy, that is a clear indication that stocks are about to plummet.  In early 2015, volatility has returned to Wall Street in a big way.  At one point on Tuesday, the Dow was up more than 300 points.  But then the bottom dropped out.  From the peak on Tuesday, the Dow plunged nearly 700 points in less than 30 hours before recovering more than 100 points at the end of the day.  The Dow has now experienced the longest losing streak that we have seen in 3 months, but that is not that big of a deal.  Of much greater concern is the huge price swings that we have been seeing. Remember, the three largest single day stock market increases in history were right in the middle of the financial crisis of 2008.  So if stocks go up 400 points tomorrow that is NOT a good sign.  What we really need is a string of days when stocks move less than 100 points in either direction.  If stocks keep making dramatic moves up and dramatic moves down, history tells us that it is only a matter of time before they collapse.  Any student of stock market history knows that what we are witnessing right now is exactly how markets behave right before they crash.

Examine the chart below very carefully.  It is a chart of the CBOE Volatility Index from 2006 to 2008.  As you can see, volatility was very low as stocks soared during 2006.  Then things started to get a bit choppy in 2007, and investors should have recognized this as a warning sign.  Finally, you can see that the VIX absolutely skyrocketed during the financial crisis of 2008…

VIX 2006 to 2008

Looking back, it seems so obvious.

So why aren’t more people alarmed this time around?

As CNN is reporting, the VIX is up almost 20 percent so far in 2015…

Volatility has returned with a vengeance this January. The Dow has been moving up or down by at least 100 points nearly every day this year.

CNNMoney’s Fear & Greed Index is showing signs of Extreme Fear again. And a volatility gauge known as the VIX, which is one of the components in our index, is up nearly 20% so far this year.

Meanwhile, there are lots of other signs of trouble on the horizon as well.

For example, the price of copper got absolutely hammered on Wednesday.  As I write this, it has fallen more than 5 percent and it has not been this low in more than five years.

In financial circles, it is referred to as “Dr. Copper” because it is such a valuable indicator regarding where the global economy is heading next.

For example, in 2008 the price of copper was close to $4.00 before plummeting to below $1.50 by the end of that year as the global financial system fell apart.

Now the price of copper is plunging again, and many analysts are becoming extremely concerned

One growing global worry is the steep decline in copper, which is used in many products and is often viewed as good gauge on how China is doing. The price of copper hit its lowest price since 2009 on Wednesday at $2.46. Copper is down nearly 7% this week alone.

Meanwhile, the recession (some call it a depression) in Europe continues to get even worse, and the euro continues to plunge.

On Wednesday, the euro declined to the lowest level that we have seen in nine years, and Goldman Sachs is now saying that the euro and the U.S. dollar could be at parity by the end of next year.

That is amazing considering the fact that it took $1.60 to get one euro back in July 2008.

Personally, I am fully convinced that Goldman Sachs is right on this one.  I believe that the euro is going to all-time lows that we have never seen before, and this is going to create massive problems for the eurozone.

With all of these signs of trouble out there, the smart money is rapidly pulling their money out of stocks and putting it into government bonds.  This usually happens when a crisis is looming.  It is called a “flight to safety”, and it pushes government bond yields down.

On Wednesday, the yield on 10 year U.S. Treasuries fell beneath the important 1.8 percent barrier.  We will probably see it go even lower in the months ahead.

As the rest of the world economy crumbles, the remainder of the globe is looking to America to be the rock in the storm.  For example, the following quote that I found today comes from a British news source

The global economy is running on a single engine… the American one,’ the World Bank’s chief economist, Kaushik Basu, said. ‘This does not make for a rosy outlook for the world.’

Well, they may not want to rely on us too much, because there are plenty of signs that our economy is slowing down too.  For example, we learned today that December retail sales were down 0.9% from a year ago, and this is being called “an unmitigated disaster“.  Americans were supposed to be taking the money that they were saving on gasoline and spending it, but that apparently is not happening.

Back on October 29th, I wrote an article entitled “From This Day Forward, We Will Watch How The Stock Market Performs Without The Fed’s Monetary Heroin“.  In that article, I warned that the end of quantitative easing could have dire consequences for the financial system as bubbles created by the Fed began to burst.

And that is precisely what is happening.  In fact, many analysts are now pinpointing the end of QE as the exact moment when our current troubles began.  For instance, check out this excerpt from a CNBC article that was published on Wednesday

Stuff happens when QE ends,” said Peter Boockvar, chief market analyst at The Lindsey Group. “It’s no coincidence that the market started going into a higher volatility mode, it’s no coincidence that the decline in commodity prices accelerated, it’s no coincidence that the yield curve started flattening when QE ended.”

Indeed, the increase in volatility and its effect on prices across the capital market spectrum was closely tied to the Fed ending the third round of QE in October.

We are moving into a time of great danger for Wall Street and for the global economy as a whole.

If we continue to see a tremendous amount of volatility, history tells us that it is only a matter of time before the markets implode.

Hopefully you will be ready when that happens.

Do Wall Street Insiders Expect Something Really BIG To Happen Very Soon?

Do Wall Street Insiders Expect Something Really BIG To Happen Very Soon? - Photo by nosha on flickrWhy are corporate insiders dumping huge numbers of shares in their own companies right now?  Why are some very large investors suddenly making gigantic bets that the stock market will crash at some point in the next 60 days?  Do Wall Street insiders expect something really BIG to happen very soon?  Do they know something that we do not know? What you are about to read below is startling.  Every time that the market has fallen in recent years, insiders have been able to get out ahead of time.  David Coleman of the Vickers Weekly Insider report recently noted that Wall Street insiders have shown “a remarkable ability of late to identify both market peaks and troughs”.  That is why it is so alarming that corporate insiders are selling nine times as many shares as they are buying right now.  In addition, some extraordinarily large bets have just been made that will only pay off if the financial markets in the U.S. crash by the end of April.  So what does all of this mean?  Well, it could mean absolutely nothing or it could mean that there are people out there that actually have insider knowledge that a market crash is coming.  Evaluate the evidence below and decide for yourself…

For some reason, corporate insiders have chosen this moment to unload huge amounts of stock.  According to a CNN article, corporate insiders are now selling nine times more of their own shares than they are buying…

Corporate insiders have one word for investors: sell.

Insiders were nine times more likely to sell shares of their companies than buy new ones last week, according to the Vickers Weekly Insider report by Argus Research.

What makes this so alarming is that corporate insiders have been exceedingly good at “timing the market” in recent years.  The following comes from a recent CNBC article entitled “Sucker Alert? Insider Selling Surges After Dow 14,000“…

“In almost perfect coordination with an equity market that was rushing toward new all-time highs, insider sentiment has weakened sharply — falling to its lowest level since late March 2012,” wrote David Coleman of the Vickers Weekly Insider report, one of the longest researchers of executive buying and selling on Wall Street. “Insiders are waving the cautionary flag in an increasingly aggressive manner.”

There have been more than nine insider sales for every one buy over the past week among NYSE stocks, according to Vickers. The last time executives sold their company’s stock this aggressively was in early 2012, just before the S&P 500 went on to correct by 10 percent to its low for the year.

“Insiders know more than the vast majority of market participants,” said Enis Taner, global macro editor for RiskReversal.com. “And they’re usually right over a long period of time.”

There are other indications that the stock market may be headed for a significant tumble in the months ahead.  For example, as a Zero Hedge article recently pointed out, the last time that the financial markets in the U.S. were as “euphoric” as they are now was right before the financial crisis of 2008.

And as I mentioned above, some people out there have recently made some absolutely jaw-dropping bets against stocks which will only pay off if there is a financial crash at some point in the next few months.

According to Business Insider, the recent purchase of 100,000 put options by a mystery investor has a lot of people on Wall Street talking…

According to Barron’s columnist Steven Sears, someone made a big bet against the financials ETF yesterday (ticker symbol XLF), and it has everybody buzzing.

The trader bought 100,000 put options on the ETF (a put option increases in value when the price of the underlying asset, in this case, the ETF, goes down).

To put that number in perspective, Sears writes, “Few investors ever trade more than 500 contracts, so a 100,000 order tends to stop traffic and prompt all sorts of speculation about what’s motivating the trade.” According to Sears, the trade “has sparked conversations across the market.”

Reportedly, those put options expire in April.

And as Art Cashin of UBS has noted, there was also another extremely large bet that was placed recently that is banking on a financial crash within the next two months…

A Very Big Bet In A Somewhat Unlikely Instrument – My friend, Jim Brown, the ever-alert consummate professional over at Option Investor pointed us to a rather unusual trade. Here’s what he wrote in last night’s edition of his valuable newsletter:

In past years I have reported on trades that were so large it appeared someone had inside knowledge of a pending event. Sometimes those were massive put positions on the S&P. A new trade just appeared that suggests there will be a market event in the near future. Last week somebody put on a call spread on the VIX using the April 20 and 25 puts. They bought 150,000 contracts for a net of $75 per contract. That is an $11,250,000 bet that the VIX will move over 20 over the next 60 days. You would have to be VERY confident in your outlook to risk $11 million on a directional position with the VIX at five year lows and the markets trying to break out to new highs.

So does all of this guarantee that the stock market is going to move a certain way?

Of course not.

But when you step back and look at the bigger picture, it does appear that Wall Street insiders are preparing for something.

Meanwhile, the government continues to assure us that happy days are here again for the U.S. economy and that we don’t have anything to worry about.

The Congressional Budget Office has just released a report that contains their outlook for the next decade.  The report is entitled “The Budget and Economic Outlook: Fiscal Years 2013 to 2023”, and if you want a good laugh you should read it.

Here are some of the things that the CBO believes will happen…

-The CBO believes that government revenues will more than double by 2023.

-The CBO believes that government revenue as a percentage of GDP will rise from 15.8 percent today to 19.1 percent in 2023.

-The CBO believes that the unemployment rate will continually fall over the next decade.

-The CBO believes that the federal budget deficit will fall to just 2.4% of GDP in fiscal year 2015.

-The CBO believes that the federal budget deficit will only be $430 billion in 2015.

-The CBO believes that we will not have a single recession over the next decade.

-The CBO believes that inflation will stay at about 2 percent for the next decade.

-The CBO believes that U.S. GDP will grow by a total of 67 percent by 2023.

Wow, all of that sounds great until you go back and take a look at how CBO projections have fared in the past.

In fact, Bruce Krasting has gone back and looked at the numbers from the Congressional Budget Office’s Budget and Economic Outlook 2003.  I think that you will find the differences between the CBO projections and what really happened to be very humorous…

Estimated 10-year budget surplus = $5.6T.

Reality = $6.6T deficit. A 200+% miss.


Estimate for 2012 Debt Held by Public = $1.2T (5% of GDP).

Reality = Debt Held by Public = $11.6T. A 1000% miss.


Estimated fiscal 2012 GDP = $17.4T.

Reality = $15.8T. A $1.6T (10%) miss.

So should we trust what the CBO is telling us now?

Of course not.

Instead, perhaps we should listen to some of the men that successfully warned us about the last financial crisis…

-“Dr. Doom” Marc Faber recently stated that he “loves the high odds of a ‘big-time’ market crash“.

-Economist Nouriel Roubini says that we should “prepare for a perfect storm“.

-Pimco’s Bill Gross says that we are heading for a “credit supernova“.

-Nomura’s Bob Janjuah believes that the financial markets will experience one more huge spike before collapsing by up to 50%

I continue to believe that the S&P500 can trade up towards the 1575/1550 area, where we have, so far, a grand double top. I would not be surprised to see the S&P trade marginally through the 2007 all-time nominal high (the real high was of course seen over a decade ago – so much for equities as a long-term vehicle for wealth creation!). A weekly close at a new all-time high would I think lead to the final parabolic spike up which creates the kind of positioning extreme and leverage extreme needed to create the conditions for a 25% to 50% collapse in equities over the rest of 2013 and 2014, driven by real economy reality hitting home, and by policymaker failure/loss of faith in “their system”.

The truth is that no matter how much money printing the Federal Reserve does, it is only a matter of time before the financial markets catch up with economic reality.

The U.S. economy has been in decline for a very long time, and things just continue to get even worse.  Here are just a few numbers…

-The percentage of the civilian labor force that is employed has fallen every single year since 2006.

-According to John Williams of shadowstats.com, truly accurate numbers would show that U.S. GDP growth has actually been continuously negative all the way back to 2005.

-U.S. families that have a head of household that is under the age of 30 have a poverty rate of 37 percent.

-One recent survey found that nearly half of all Americans are living on the edge of financial ruin.

-According to the U.S. Census Bureau, there are more than 146 million Americans that are considered to be either “poor” or “low income” at this point.

For many more statistics that demonstrate that the U.S. economy has continued to decline in recent years, please see this article: “37 Statistics Which Show How Four Years Of Obama Have Wrecked The U.S. Economy“.

So where is all of this headed?

Well, after the next major financial crisis in America things are going to get very tough.

We can get a hint for how things are going to be by taking a look at what is going on over in Europe right now.

Can you imagine people trampling each other for food?  That is what is happening in Greece.  Just check out this excerpt from a Reuters article

Hundreds of people jostled for free vegetables handed out by farmers in a symbolic protest earlier on Wednesday, trampling one man and prompting an outcry over the growing desperation created by economic crisis.

Images of people struggling to seize bags of tomatoes and leeks thrown from a truck dominated television, triggering a bout of soul-searching over the new depths of poverty in the debt-laden country.

The suffering that the Greeks are experiencing right now will come to this country soon enough.

So enjoy this false bubble of debt-fueled prosperity while you can.  It is going to end way too soon, and after that there will be a whole lot of pain.

Wall Street - Photo by Andrés Nieto Porras

The Federal Reserve Saves The Stock Market?

The Federal Reserve has saved the stock market!  Well, at least for a day.  That was one heck of a “dead cat bounce” that we saw on Tuesday.  Normally, after the kind of dramatic decline that we saw on Monday there is some sort of a rebound, but on Tuesday the market did not begin to soar until the Federal Reserve pledged to leave interest rates near zero until mid-2013.  Once the Fed made their announcement, the market went haywire.  At one point the Dow was down more than 200 points, but by the end of the day it was up 430 points.  It was a desperate move for the Federal Reserve to pledge not to raise interest rates for the next two years, and it has stabilized financial markets for the moment.  But what is the Fed going to do to save the stock market when it starts crashing next week or next month?  The underlying financial fundamentals continue to get worse and worse.  Europe is a mess, Japan is a mess and the United States is a mess.  The Federal Reserve can try to keep all of the balls in the air for as long as possible, but at some point the juggling act is going to end and the house of cards is going to come crashing down.

This move may calm nerves for a day or two, but there is still a tremendous amount of fear out there at the moment.  Many investors are pouring money into “safe havens” right now.  Huge amounts of cash are being poured into U.S. Treasuries and the price of gold is absolutely soaring.  The price of gold is up about $220 in just the last 30 days alone.

So how high could the price of gold go in the coming months?  Well, analysts at JP Morgan are forecasting that the price of gold could hit $2,500 by the end of this year.

Yes, that is how wild things are becoming.  The Federal Reserve is painting itself into a corner.  Never before has the Fed pledged to leave interest rates near zero for the next two years.  The following is an excerpt from the statement that the Fed released earlier today….

To promote the ongoing economic recovery and to help ensure that inflation, over time, is at levels consistent with its mandate, the Committee decided today to keep the target range for the federal funds rate at 0 to 1/4 percent.  The Committee currently anticipates that economic conditions–including low rates of resource utilization and a subdued outlook for inflation over the medium run–are likely to warrant exceptionally low levels for the federal funds rate at least through mid-2013.  The Committee also will maintain its existing policy of reinvesting principal payments from its securities holdings.  The Committee will regularly review the size and composition of its securities holdings and is prepared to adjust those holdings as appropriate.

Needless to say, the rest of the world is not pleased by this nonsense from the Fed.  Yes, the Fed has stabilized financial markets for the moment, but a lot of ill will is being created with the rest of the globe.  The following is what Bruce Krasting had to say about how the rest of the world is going to react to this latest Fed move….

Brazil, Argentina, Korea, Indonesia are going to scream bloody murder over perpetual ZIRP. Russia is likely to get downright ugly with their rhetoric. I wouldn’t be surprised if they took this opportunity to vote with their feet and just abandon the dollar as a reserve holding. China will also make noise. They will make more calls for a new international currency to replace the dollar. The Central bankers in Japan and Switzerland are puking in the trashcan over this. Bernanke is exporting US deflation to them. Shame on the Fed for pursuing Beggar my neighbor policies. They deserve all the global criticism they are about to get.

The Federal Reserve is using up all of the ammunition it has available and the game has barely even begun.

Things are going to get a lot worse.  The U.S national debt continues to pile up at lightning speed.  The debt ceiling deal essentially does nothing to fix our debt problems.  Thousands of businesses and millions of jobs continue to leave the United States.  As a nation, we are constantly becoming poorer and we are constantly getting into more debt.

Meanwhile, Europe is on the verge of a financial meltdown and Japan has a “zombie economy” at this point.

Many fear that we could be on the verge of another major global recession.  The following is how a recent Der Spiegel article described the current global financial situation….

Many economists have been pointing out that last week’s panic resembled the fear that swept financial markets after the collapse of US investment bank Lehman Brothers in September 2008.

Then as now, banks stopped lending each money. Then as now, banks’ cash deposits at the central bank doubled within days. The European Central Bank reacted by assuring banks of unlimited liquidity in the coming months. It was an emergency measure that led to short-term relief but sparked anxious questions among bankers and stock market players. How long can the central bank keep up its market-soothing liquidity operations before it finally loses its credibility, the most important asset of a central bank? Is the financial crisis about to escalate?

In the old days, the U.S. and Europe could just borrow gigantic stacks of cash in order to solve any problems.  But now things are dramatically changing.

China’s official news agency recently stated that the U.S. needs to understand that things are different now….

“The U.S. government has to come to terms with the painful fact that the good old days when it could just borrow its way out of messes of its own making are finally gone”

Not that the U.S. government and the Federal Reserve are going to suddenly give up their old habits.  The U.S. government is addicted to debt and the Fed is addicted to printing money.  When push comes to shove, they are going to resort to their favorite tricks.

But at some point the rest of the world is not going to play along anymore.  When that moment arrives, it is going to be very interesting to see what happens.

Meanwhile, the U.S. economy continues to slowly unravel, and people in this country are getting very angry.  Millions of Americans families are barely scraping by right now.  Most Americans just want someone to “fix” things, but unfortunately there are no easy “fixes” to our financial problems.

As our economic problems grow even worse, frustration inside the United States is going to continue to escalate.  A brand new Rasmussen survey found that only 17 percent of Americans now believe that the U.S. government has the consent of the governed.

That was a brand new all-time low.

Faith in the major institutions of our society is already dangerously low and the economy is not even that bad yet.

As horrible as things are now, the truth is that this is rip-roaring prosperity compared to what is coming.

In the months and years ahead, America is going to be greatly tested.  As the recent London riots have shown, things can spiral out of control very quickly.

When the economy completely collapses will America be able to handle it?