 Reckless money printing by Federal Reserve Chairman Ben Bernanke has pumped up the Dow to a brand new all-time high. So what comes next? Will the Dow go even higher? Hopefully it will. In fact, it would be great if the Dow was able to hit 15,000 before it finally came crashing down. That would give all of us some more time to prepare for the nightmarish economic crisis that is rapidly approaching. As you will see below, the U.S. economy is in far, far worse shape than it was the last time the Dow reached a record high back in 2007. In addition, all of the long-term trends that are ripping our economy to shreds just continue to get even worse and our debt just continues to explode. Unfortunately, the Dow has become completely divorced from economic reality in recent years because of Fed manipulation. All of this funny money that the Federal Reserve has been cranking out has made the wealthy even wealthier, but this bubble will not last for too much longer. What goes up must come down. And remember, a bubble is always biggest right before it bursts.
Fortunately, it looks like an increasing number of people out there are starting to recognize that the primary reason why stocks have been going up is because of the Fed. Just check out this excerpt from a recent article by the USA Today editorial board…
The Federal Reserve’s purchases have driven interest rates to near zero. This has stimulated the economy but not without cost. Savers, particularly older ones trying to live on income from their investments, are starved for safe options. They’ve been forced into stocks, which is one reason the market has been acting as if it’s on steroids. Further, with borrowing costs low, Congress and the White House have less incentive to rein in the national debt. Rock-bottom interest rates have also distorted markets.
The best indication that the Fed’s bond-buying purchases are pushing stocks up artificially is that investors run for cover whenever there is a hint that the Fed might change course, as happened recently. On Monday, billionaire superinvestor Berkshire Hathaway CEO Warren Buffett told CNBC that markets are on a “hair trigger” waiting for signs of change from the Fed. The market is “hooked on the drug” of easy money, Dallas Fed President Richard Fisher told Reuters.
Fisher’s comparison of Fed policies to a drug is apt. Markets might not like the idea of the drug being withdrawn now, when the Fed holds a portfolio of $3 trillion. But the withdrawal symptoms will be a lot worse once the portfolio grows to $4 trillion, or more.
Those sentiments were echoed by Gordon Charlop, a trader at Rosenblatt Securities, during a recent appearance on CNBC…
“The Wizard of the Fed, Ben [Bernanke], has done a great job propping up the market, but the question is how does the wizard move the pin from the balloon without blowing the whole thing up?” said Charlop. “This is getting out of balance and he’s got to figure out a way to justify the levels that we’ve gotten to and draw back on some of the stimulus.”
Of course, in the end, the bursting of this bubble is going to be very messy.
The Fed has dramatically distorted the market in an attempt to make things look good, but now the financial markets are completely and totally addicted to easy money. Is there any chance that the Fed will be able to take away that easy money without causing disaster?
There are only a few ways that this current scenario can play out. The following is what Stanley Druckenmiller recently told CNBC…
“I don’t know when it’s going to end, but my guess is, it’s going to end very badly; and it’s going to end very badly because, again, when you get the biggest price in the world, interest rates, being manipulated you get a misallocation of resources and this is going to end in one of two ways – with a malinvestment bust which we got in ’07-’08 (we didn’t get inflation). We got a malinvestment bust because of the bubble that was created in housing. Or it could end with just monetizing the debt and off we go in inflation. So that’s a very binary outcome – they’re both bad.”
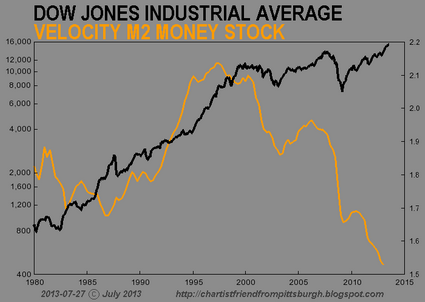
What the Fed has done to the money supply in recent years has been absolutely unprecedented. Just check out how our money supply has skyrocketed since the last financial crisis…
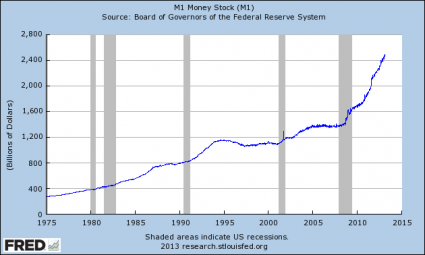
So what happens when the amount of money in an economy rises rapidly?
Well, if I remember Econ 101 correctly, that would mean that prices should go up.
And that is exactly what has happened. And since most of the money that the Fed has created has gone into the financial system first, it should not be a surprise that we have seen a bubble in financial assets.
In a previous article that I wrote last September, I warned that QE3 would cause stocks to go up…
So what have the previous rounds of quantitative easing accomplished? Well, they have driven up the prices of financial assets. Those that own stocks have done very well the past couple of years. So who owns stocks? The wealthy do. In fact, 82 percent of all individually held stocks are owned by the wealthiest 5 percent of all Americans. Those that have invested in commodities have also done very nicely in recent years. We have seen gold, silver, oil and agricultural commodities all do very well. But that also means that average Americans are paying more for basic necessities such as food and gasoline. So the first two rounds of quantitative easing made the wealthy even wealthier while causing living standards to fall for all the rest of us. Is there any reason to believe that QE3 will be any different?
Of course not.
So will stocks continue to go up indefinitely?
No way.
As I have also written about previously, the money printing that the Fed is doing right now is not nearly enough to stop the mammoth derivatives crisis that is coming.
A derivatives crisis was one of the primary reasons for the financial crash of 2008, but most Americans still have no idea what derivatives are.
They can be very complex, but I think that it is easiest just to think of them as side bets.
When someone buys a derivative, they are not buying anything real. They are simply betting that something will or will not happen.
For example, if you bet $100 that the Chicago Cubs will win the World Series this year, would you be “investing” in anything real?
Of course not.
Well, it is the same with most derivatives.
Today, Wall Street has become the biggest casino in the entire world and trillions of dollars of very reckless bets have been made.
In fact, most Americans would be absolutely shocked to learn how exposed to derivatives some of our largest financial institutions are. The following is an excerpt from one of my previous articles entitled “The Coming Derivatives Panic That Will Destroy Global Financial Markets“…
It would be hard to overstate the recklessness of these banks. The numbers that you are about to see are absolutely jaw-dropping. According to the Comptroller of the Currency, four of the largest U.S. banks are walking a tightrope of risk, leverage and debt when it comes to derivatives. Just check out how exposed they are…
JPMorgan Chase
Total Assets: $1,812,837,000,000 (just over 1.8 trillion dollars)
Total Exposure To Derivatives: $69,238,349,000,000 (more than 69 trillion dollars)
Citibank
Total Assets: $1,347,841,000,000 (a bit more than 1.3 trillion dollars)
Total Exposure To Derivatives: $52,150,970,000,000 (more than 52 trillion dollars)
Bank Of America
Total Assets: $1,445,093,000,000 (a bit more than 1.4 trillion dollars)
Total Exposure To Derivatives: $44,405,372,000,000 (more than 44 trillion dollars)
Goldman Sachs
Total Assets: $114,693,000,000 (a bit more than 114 billion dollars – yes, you read that correctly)
Total Exposure To Derivatives: $41,580,395,000,000 (more than 41 trillion dollars)
That means that the total exposure that Goldman Sachs has to derivatives contracts is more than 362 times greater than their total assets.
When the derivatives crash happens, there won’t be enough money in the entire world to fix it.
So enjoy this little stock market bubble while you can.
It will end soon enough.
And of course stocks should not be this high in the first place. The underlying economic fundamentals do not justify these kinds of stock prices whatsoever.
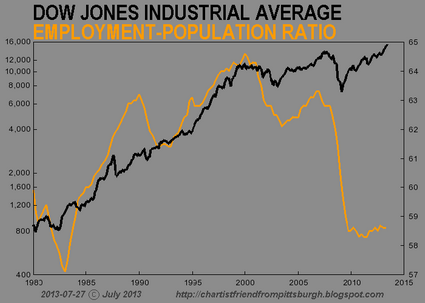
A recent CNN article noted that the last time the Dow hit a record high that unemployment in the U.S. was much lower…
Consider this. When the Dow hit its now old record high back in October 2007, the economy was still in good shape — although it was just a few months away from the beginning of the Great Recession.
The unemployment rate in October 2007 was 4.7%. In January of this year, the unemployment rate was 7.9%.
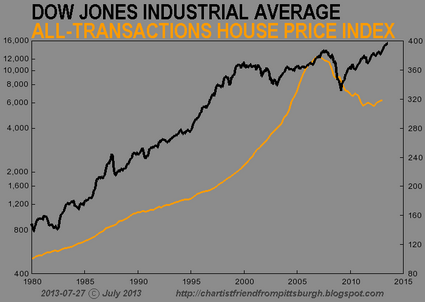
And that same article also pointed out that GDP growth and housing prices were also much stronger back in 2007…
Gross domestic product grew 3% in the third quarter of 2007. Revised figures from the government last week showed that GDP in the fourth quarter of 2012 rose a scant 0.1%. But I guess that’s good news considering the first estimate showed a 0.1% decline.
And despite all the hoopla about the steady recovery in the housing market over the past year, real estate is still in a bear market. The most recent level of the S&P Case-Shiller 20-City Home Price Index, one of the most widely watched gauges of the health of housing, is still 24% below where it was in October 2007.
We have never even come close to recovering from the last economic crisis. Most Americans seem to have forgotten how good things were back then, but a recent Zero Hedge article included some more points of comparison between October 2007 and today…
- Dow Jones Industrial Average: Then 14164.5; Now 14164.5
- Regular Gas Price: Then $2.75; Now $3.73
- GDP Growth: Then +2.5%; Now +1.6%
- Americans Unemployed (in Labor Force): Then 6.7 million; Now 13.2 million
- Americans On Food Stamps: Then 26.9 million; Now 47.69 million
- Size of Fed’s Balance Sheet: Then $0.89 trillion; Now $3.01 trillion
- US Debt as a Percentage of GDP: Then ~38%; Now 74.2%
- US Deficit (LTM): Then $97 billion; Now $975.6 billion
- Total US Debt Oustanding: Then $9.008 trillion; Now $16.43 trillion
- US Household Debt: Then $13.5 trillion; Now 12.87 trillion
- Labor Force Particpation Rate: Then 65.8%; Now 63.6%
- Consumer Confidence: Then 99.5; Now 69.6
And of course anyone that reads my site regularly knows that the U.S. economy has been in a state of persistent decline over the past several years.
Just consider the following data points…
-The percentage of the civilian labor force in the United States that is actually employed has been steadily declining every single year since 2006.
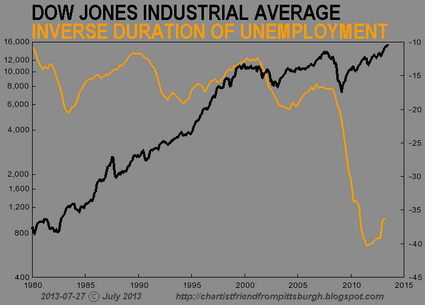
-In 2007, the unemployment rate for the 20 to 29 age bracket was about 6.5 percent. Today, the unemployment rate for that same age group is about 13 percent.
-According to one study, 60 percent of the jobs lost during the last recession were mid-wage jobs, but 58 percent of the jobs created since then have been low wage jobs.
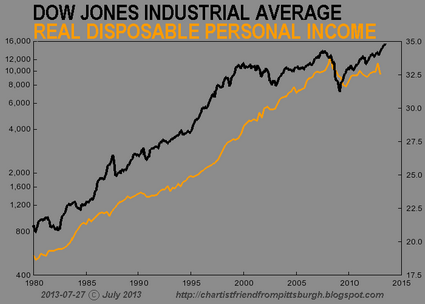
-Median household income in America has fallen for four consecutive years. Overall, it has declined by more than $4000 during that time span.
-At this point, an astounding 53 percent of all American workers make less than $30,000 a year.
That is the other side of the Fed’s insidious money printing. Incomes in the United States are going down, but the cost of living is skyrocketing. This is squeezing millions of Americans out of the middle class…
When Debbie Bruister buys a gallon of milk at her local Kroger supermarket, she pays $3.69, up 70 cents from what she paid last year.
Getting to the store costs more, too. Gas in Corinth, Miss., her hometown, costs $3.51 a gallon now, compared to less than three bucks in 2012. That really hurts, considering her husband’s 112-mile daily round-trip commute to his job as a pharmacist.
Perhaps you can identify with this. Perhaps your paychecks are about the same as they used to be back in 2007 but the cost of living has gone up dramatically since then.
I wish I could tell you that things were going to get better, but unfortunately there are all kinds of indications that things are about to get even worse for the U.S. economy. If you doubt this, just read this article and this article.
Yes, the Dow is at an all-time high. But do you want to know what else has hit an all-time high up in New York?
Homelessness.
The following is from a recent report in the New York Times…
An average of more than 50,000 people slept each night in New York City’s homeless shelters for the first time in January, a record that underscores an unsettling national trend: a rising number of families without permanent housing.
And apparently families and children have been hit particularly hard over the past year…
More than 21,000 children—an unprecedented 1% of the city’s youth—slept each night in a city shelter in January, an increase of 22% in the past year, the report said, while homeless families now spend more than a year in a shelter, on average, for the first time since 1987. In January, an average of 11,984 homeless families slept in shelters each night, a rise of 18% from a year earlier.
Of course New York is far from alone. There has been a surge in homelessness all over the United States. In fact, at this point more than a million public school students in the United States are homeless. This is the first time that has ever happened in U.S. history.
But the Dow just hit a record high so we should all be wildly happy, right?
Hopefully we can get more Americans to understand that the “prosperity” that we are enjoying right now is just an illusion. It isn’t real. It is a bubble created by reckless money printing by the Fed and reckless borrowing by the U.S. government. If you can believe it, the U.S. government borrowed another 253 billion dollars during the month of February alone.
The Fed and the U.S. government will continue to engage in this kind of reckless behavior until the bubble eventually bursts.
So what should all the rest of us do?
We should be feverishly preparing for the hard times that are coming. As Daisy Luther recently wrote about, one of the most important things to do is to create an emergency fund. Instead of going out and blowing your money on the latest toys and gadgets, set some money aside so that you will have something to live on if the economy crashes and you suddenly lose your income.
Just remember what happened back in 2008. Millions of Americans suddenly lost their jobs, and because many of them had no financial reserves, a lot of Americans suddenly could not pay their mortgages and they lost their homes.
So put some money away in a place where it will be safe – and that does not mean the stock market.
Jim Cramer of CNBC and a lot of the other talking heads on the financial news channels are trying to encourage ordinary Americans to jump into “the bull market” right now and make some money, and many people will take their advice.
But the truth is that a bubble is always biggest right before it bursts.
This bubble is awfully big right now, and I don’t know how much larger it can possibly get.


 Lost in all of the headlines about Iran and impeachment is the fact that the U.S. economic slowdown which began during the latter stages of last year appears to be accelerating. The final numbers which will tell us if we are officially in a recession at this moment won’t be released until months from now, but for millions upon millions of Americans it definitely feels like one has already started. Yes, the stock market has been soaring, but at this point the stock market has become completely divorced from economic reality. And as you will see later in this article, stock prices are now the most overvalued that they have ever been in all of American history.
