11 Signs That We Are Entering The Next Phase Of The Global Economic Crisis

Earth Puzzle - Public Domain
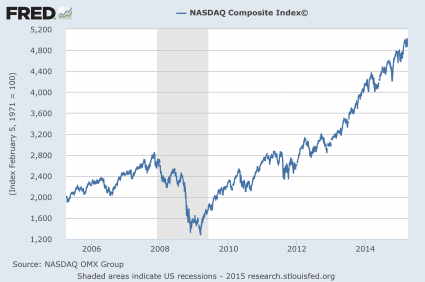
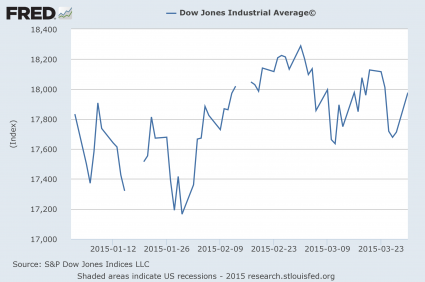
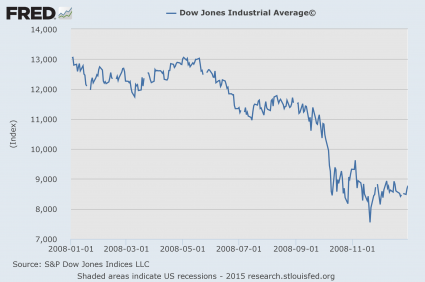
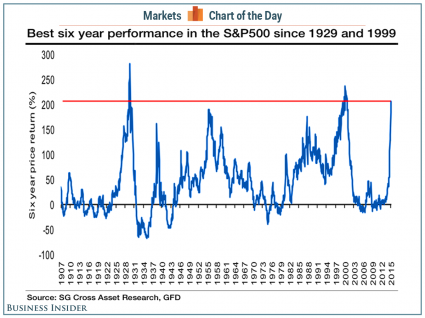
Well, the Nasdaq finally did it.  It has climbed all the way back to where it was at the peak of the dotcom bubble.  Back in March 2000, the Nasdaq set an all-time record high of 5,048.62.  On Thursday, after all these years, that all-time record was finally eclipsed.  The Nasdaq closed at 5056.06, and Wall Street greatly rejoiced.  So if you invested in the Nasdaq at the peak of the dotcom bubble, you are just finally breaking even 15 years later.  Unfortunately, the truth is that stocks have not been soaring because the U.S. economy is fundamentally strong.  Just like the last two times, what we are witnessing is an irrational financial bubble.  Sometimes these irrational bubbles can last for a surprisingly long time, but in the end they always burst.  And even now there are signs of economic trouble bubbling to the surface all around us.  The following are 11 signs that we are entering the next phase of the global economic crisis…

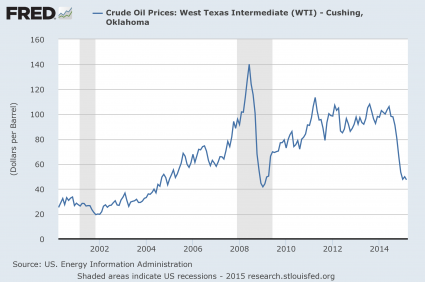
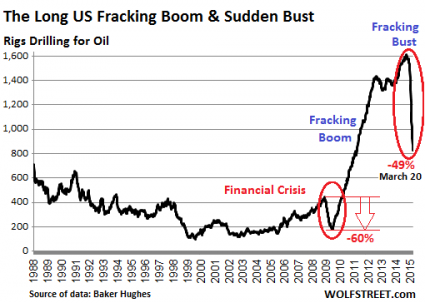
#1 It is being projected that half of all fracking companies in the United States will be “dead or sold” by the end of this year.

#2 The rig count just continues to fall as the U.S. oil industry implodes.  Incredibly, the number of rigs in operation in the United States has fallen for 19 weeks in a row.

#3 McDonald’s has announced that it will be closing 700 “poor performing” restaurants in 2015.  Why would McDonald’s be doing this if the economy was actually getting better?

#4 As I wrote about the other day, we could be right on the verge of a Greek debt default.  In fact, we learned on Thursday that the Greek government has been “running on empty” for months…

Greece warned it will go bankrupt next week after failing to stump up enough cash to pay millions of public sector workers and its international debts.

Deputy finance minister Dimitras Mardas set alarm bells ringing yesterday when he declared the country had been ‘running on empty’ since February.

With a debt repayment deadline looming on May 1, Greece faces the deeply damaging prospect of having to snub its own employees to make a €200m payment to the International Monetary Fund.

#5 Coal accounts for approximately 40 percent of all electrical generation on the entire planet.  When the price of coal starts to drop, that is a sign that economic activity is slowing down.  Just prior to the last financial crisis in 2008, the price of coal shot up dramatically and then crashed really hard.  Well, guess what?  The price of coal has been crashing again, and it is already lower than it was at any point during the last recession.

#6 The price of iron ore has been crashing as well.  It is down 35 percent in the last nine months, and David Stockman believes that this is because of a major deflationary crisis that is brewing in China…

There is no better measure of the true contraction underway in China than the price of iron ore. The Wall Street stock peddlers will tell you not to be troubled by the 70% plunge from the 2012 highs and the 35% drop just in the last nine months. According to them, its all the fault of the big global miners who went overboard opening up massive new iron ore pits and mining infrastructure.

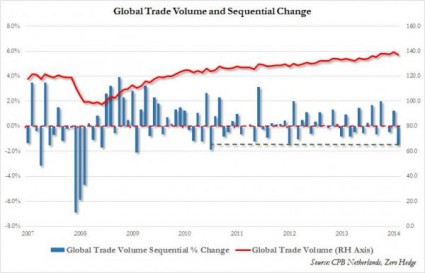
#7 At this point, China accounts for more total global trade than anyone else in the world.  That is why it is so alarming that Chinese imports and exports are both absolutely collapsing

China’s monthly trade data shows exports fell in March from a year ago by 14.6% in yuan terms, compared to expectations for a rise of more than 8%.

Imports meanwhile fell 12.3% in yuan terms compared to forecasts for a fall of more than 11%.

#8 The number of publicly traded companies in the United States that filed for bankruptcy during the first quarter of 2015 was more than double the number that filed for bankruptcy during the first quarter of 2014.

#9 New home sales in the United States just declined at their fastest pace in almost two years.

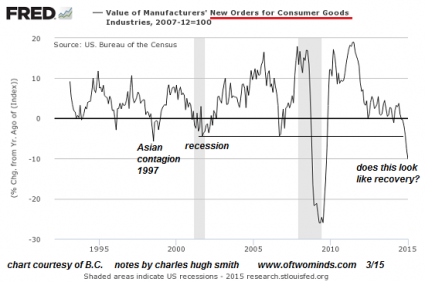
#10 U.S. manufacturing data has been shockingly weak lately…

On the heels of weak PMIs from Europe and Asia, Markit’s US Manufacturing PMI plunged to 54.2 in April (from 55.7). Against expectations of a rise to 55.6, this is the biggest miss on record. Of course, this is ‘post-weather’ so talking-heads will need to find another excuse as New Orders declined for the first time since Nov 2014.

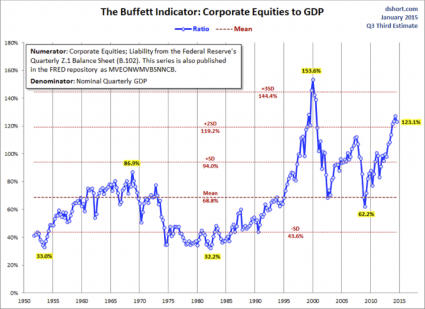
#11 When priced according to “the average blue-collar hourly wage“, U.S. stocks are the most expensive that they have ever been in history right now.  To say that this financial bubble is overdue to burst is a massive understatement.

For a long time, I have been pointing to 2015 as a major “turning point” for the global financial system, and I still feel that way.

But for the first four months of this year, things have been surprisingly quiet – at least on the surface.

So what is going on?

Well, I believe that what we are experiencing right now is the proverbial “calm before the storm”.  There is all sorts of turmoil brewing just beneath the surface, but for the moment things seem like they are running along just fine to most people.  Unfortunately, this period of quiet is not going to last much longer.

And those that are “in the know” are already moving their money in anticipation of what is coming.  For example, consider the words of  Snapchat founder and CEO Evan Spiegel

Fed has created abnormal market conditions by printing money and keeping interest rates low. Investors are looking for growth anywhere they can find it and tech companies are good targets – at these values, however, all tech stocks are expensive – even looking at 5+ years of revenue growth down the road. This means that most value-driven investors have left the market and the remaining 5-10%+ increase in market value will be driven by momentum investors. At some point there won’t be any momentum investors left buying at higher prices, and the market begins to tumble. May be 10-20% correction or something more significant, especially in tech stocks.

It may not happen next week, or even next month, but big financial trouble is coming.

And when it finally arrives, it is going to shock the world, even though anyone with any sense can see the coming crisis approaching from a mile away.

Guess What Happened The Last Time Bond Yields Crashed Like This?…

Question Cube - Public DomainIf a major financial crisis was approaching, we would expect to see the “smart money” getting out of stocks and pouring into government bonds that are traditionally considered to be “safe” during a crisis.  This is called a “flight to safety” or a “flight to quality“.  In the past, when there has been a “flight to quality” we have seen yields for German government bonds and U.S. government bonds go way down.  As you will see below, this is exactly what we witnessed during the financial crisis of 2008.  U.S. and German bond yields plummeted as money from the stock market was dumped into bonds at a staggering pace.  Well, it is starting to happen again.  In recent months we have seen U.S. and German bond yields begin to plummet as the “smart money” moves out of the stock market.  So is this another sign that we are on the precipice of a significant financial panic?

Back in 2008, German bonds actually began to plunge well before U.S. bonds did.  Does that mean that European money is “smarter” than U.S. money?  That would certainly be a very interesting theory to explore.  As you can see from the chart below, the yield on 10 year German bonds started to fall significantly during the summer of 2008 – several months before the stock market crash in the fall…

German Bond Yields 2007 And 2008

So what are German bonds doing today?

As you can see from this next chart, the yield on 10 year German bonds has been steadily falling since the beginning of last year.  At this point, the yield on 10 year German bonds is just barely above zero…

German Bond Yields 2013 To Today

And amazingly, most German bonds that have a maturity of less than 10 years actually have a negative yield right now.  That means that investors are going to get back less money than they invest.  This is how bizarre the financial markets have become.  The “smart money” is so concerned about the “safety” of their investments that they are actually willing to accept negative yields.  I don’t know why anyone would ever put their money into investments that have a negative yield, but it is actually happening.  The following comes from Yahoo

The world’s scarcest resource right now is safe yield, and the shortage is getting more extreme. Most German government bonds that mature in less than 10 years now have negative yields – part of some $2 trillion worth of paper with yields below zero.

This is what happens when the European Central Bank begins a trillion-euro bond-buying binge with rates already miniscule.

Yesterday, ECB boss Mario Draghi – unfazed by the protest stunt at his press conference – reaffirmed his plan to keep bidding for paper that yields more than -0.2% – that’s minus 0.2%.

Yes, the ECB is driving a lot of this, but it is still truly bizarre.

So what about the United States?

Well, first let’s take a look at what happened back in 2008.  In the chart below, you can see the “flight to safety” that took place in late 2008 as investors started to panic…

US Bond Yield 2007 And 2008

And we have started to witness a similar thing happen in recent months.  The yield on 10 year U.S. Treasuries has plummeted as investors have looked for safety.  This is exactly the kind of chart that we would expect to see if a financial crisis was brewing…

US 10 Year Yield 2014 And 2015

What makes all of this far more compelling is the fact that so many other patterns that we have witnessed just prior to past financial crashes are happening once again.

Yes, there are other potential explanations for why bond yields have been going down.  But when you add this to all of the other pieces of evidence that a new financial crisis is rapidly approaching, quite a compelling case emerges.

For those that do not follow my website regularly, I encourage you to check out the following articles to get an idea of what I am talking about…

-“Guess What Happened The Last Time The Price Of Oil Crashed Like This?…

-“Not Just Oil: Guess What Happened The Last Time Commodity Prices Crashed Like This?…

-“10 Key Events That Preceded The Last Financial Crisis That Are Happening Again RIGHT NOW

-“Guess What Happened The Last Time The U.S. Dollar Skyrocketed In Value Like This?…

-“7 Signs That A Stock Market Peak Is Happening Right Now

-“Guess What Happened The Last Two Times The S&P 500 Was Up More Than 200% In Six Years?

Of course no two financial crashes ever look exactly the same.

The crisis that we are moving toward is not going to be precisely like the crisis of 2008.

But there are similarities and patterns that we can look for.  When things start to get bad, investors act in predictable ways.  And so many of the things that we are watching right now are just what we would expect to see in the lead up to a major financial crisis.

Sadly, most people are not willing to learn from history.  Even though it is glaringly apparent that we are in a historic financial bubble, most investors on Wall Street cannot see it because they do not want to see it.  They want to believe that somehow “things are different this time” and that stocks will just continue to go up indefinitely so that they can keep making lots and lots of money.

And despite what you may think, I actually want this bubble to continue for as long as possible.  Despite all of our problems, life is still relatively good in America today – at least compared to what is coming.

I like to refer to this next crisis as our “third strike”.

Back in 2000 and 2001, the dotcom bubble burst and we experienced a painful recession, but we didn’t learn any lessons.  That was strike number one.

Then came the financial crash of 2008 and the worst economic downturn since the Great Depression.  But we didn’t learn any lessons from that either.  Instead, we just reinflated the same old financial bubbles and kept on making the exact same mistakes as before.  That was strike number two.

This next financial crisis will be strike number three.  After this next crisis, I don’t believe that there will ever be a return to “normal” for the United States.  I believe that this is going to be the crisis that unleashes hell in our nation.

So no, I am not eager for that to come.  Even though there is no way that this bubble of debt-fueled false prosperity can last indefinitely, I would like for it to last at least a little while longer.

Because what comes after it is going to be truly terrible.

The Global Liquidity Squeeze Has Begun

Squeeze Globe - Public DomainGet ready for another major worldwide credit crunch.  Today, the entire global financial system resembles a colossal spiral of debt.  Just about all economic activity involves the flow of credit in some way, and so the only way to have “economic growth” is to introduce even more debt into the system.  When the system started to fail back in 2008, global authorities responded by pumping this debt spiral back up and getting it to spin even faster than ever.  If you can believe it, the total amount of global debt has risen by $35 trillion since the last crisis.  Unfortunately, any system based on debt is going to break down eventually, and there are signs that it is starting to happen once again.  For example, just a few days ago the IMF warned regulators to prepare for a global “liquidity shock“.  And on Friday, Chinese authorities announced a ban on certain types of financing for margin trades on over-the-counter stocks, and we learned that preparations are being made behind the scenes in Europe for a Greek debt default and a Greek exit from the eurozone.  On top of everything else, we just witnessed the biggest spike in credit application rejections ever recorded in the United States.  All of these are signs that credit conditions are tightening, and once a “liquidity squeeze” begins, it can create a lot of fear.

Over the past six months, the Chinese stock market has exploded upward even as the overall Chinese economy has started to slow down.  Investors have been using something called “umbrella trusts” to finance a lot of these stock purchases, and these umbrella trusts have given them the ability to have much more leverage than normal brokerage financing would allow.  This works great as long as stocks go up.  Once they start going down, the losses can be absolutely staggering.

That is why Chinese authorities are stepping in before this bubble gets even worse.  Here is more about what has been going on in China from Bloomberg

China’s trusts boosted their investments in equities by 28 percent to 552 billion yuan ($89.1 billion) in the fourth quarter. The higher leverage allowed by the products exposes individuals to larger losses in the event of stock-market drops, which can be exaggerated as investors scramble to repay debt during a selloff.

In umbrella trusts, private investors take up the junior tranche, while cash from trusts and banks’ wealth-management products form the senior tranches. The latter receive fixed returns while the former take the rest, so private investors are effectively borrowing from trusts and banks.

Margin debt on the Shanghai Stock Exchange climbed to a record 1.16 trillion yuan on Thursday. In a margin trade, investors use their own money for just a portion of their stock purchase, borrowing the rest. The loans are backed by the investors’ equity holdings, meaning that they may be compelled to sell when prices fall to repay their debt.

Overall, China has seen more debt growth than any other major industrialized nation since the last recession.  This debt growth has been so dramatic that it has gotten the attention of authorities all over the planet

Wolfgang Schaeuble, Germany’s finance minister says that “debt levels in the global economy continue to give cause for concern.”

Singling out China in particular, Schaeuble noted that “debt has nearly quadrupled since 2007″, adding that it’s “growth appears to be built on debt, driven by a real estate boom and shadow banks.”

According to McKinsey’s research, total outstanding debt in China increased from $US7.4 trillion in 2007 to $US28.2 trillion in 2014. That figure, expressed as a percentage of GDP, equates to 282% of total output, higher than the likes of other G20 nations such as the US, Canada, Germany, South Korea and Australia.

This credit boom in China has been one of the primary engines for “global growth” in recent years, but now conditions are changing.  Eventually, the impact of what is going on in China right now is going to be felt all over the planet.

Over in Europe, the Greek debt crisis is finally coming to a breaking point.  For years, authorities have continued to kick the can down the road and have continued to lend Greece even more money.

But now it appears that patience with Greece has run out.

For instance, the head of the IMF says that no delay will be allowed on the repayment of IMF loans that are due next month…

IMF Managing Director Christine Lagarde roiled currency and bond markets on Thursday as reports came out of her opening press conference saying that she had denied any payment delay to Greece on IMF loans falling due next month.

Unless Greece concludes its negotiations for a further round of bailout money from the European Union, however, it is not likely to have the money to repay the IMF.

And we are getting reports that things are happening behind the scenes in Europe to prepare for the inevitable moment when Greece will finally leave the euro and go back to their own currency.

For example, consider what Art Cashin told CNBC on Friday

First, “there were reports in the media [saying] that the ECB and/or banking authorities suggested to banks to get rid of any sovereign Greek debt they had, which suggests that maybe the next step will be Greece exiting,” Cashin told CNBC.

Also, one of Greece’s largest newspapers is reporting that neighboring countries are forcing subsidiaries of Greek banks that operate inside their borders to reduce their risk to a Greek debt default to zero

According to a report from Kathimerini, one of Greece’s largest newspapers, central banks in Albania, Bulgaria, Cyprus, Romania, Serbia, Turkey and the Former Yugoslav Republic of Macedonia have all forced the subsidiaries of Greek banks operating in those countries to bring their exposure to Greek risk — including bonds, treasury bills, deposits to Greek banks, and loans — down to zero.

Once Greece leaves the euro, that is going to create a tremendous credit crunch in Europe as fear begins to spread like wildfire.  Everyone will be wondering which nation will be “the next Greece”, and investors will want to pull their money out of perceived danger zones before they get hammered.

In the past, other European nations have been willing to bend over backwards to accommodate Greece and avoid this kind of mess, but those days appear to be finished.  In fact, the finance minister of France openly admits that the French “are not sympathetic to Greece”

Greece isn’t winning much sympathy from its debt-wracked European counterparts as the country draws closer to default for failing to make bailout repayments.

“We are not sympathetic to Greece,” French Finance Minister Michael Sapin said in an interview at the International Monetary Fund-World Bank spring meetings here.

“We are demanding because Greece must comply with the European (rules) that apply to all countries,” Sapin said.

Yes, it is possible that another short-term deal could be reached which could kick the can down the road for a few more months.

But either way, things in Europe are going to continue to get worse.

Meanwhile, very disappointing earnings reports in the U.S. are starting to really rattle investors.

For example, we just learned that GE lost 13.6 billion dollars in the first quarter…

One week following the announcement that it would dismantle most of its GE Capital financing operations to instead focus on its industrial roots, General Electric reported a first quarter loss of $13.6 billion.

The results were impacted by charges relating to the conglomerate’s strategic shift. A year ago GE reported a first quarter profit of $3 billion.

That is a lot of money.

How in the world does a company lose 13.6 billion dollars in a single quarter during an “economic recovery”?

Other big firms are reporting disappointing earnings numbers too

In earnings news, American Express Co. late Thursday said its results were hurt by the strong U.S. dollar, which reduced revenue booked in other countries. Chief Executive Kenneth Chenault reiterated the company’s forecast that 2015 earnings will be flat to modestly down year over year. Shares fell 4.6%.

Advanced Micro Devices Inc. said its first-quarter loss widened as revenue slumped. The company said it was exiting its dense server systems business, effective immediately. Revenue and the loss excluding items missed expectations, pushing shares down 13%.

And just like we saw just before the financial crisis of 2008, Americans are increasingly having difficulty meeting their financial obligations.

For instance, the delinquency rate on student loans has reached a very frightening level

More borrowers are failing to make payments on their student loans five years after leaving college, painting a grim picture for borrowers, according to the Federal Reserve Bank of New York.

Student debt continues to increase, especially for people who took out loans years ago. Those who left school in the Great Recession, which ended in 2009, had particular difficulty with repayment, with many defaulting, becoming seriously delinquent or not being able to reduce their balances, the New York Fed said today.

Only 37 percent of borrowers are current on their loans and are actively paying them down, and 17 percent are in default or in delinquency.

At this point, the American consumer is pretty well tapped out.  If you can believe it, 56 percent of all Americans have subprime credit today, and as I mentioned above, we just witnessed the biggest spike in credit application rejections ever recorded.

We have reached a point of debt saturation, and the credit crunch that is going to follow is going to be extremely painful.

Of course the biggest provider of global liquidity in recent years has been the Federal Reserve.  But with the Fed pulling back on QE, this is creating some tremendous challenges all over the globe.  The following is an excerpt from a recent article in the Telegraph

The big worry is what will happen to Russia, Brazil and developing economies in Asia that borrowed most heavily in dollars when the Fed was still flooding the world with cheap liquidity. Emerging markets account to roughly half of the $9 trillion of offshore dollar debt outside US jurisdiction.

The IMF warned that a big chunk of the debt owed by companies is in the non-tradeable sector. These firms lack “natural revenue hedges” that can shield them against a double blow from rising borrowing costs and a further surge in the dollar.

So what is the bottom line to all of this?

The bottom line is that we are starting to see the early phases of a liquidity squeeze.

The flow of credit is going to begin to get tighter, and that means that global economic activity is going to slow down.

This happened during the last financial crisis, and during this next financial crisis the credit crunch is going to be even worse.

This is why it is so important to have an emergency fund.  During this type of crisis, you may have to be the source of your own liquidity.  At a time when it seems like nobody has any cash, those that do have some will be way ahead of the game.

Huge Trouble Is Percolating Just Under The Surface Of The Global Economy

World On Fire - Public DomainDid you know that the number of publicly traded companies declaring bankruptcy has reached a five year high?  And did you know that Chinese exports are absolutely collapsing and that Chinese economic growth in 2014 was the weakest in over 20 years?  Even though things may seem to be okay on the surface for the global economy at the moment, that does not mean that big trouble is not percolating just under the surface.  On Wednesday, investors cheered as stocks soared to new highs, but almost all of the economic news coming in from around the planet has been bad.  The credit rating on Greek debt has been slashed again, global economic trade is really slowing down, and many of the exact same financial patterns that we saw just before the crash of 2008 are repeating once again.  All of this reminds me of the months leading up to the implosion of Lehman Brothers.  Most people were feeling really good about things, but huge trouble was brewing just underneath the surface.  Finally, one day we learned that Lehman Brothers had “suddenly” collapsed, and then all hell broke loose.

If the economy is actually “getting better” like we are being told by the establishment media, then why are so many big companies declaring bankruptcy?  According to CNBC, the number of publicly traded companies declaring bankruptcy has hit a five year high…

The number of bankruptcies among publicly traded U.S. companies has climbed to the highest first-quarter level for five years, according to a Reuters analysis of data from research firm bankruptcompanynews.com.

Plunging prices of crude oil and other commodities is one of the major reasons for the increased filings, and bankruptcy experts said a more aggressive stance by lenders may also be hurting some companies.

It is interesting to note that the price of oil is being named as one of the primary reasons why this is happening.

In an article entitled “Anyone That Believes That Collapsing Oil Prices Are Good For The Economy Is Crazy“, I warned about this.  If the price of oil does not bounce back in a huge way, we are going to see a lot more companies go bankrupt, a lot more people are going to lose their jobs, and a lot more corporate debt is going to go bad.

And of course this oil crash has not just hurt the United States.  All over the world, economic activity is being curtailed because of what has happened to the price of oil…

In the heady days of the commodity boom, oil-rich nations accumulated billions of dollars in reserves they invested in U.S. debt and other securities. They also occasionally bought trophy assets, such as Manhattan skyscrapers, luxury homes in London or Paris Saint-Germain Football Club.

Now that oil prices have dropped by half to $50 a barrel, Saudi Arabia and other commodity-rich nations are fast drawing down those “petrodollar” reserves. Some nations, such as Angola, are burning through their savings at a record pace, removing a source of liquidity from global markets.

If oil and other commodity prices remain depressed, the trend will cut demand for everything from European government debt to U.S. real estate as producing nations seek to fill holes in their domestic budgets.

But it isn’t just oil.  We appear to be moving into a time when things are slowing down all over the place.

In a recent article, Zero Hedge summarized some of the bad economic news that has come in just this week…

Mortgage Apps tumble, Empire Fed slumps, and now Industrial Production plunges… Against expectations of a 0.3% drop MoM, US Factory Output was twice as bad at -0.6% – the worst since August 2012 (and lamost worst since June 2009). This is the 4th miss in a row.

If we are indeed heading into another economic downturn, that is really bad news, because at the moment we are in far worse shape than we were just prior to the last recession.

To help illustrate this, I want to share with you a couple of charts.

This first chart comes from the Federal Reserve Bank of St. Louis, and it shows that after you adjust for inflation, median income for the middle class is the lowest that it has been in decades

Median Income St. Louis Fed

This next chart shows that median net worth for the middle class is also the lowest that it has been in decades after you adjust for inflation…

Median Net Worth St. Louis Fed

The middle class is being systematically destroyed.  For much more on this, please see this recent article that I published.  And now we are on the verge of another major economic slowdown.  That is not what the middle class needs at all.

We are also getting some very disturbing economic news out of China.

In 2014, economic growth in China was the weakest in more than 20 years, and Chinese export numbers are absolutely collapsing

China’s monthly trade data shows exports fell in March from a year ago by 14.6% in yuan terms, compared to expectations for a rise of more than 8%.

Imports meanwhile fell 12.3% in yuan terms compared to forecasts for a fall of more than 11%.

This is a clear sign that global economic activity is slowing down in a big way.

In addition, Chinese home prices are now falling at a faster pace then U.S. home prices fell during the subprime mortgage meltdown

It appeared as though things went from bad to worse nearly overnight; China’s National Bureau of Statistics said that contrary to hopes that there would be a modest rebound, the average new home price in China fell at the fastest pace on record in February, from the previous year.

Reuters reported that average new home prices in China’s 70 major cities fell 5.7 percent, year to year, in February – marking the sixth consecutive drop after January’s decline of 5.1 percent.

Things continue to get worse in Europe as well.

This week we learned that the credit rating for Greek government debt has been slashed once again

Standard & Poor’s has just cut Greece’s credit rating to “CCC+” from “B-” with a negative outlook.

S&P said it expected Greece’s debt to be “unsustainable.” It cited the potential for dissolving liquidity in the government, banks and economy.

And according to the Financial Times, we could actually be on the verge of witnessing a Greek debt default…

Greece is preparing to take the dramatic step of declaring a debt default unless it can reach a deal with its international creditors by the end of April, according to people briefed on the radical leftist government’s thinking.

The government, which is rapidly running out of funds to pay public sector salaries and state pensions, has decided to withhold €2.5bn of payments due to the International Monetary Fund in May and June if no agreement is struck, they said.

So I hope that those that are euphoric about the performance of their stock portfolios are taking their profits while they still can.

Huge trouble is percolating just under the surface of the global economy, and it won’t be too long before the financial markets start feeling the pain.

If Anyone Doubts That We Are In A Stock Market Bubble, Show Them This Article

Bubble In Hands - Public DomainThe higher financial markets rise, the harder they fall.  By any objective measurement, the stock market is currently well into bubble territory.  Anyone should be able to see this – all you have to do is look at the charts.  Sadly, most of us never seem to learn from history.  Most of us want to believe that somehow “things are different this time”.  Well, about the only thing that is different this time is that our economy is in far worse shape than it was just prior to the last major financial crisis.  That means that we are more vulnerable and will almost certainly endure even more damage this time around.  It would be one thing if stocks were soaring because the U.S. economy as a whole was doing extremely well.  But we all know that isn’t true.  Instead, what we have been experiencing is clearly artificial market behavior that has nothing to do with economic reality.  In other words, we are dealing with an irrational financial bubble, and all irrational financial bubbles eventually burst.  And as I wrote about yesterday, the way that stocks have moved so far this year is eerily reminiscent of the way that stocks moved in early 2008.  The warning signs are there – if you are willing to look at them.

The first chart that I want to share with you today comes from Doug Short.  It is a chart that shows that the ratio of corporate equities (stocks) to GDP is the second highest that it has been since 1950.  The only other time it has been higher was just before the dotcom bubble burst…

The Buffett Indicator from Doug Short

Does that look like a bubble to you?

It sure looks like a bubble to me.

In order for the corporate equities to GDP ratio to get back to the mean (average) level, stock prices would have to fall nearly 50 percent.

If that happens, people will be calling it a crash, but in truth it would just be a return to normalcy.

This next chart comes from Phoenix Capital Research.  The CAPE ratio (cyclically adjusted price-to-earnings ratio) is considered to be an extremely accurate measure of the true value of stocks…

As I’ve noted before, the single best predictor of stock market performance is the cyclically adjusted price-to-earnings ratio or CAPE ratio.

Corporate earnings are heavily influenced by the business cycle. Typically the US experiences a boom and bust once every ten years or so. As such, companies will naturally have higher P/E’s at some points and lower P/E’s at other. This is based solely on the business cycle and nothing else.

CAPE adjusts for this by measuring the price of stocks against the average of ten years’ worth of earnings, adjusted for inflation. By doing this, it presents you with a clearer, more objective picture of a company’s ability to produce cash in any economic environment.

Based on a study completed Vanguard, CAPE was the single best metric for measuring future stock returns.

When the CAPE ratio is too high, that means that stocks are overpriced and are not a good value.  And right now the CAPE ratio is the 3rd highest that it has been since 1890.  That only times it has been higher than this were in 1929 (we all remember what happened then) and just before the dotcom bubble burst…

CAPE - Phoenix Capital Research

The funny thing is that stocks have continued to rise even as corporate revenues have begun to fall.

According to Wolf Richter, in the first quarter of 2015 corporate revenues are projected to decline at the fastest pace that we have seen since the depths of the last recession…

Week after week, corporations and analysts have been whittling down their estimates. By now, revenues of the S&P 500 companies are expected to decline 2.8% in Q1 from a year ago – the worst year-over-year decline since Q3 of crisis year 2009.

This next chart I want to share with you shows how the Nasdaq has performed over the past decade.  Looking at this chart alone, you would think that the U.S. economy must have been absolutely roaring since the end of the last recession.  But what is really going on is rampant speculation.  Some of the tech companies that make up the Nasdaq are not making any profits at all and yet they are supposedly worth billions of dollars.  If you cannot see a bubble in this chart, you need to get your vision checked…

NASDAQ Chart

And this kind of irrational euphoria is not just happening in the United States.

For example, Chinese stocks are up nearly 80 percent over the past nine months.

Meanwhile, the overall Chinese economy is growing at the slowest pace that we have seen in about 20 years.

Right now, we are in the calm before the storm.  We are right at the door of the next great financial crisis, and most of the people that work in the industry know this.

And once in a while they let the cat out of the bag.

For example, consider what Hans-Jörg Vetter, the CEO of Landesbank Baden-Württemberg in Germany, had to say during one recent press conference

“Risk is no longer priced in,” he said. And these investors aren’t paid for the risks they’re taking. This applies to all asset classes, he said. The stock and the bond markets, he said, are now both seeing “the mother of all bubbles.”

This can’t go on forever. Or for very long. But he couldn’t see the future either and pin down a date, which is what everyone wants to know so that they can all get out in time. “I cannot tell you when it will rumble,” he said, “but eventually it will rumble again.”

By “again” he meant the sort of thing that had taken the bank down last time, the Financial Crisis. It had been triggered by horrendous risk-taking, where risks hadn’t been priced into all kinds of securities. When those securities – mortgage-backed securities, for example, that were hiding the inherent risks under a triple-A rating – blew up, banks toppled.

What Vetter is telling us is what I have been warning about for a long time.

Another great stock market crash is coming.

It is just a matter of time.

The Stock Market In 2015 Is Starting To Look Remarkably Similar To The Stock Market In 2008

Bubble Mirror - Public DomainAre we watching a replay of the last financial crisis?  Over the past six months, the price of oil has collapsed, the U.S. dollar has soared, and a whole bunch of other patterns that we witnessed just before the stock market crash of 2008 are repeating once again.  But what we have not seen yet is the actual stock market crash.  So will there be one this year?  In this article, I am going to compare the performance of the Dow Jones Industrial Average during the first three months of 2008 to the performance of the Dow Jones Industrial Average during the first three months of 2015.  As you will see, there are some striking similarities.  And without a doubt, we are overdue for a major market downturn.  The S&P 500 has risen for six years in a row, but it has never had seven up years consecutively.  In addition, there has not even been a 10 percent stock market “correction” is almost three and a half years.  So will stocks be able to continue to defy both gravity and the forces of economic reality?  Only time will tell.

Below is a chart that shows how the Dow Jones Industrial Average performed during the first three months of 2008.  It was a time of increased volatility, but the market pretty much went nowhere.  This is typical of what we see in the months leading up to a market crash.  The markets start getting really choppy with large ups and large downs…

Dow First 3 Months Of 2008

This next chart shows how the Dow Jones Industrial Average has performed during the first three months of 2015.  Once again, we are witnessing a time of increased volatility, but the market is not really going anywhere.  In fact, after falling about 200 points on Tuesday (not shown on this chart) it is just barely below where it started the year…

Dow First 3 Months Of 2015

When the market becomes quite restless but it doesn’t really move anywhere, that is a sign that we have reached a turning point.  The following is what a recent CNN article had to say about the rising volatility that we have been witnessing…

The Dow fell nearly 3.7% in January, surged 5.6% in February and is down about 2% this month. The S&P 500 and Nasdaq have gone through similar sentiment swings. The Dow ended the quarter slightly in the red while the S&P 500 and Nasdaq were up a little bit.

Charles Schwab chief investment officer Liz Ann Sonders summed up this volatility the best — with a nod to U2. “Running to Stand Still: Wild Swings Taking Market Nowhere” is the title of her most recent market commentary.

What can investors expect for the rest of 2015? Probably a lot more of the same.

Now let’s look at a chart for the entire year of 2008.  After peaking for the year in early May, the Dow started to slide.  Things started to get really crazy in September, and by the end of the year the U.S. economy was plunged into the greatest crisis since the Great Depression…

Dow Full Year Of 2008

Will the rest of 2015 follow a similar pattern?

A lot of investors are actually betting that this will be the case.

Right now, hundreds of millions of dollars are flowing into VXX – an ETF that makes money when the Chicago Board Options Exchange Volatility Index goes up.  In other words, these investors are betting that we are going to see a lot more stock market volatility in the weeks and months to come.

And as I have said so many times before, stocks tend to rise in calm markets and they tend to fall when the markets become volatile.

So essentially these investors are betting that we are headed for a stock market crash.

The following is more on the massive inflow of money into VXX that we have been seeing from the Crux

Ways to speculate on how noisy the stock market will be have exploded in the last decade with the advent of products tied to the Chicago Board Options Exchange Volatility Index. Strategies include relatively simple hedges against equity losses, such as owning a security that aims to mimic the VIX.

VXX, one of the most popular ways to bet on bigger market swings, has absorbed $715 million in seven consecutive weeks of inflows, its longest streak of inflows since one ending in July 2012. The infusion of fresh cash has continued this week, swelling its market value to $1.5 billion, the highest since September 2013.

At the same time, short-sellers in VXX — people effectively betting the bull market will persist — have dropped out. Short interest has slid 35 percent since October, falling to the lowest in more than seven months last week, data compiled by Markit Ltd. show.

And many of the exact same people that warned us about the financial crisis of 2008 in advance are warning that another crisis is rapidly approaching.  For example, check out the following quote from Ann Pettifor that recently appeared in an article in the Guardian

As Janet Yellen’s Federal Reserve prepares to raise interest rates, boosting the value of the dollar, while the plunging price of crude puts intense pressure on the finances of oil-exporting countries, there are growing fears of a new debt crisis in the making.

Ann Pettifor of Prime Economics, who foreshadowed the credit crunch in her 2003 book The Coming First World Debt Crisis, says: “We’re going to have another financial crisis. Brazil’s already in great trouble with the strength of the dollar; I dread to think what’s happening in South Africa; then there’s Malaysia. We’re back to where we were, and that for me is really frightening.”

Pettifor is right on two counts – another major financial crisis is approaching, and it is going to be global in scope.

Before I end this article, there are two more items that I would like to share with you.

Firstly, it is being reported that the IPO market has really cooled off in 2015.  When the number of companies going public starts to decline, that is a clear sign that a stock market bubble is on borrowed time.  The following comes from Business Insider

The number of US companies going public has really dropped off lately.

“After a record year in 2014, the IPO market slowed dramatically in the first quarter of 2015,” Renaissance Capital analysts said.

The first quarter of 2015, which ended Tuesday, was the slowest quarter for IPOs since the first quarter of 2013. While stock prices have been near all-time highs, market volatility has been escalating, turning companies off from trying to unload shares onto the public markets.

Secondly, the San Francisco housing market has been a pretty reliable indicator of previous economic booms and busts.  The San Francisco housing market started to cool off before the dotcom bubble burst, it started to cool off before the stock market crash of 2008, and now it is cooling off once again.  The following chart comes from Zero Hedge

San Francisco - Zero Hedge

The warning signs are there.

But as with so many other things in life, most people are going to end up believing precisely what they want to believe.

So what do you believe about what the rest of the year will bring?  Please feel free to share your thoughts by posting a comment below…

5 Charts Which Show That The Next Economic Crash Is Dead Ahead

Iceberg - Public DomainWhen an economic crisis is coming, there are usually certain indicators that appear in advance.  For example, commodity prices usually start to plunge before a recession begins.  And as you can see from the Bloomberg Commodity Index which you can find right here, this has already been happening.  In addition, I have previously written about how the U.S. dollar went on a great run just before the financial collapse of 2008.  This is something that has also been happening over the past few months.  Some people would have you believe that nobody can anticipate the next great economic downturn and that to try to do so is just an exercise in “guesswork”.  But that is not the case at all.  We can look back over history and see patterns that keep repeating.  And a lot of the exact same patterns that happened just before previous stock market crashes are happening again right now.

For example, let’s talk about the price of oil.  There are only two times in history when the price of oil has fallen by more than 50 dollars in a six month time period.  One was just before the financial crisis in 2008, and the other has just happened…

Price Of Oil 2015

As a result of crashing oil prices, we are witnessing oil rigs shut down in the United States at a blistering pace.  In fact, almost half of all oil rigs in the U.S. have already shut down.  The following commentary and chart come from Wolf Richter

In the latest week, drillers idled another 41 oil rigs, according to Baker Hughes. Only 825 rigs were still active, down 48.7% from October. In the 23 weeks since, drillers have idled 784 oil rigs, the steepest, deepest cliff-dive in the history of the data:

Fracking Bust 2015

We are looking at a full-blown fracking bust, and this bust is already having a dramatic impact on the economies of states that are heavily dependent on the energy industry.

For example, just check out the disturbing number that just came out of Texas

The crash in oil prices is hammering the Texas economy.

The latest manufacturing outlook index from the Dallas Fed plunged again in March, to -17.4 from -11.2 in February, indicating deteriorating business conditions in the state.

Ouch.

But this pain is going to be felt far beyond Texas.  In recent years, Wall Street banks have made a massive amount of money packaging up energy industry loans, bonds, etc. and selling them off to investors.

If that sounds similar to the kind of behavior that preceded the subprime mortgage meltdown, that is because it is.

Now those loans, bonds, etc. are going bad as the fracking bust intensifies, and whoever is left holding all of this worthless paper at the end of the day is going to lose an extraordinary amount of money.  Here is more from Wolf Richter

It suited Wall Street just fine: according to Dealogic, banks extracted $31 billion in fees from the US oil and gas industry and its investors over the past five years by handling IPOs, spin-offs, “leveraged-loan” transactions, the sale of bonds and junk bonds, and M&A.

That’s $6 billion in fees per year! Over the last four years, these banks made over $4 billion in fees on just “leveraged loans.” These loans to over-indebted, junk-rated companies soared from about $40 billion in 2009 to $210 billion in 2014 before it came to a screeching halt.

For Wall Street it doesn’t matter what happens to these junk bonds and leveraged loans after they’ve been moved on to mutual funds where they can decompose sight-unseen. And it doesn’t matter to Wall Street what happens to leverage loans after they’ve been repackaged into highly rated Collateralized Loan Obligations that are then sold to others.

At the same time, we are also witnessing a slowdown in global trade.  This usually happens when economic conditions are about to turn sour, and that is why it is so alarming that the total volume of global trade in January was down 1.4 percent from December.  According to Tyler Durden of Zero Hedge, that was the largest drop since 2011…

Presenting the latest data from the CPB Netherlands Bureau for Economic Policy Analysis, according to which in January world trade by volume dropped by a whopping 1.4% from December: the biggest drop since 2011!

Global Trade Volume

We are seeing some troubling signs in the U.S. as well.

I shared the following chart in a previous article, but it bears repeating.  It comes from Charles Hugh Smith, and it shows that new orders for consumer goods are falling at a rate not seen since the last recession…

Charles Hugh-Smith New Orders

Well, what about the stock market?  It was up more than 200 points on Monday.  Isn’t that good news?

Yes, but the euphoria on Wall Street will not last for long.

When corporate earnings per share either start flattening out or start to decline, that is a huge red flag.  We saw this just prior to the stock market crash of 2008, and it is happening again right now.  The following commentary and chart come from Phoenix Capital Research

Take a look at the below chart showing current stock levels and changes in forward Earnings Per Share (EPS). Note, in particular how divergences between EPS and stocks tend to play out (hint look at 2007-2008).

Change In 12 Month EPS

We all know what came next.

And guess what?

According to CNBC, a lot of the “smart money” is pulling their money out of the stock market right now while the getting is good…

Recent market volatility has sent stock market investors rushing for the exits and into cash.

Outflows from equity-based funds in 2015 have reached their highest level since 2009, thanks to a seesaw market that has come under pressure from weak economic data, a stronger dollar and the the prospect of monetary tightening.

Funds that invest in stocks have seen $44 billion in outflows, or redemptions, year to date, according to Bank of America Merrill Lynch. Equity funds have seen outflows in five of the last six weeks, including $6.1 billion in just the last week.

It doesn’t matter if you are a millionaire “on paper” today.

What matters is if the money is going to be there when you really need it.

At the moment, a whole lot of people have been lulled into a false sense of complacency by the soaring stock market and by the bubble of false economic stability that we have been enjoying.

But under the surface, there is a whole lot of turmoil going on.

Those that are looking for the signs are going to see the next crisis approaching well in advance.

Those that are not are going to get absolutely blindsided by what is coming.

Don’t let that happen to you.

Guess What Happened The Last Two Times The S&P 500 Was Up More Than 200% In Six Years?

Question Ball - Public DomainJust a few days ago, the bull market for the S&P 500 turned six years old.  This six year period of time has been great for investors, but what comes next?  On March 9th, 2009 the S&P 500 hit a low of 676.53.  Since that day, it has risen more than 200 percent.  As you will see below, there are only two other times within the last 100 years when the S&P 500 performed this well over a six year time frame.  In both instances, the end result was utter disaster. And as you take in this information, I want you to keep in mind what I said in my previous article entitled “7 Signs That A Stock Market Peak Is Happening Right Now“.  What we are witnessing at this moment is classic “peaking behavior”, and there is a long way to go down from here.  So if historical patterns hold up, those with lots of money in the stock market could soon be in for a whole lot of trouble.

According to Societe Generale analyst Andrew Lapthorne, there was an S&P 500 bull market run of more than 200 percent over a six year time period that ended in 1929.

We all know what happened that year.

And there was another S&P 500 bull market run of more than 200 percent over a six year time period that ended in 1999.  In the end, all of those gains were wiped out when the dotcom bubble burst.

And now we are near the end of another great bull market for the S&P 500.  The following is an excerpt from a recent Business Insider article

“Such a strong six year run up in US equities has only been seen twice since 1900, i.e., back in 1929 and 1999, neither of which ended well,” Lapthorne wrote.

It’s anyone’s guess what happens next. But Lapthorne and his colleagues have slanted bearish.

Best Six Year Performance

So how will this current bull market end?

Needless to say, a lot of people are not very optimistic about that right now.

And there was another very interesting bull market that ended in 1987

On Aug. 12, the S&P 500 dipped to 102.42, setting the stage for the third-biggest bull market in stocks since 1929. Inflation and unemployment fell. In 1984, President Reagan would cruise to reelection with an ad telling voters “It’s morning again in America.” By 1987, the stock market had tripled. Shareholders who were able to see beyond the gloom of the early 1980s reaped a huge return.

Of course a lot of those huge stock market returns were eliminated in a single day.  On October 19th, 1987 the Dow declined by more than 22 percent during a single trading session.  That day is still known as “Black Monday” up to this present time.

Markets tend to go down a lot faster than they go up.  So if your stock portfolio has gone up substantially over the past few years, good for you.  But keep in mind that all of your gains can be wiped out very rapidly.  Millions of people experienced this during the last financial crisis, and millions more will experience this during the next one.

And as I keep reminding people, so many of the exact same patterns that we witnessed just prior to the last great stock market collapse are happening once again.

For example, just yesterday I explained that there has been only one other time over the past decade when we have seen the U.S. dollar surge in value in such a short period of time.

That was in 2008, just prior to the last financial crisis.

Another example is what has happened to the price of oil.  Since the middle of last year, the price of oil has fallen by more than 50 dollars a barrel.

In all of history, that has happened only one other time.

That was in 2008, just prior to the last financial crisis.

I could go on and on.  I could talk about margin debt, price/earnings ratios, industrial commodities, etc.

But you know what?  Despite all of the warning signs there are still people out there that are eagerly pouring money into the stock market.

Back in 2005 and 2006, I knew people that were hurrying to buy homes before they got “priced out of the market”.  So they did everything that they could to scrape together down payments and they took on mortgages that were larger than they could really afford.

And in the end they got burned.

Today, people are doing similar things.  For instance, my friend Bob recently sent me an article that I could hardly believe.  It turns out that an “expert” on CNBC is encouraging people “to take out a 7 year loan with a rapidly amortizing asset as collateral in order to buy stocks.”

Yikes!

Let me be clear.  The really, really, really dumb money is jumping into the stock market right now.  Those that are pouring money into stocks today are really going to get hit hard when the crash comes.

And it isn’t just me saying this.

Just consider the words of billionaire hedge fund manager Crispin Odey

Mr Odey is best known for his big macroeconomic calls, including foreseeing the 2008 global credit crisis; piling into insurers in the wake of September 2001 attacks; and picking the recent oil price rout. He famously paid himself £28 million in 2008 after shorting credit crisis casualties, including British lender Bradford & Bingley. Mr Odey’s fund returned 54.8 per cent that year.

“The market’s reaction to all of this is leave it to the professionals, leave it to those great guys, the central bankers, because they saved the day in 2009,” he said. “These guys are kind of relying on central banks pulling a rabbit out of a hat.”

The risk is that this time, monetary policy may be ineffective: “We need the crisis to reformulate policy. Central banks are not all singing and all dancing, they cannot basically avoid the natural consequences of what we are doing.”

An inadequate supply-side response to the plunge in commodity prices as the resources industry declines to reduce production was in effect stimulating supply into falling demand.

“The trouble is today the players, whether they are the miners or the oil companies or the Saudis or anybody else, they are not doing the right things. This is the first time in my career where economics 101 doesn’t work at all.”

But it was also true that the world has not had a major recession for 25 years and thanks to frequent interventions, “there is a sensation we don’t have a business cycle”. Stocks are enjoying a six-year bull market but he also hinted at liquidity issues bubbling under the surface.

I just think that you and I have got grandstand seats here [to an imminent market shock] and my point is having found myself in the second quarter of last year selling a lot of equities and starting to go short, I found out just how illiquid it all was. You never actually see it until people try and get out of these things.”

It was unclear to Mr Odey what central banks could do to prevent a crash.

The warning signs are clear.

Soon the time for warning will be over and the crisis will be here.

I hope that you are getting ready.