Major U.S. Retailers Are Closing More Than 6,000 Stores

Closed - Public DomainIf the U.S. economy really is improving, then why are big U.S. retailers permanently shutting down thousands of stores?  The “retail apocalypse” that I have written about so frequently appears to be accelerating.  As you will see below, major U.S. retailers have announced that they are closing more than 6,000 locations, but economic conditions in this country are still fairly stable.  So if this is happening already, what are things going to look like once the next recession strikes?  For a long time, I have been pointing to 2015 as a major “turning point” for the U.S. economy, and I still feel that way.  And since I started The Economic Collapse Blog at the end of 2009, I have never seen as many indications that we are headed into another major economic downturn as I do right now.  If retailers are closing this many stores already, what are our malls and shopping centers going to look like a few years from now?

The list below comes from information compiled by About.com, but I have only included major retailers that have announced plans to close at least 10 stores.  Most of these closures will take place this year, but in some instances the closures are scheduled to be phased in over a number of years.  As you can see, the number of stores that are being permanently shut down is absolutely staggering…

180 Abercrombie & Fitch (by 2015)

75 Aeropostale (through January 2015)

150 American Eagle Outfitters (through 2017)

223 Barnes & Noble (through 2023)

265 Body Central / Body Shop

66 Bottom Dollar Food

25 Build-A-Bear (through 2015)

32 C. Wonder

21 Cache

120 Chico’s (through 2017)

200 Children’s Place (through 2017)

17 Christopher & Banks

70 Coach (fiscal 2015)

70 Coco’s /Carrows

300 Deb Shops

92 Delia’s

340 Dollar Tree/Family Dollar

39 Einstein Bros. Bagels

50 Express (through 2015)

31 Frederick’s of Hollywood

50 Fresh & Easy Grocey Stores

14 Friendly’s

65 Future Shop (Best Buy Canada)

54 Golf Galaxy (by 2016)

50 Guess (through 2015)

26 Gymboree

40 JCPenney

127 Jones New York Outlet

10 Just Baked

28 Kate Spade Saturday & Jack Spade

14 Macy’s

400 Office Depot/Office Max (by 2016)

63 Pep Boys (“in the coming years”)

100 Pier One (by 2017)

20 Pick ’n Save (by 2017)

1,784 Radio Shack

13 Ruby Tuesday

77 Sears

10 SpartanNash Grocery Stores

55 Staples (2015)

133 Target, Canada (bankruptcy)

31 Tiger Direct

200 Walgreens (by 2017)

10 West Marine

338 Wet Seal

80 Wolverine World Wide (2015 – Stride Rite & Keds)

So why is this happening?

Without a doubt, Internet retailing is taking a huge toll on brick and mortar stores, and this is a trend that is not going to end any time soon.

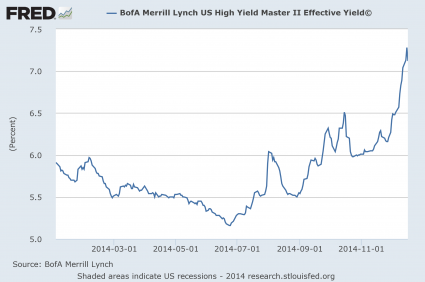
But as Thad Beversdorf has pointed out, we have also seen a stunning decline in true discretionary consumer spending over the past six months…

What we find is that over the past 6 months we had a tremendous drop in true discretionary consumer spending. Within the overall downtrend we do see a bit of a rally in February but quite ominously that rally failed and the bottom absolutely fell out. Again the importance is it confirms the fundamental theory that consumer spending is showing the initial signs of a severe pull back. A worrying signal to be certain as we would expect this pull back to begin impacting other areas of consumer spending. The reason is that American consumers typically do not voluntarily pull back like that on spending but do so because they have run out of credit. And if credit is running thin it will surely be felt in all spending.

The truth is that middle class U.S. consumers are tapped out.  Most families are just scraping by financially from month to month.  For most Americans, there simply is not a whole lot of extra money left over to go shopping with these days.

In fact, at this point approximately one out of every four Americans spend at least half of their incomes just on rent

More than one in four Americans are spending at least half of their family income on rent – leaving little money left to purchase groceries, buy clothing or put gas in the car, new figures have revealed.

A staggering 11.25 million households consume 50 percent or more of their income on housing and utilities, according to an analysis of Census data by nonprofit firm, Enterprise Community Partners.

And 1.8 million of these households spend at least 70 percent of their paychecks on rent.

The surging cost of rental housing has affected a rising number of families since the Great Recession hit in 2007. Officials define housing costs in excess of 30 percent of income as burdensome.

For decades, the U.S. economy was powered by a free spending middle class that had plenty of discretionary income to throw around.  But now that the middle class is being systematically destroyed, that paradigm is changing.  Americans families simply do not have the same resources that they once did, and that spells big trouble for retailers.

As you read this article, the United States still has more retail space per person than any other nation on the planet.  But as stores close by the thousands, “space available” signs are going to be popping up everywhere.  This is especially going to be true in poor and lower middle class neighborhoods.  Especially after what we just witnessed in Baltimore, many retailers are not going to hesitate to shut down underperforming locations in impoverished areas.

And remember, the next major economic crisis has not even arrived yet.  Once it does, the business environment in this country is going to change dramatically, and a few years from now America is going to look far different than it does right now.


The Stock Market In 2015 Is Starting To Look Remarkably Similar To The Stock Market In 2008

Bubble Mirror - Public DomainAre we watching a replay of the last financial crisis?  Over the past six months, the price of oil has collapsed, the U.S. dollar has soared, and a whole bunch of other patterns that we witnessed just before the stock market crash of 2008 are repeating once again.  But what we have not seen yet is the actual stock market crash.  So will there be one this year?  In this article, I am going to compare the performance of the Dow Jones Industrial Average during the first three months of 2008 to the performance of the Dow Jones Industrial Average during the first three months of 2015.  As you will see, there are some striking similarities.  And without a doubt, we are overdue for a major market downturn.  The S&P 500 has risen for six years in a row, but it has never had seven up years consecutively.  In addition, there has not even been a 10 percent stock market “correction” is almost three and a half years.  So will stocks be able to continue to defy both gravity and the forces of economic reality?  Only time will tell.

Below is a chart that shows how the Dow Jones Industrial Average performed during the first three months of 2008.  It was a time of increased volatility, but the market pretty much went nowhere.  This is typical of what we see in the months leading up to a market crash.  The markets start getting really choppy with large ups and large downs…

Dow First 3 Months Of 2008

This next chart shows how the Dow Jones Industrial Average has performed during the first three months of 2015.  Once again, we are witnessing a time of increased volatility, but the market is not really going anywhere.  In fact, after falling about 200 points on Tuesday (not shown on this chart) it is just barely below where it started the year…

Dow First 3 Months Of 2015

When the market becomes quite restless but it doesn’t really move anywhere, that is a sign that we have reached a turning point.  The following is what a recent CNN article had to say about the rising volatility that we have been witnessing…

The Dow fell nearly 3.7% in January, surged 5.6% in February and is down about 2% this month. The S&P 500 and Nasdaq have gone through similar sentiment swings. The Dow ended the quarter slightly in the red while the S&P 500 and Nasdaq were up a little bit.

Charles Schwab chief investment officer Liz Ann Sonders summed up this volatility the best — with a nod to U2. “Running to Stand Still: Wild Swings Taking Market Nowhere” is the title of her most recent market commentary.

What can investors expect for the rest of 2015? Probably a lot more of the same.

Now let’s look at a chart for the entire year of 2008.  After peaking for the year in early May, the Dow started to slide.  Things started to get really crazy in September, and by the end of the year the U.S. economy was plunged into the greatest crisis since the Great Depression…

Dow Full Year Of 2008

Will the rest of 2015 follow a similar pattern?

A lot of investors are actually betting that this will be the case.

Right now, hundreds of millions of dollars are flowing into VXX – an ETF that makes money when the Chicago Board Options Exchange Volatility Index goes up.  In other words, these investors are betting that we are going to see a lot more stock market volatility in the weeks and months to come.

And as I have said so many times before, stocks tend to rise in calm markets and they tend to fall when the markets become volatile.

So essentially these investors are betting that we are headed for a stock market crash.

The following is more on the massive inflow of money into VXX that we have been seeing from the Crux

Ways to speculate on how noisy the stock market will be have exploded in the last decade with the advent of products tied to the Chicago Board Options Exchange Volatility Index. Strategies include relatively simple hedges against equity losses, such as owning a security that aims to mimic the VIX.

VXX, one of the most popular ways to bet on bigger market swings, has absorbed $715 million in seven consecutive weeks of inflows, its longest streak of inflows since one ending in July 2012. The infusion of fresh cash has continued this week, swelling its market value to $1.5 billion, the highest since September 2013.

At the same time, short-sellers in VXX — people effectively betting the bull market will persist — have dropped out. Short interest has slid 35 percent since October, falling to the lowest in more than seven months last week, data compiled by Markit Ltd. show.

And many of the exact same people that warned us about the financial crisis of 2008 in advance are warning that another crisis is rapidly approaching.  For example, check out the following quote from Ann Pettifor that recently appeared in an article in the Guardian

As Janet Yellen’s Federal Reserve prepares to raise interest rates, boosting the value of the dollar, while the plunging price of crude puts intense pressure on the finances of oil-exporting countries, there are growing fears of a new debt crisis in the making.

Ann Pettifor of Prime Economics, who foreshadowed the credit crunch in her 2003 book The Coming First World Debt Crisis, says: “We’re going to have another financial crisis. Brazil’s already in great trouble with the strength of the dollar; I dread to think what’s happening in South Africa; then there’s Malaysia. We’re back to where we were, and that for me is really frightening.”

Pettifor is right on two counts – another major financial crisis is approaching, and it is going to be global in scope.

Before I end this article, there are two more items that I would like to share with you.

Firstly, it is being reported that the IPO market has really cooled off in 2015.  When the number of companies going public starts to decline, that is a clear sign that a stock market bubble is on borrowed time.  The following comes from Business Insider

The number of US companies going public has really dropped off lately.

“After a record year in 2014, the IPO market slowed dramatically in the first quarter of 2015,” Renaissance Capital analysts said.

The first quarter of 2015, which ended Tuesday, was the slowest quarter for IPOs since the first quarter of 2013. While stock prices have been near all-time highs, market volatility has been escalating, turning companies off from trying to unload shares onto the public markets.

Secondly, the San Francisco housing market has been a pretty reliable indicator of previous economic booms and busts.  The San Francisco housing market started to cool off before the dotcom bubble burst, it started to cool off before the stock market crash of 2008, and now it is cooling off once again.  The following chart comes from Zero Hedge

San Francisco - Zero Hedge

The warning signs are there.

But as with so many other things in life, most people are going to end up believing precisely what they want to believe.

So what do you believe about what the rest of the year will bring?  Please feel free to share your thoughts by posting a comment below…

The Shemitah: The Biblical Pattern Which Indicates That A Financial Collapse May Be Coming In 2015

The Shemitah- Financial Collapse In 2015Does a mystery that is 3,500 years old hold the key to what is going to happen to global financial markets in 2015?  Could it be possible that the timing of major financial crashes is not just a matter of coincidence?  In previous articles on my website, I have discussed some of the major economic and financial cycle theories and their proponents.  For example, in an article entitled “If Economic Cycle Theorists Are Correct, 2015 To 2020 Will Be Pure Hell For The United States“, I examined a number of economic cycle theories that seem to indicate that the second half of this decade is going to be a nightmare economically.  But the cycle that I am going to discuss in this article is a lot more controversial than any of those.  In his most recent book, Jonathan Cahn has demonstrated that almost all of the major financial crashes in U.S. history are very closely tied to a seven year pattern that we find in the Bible known as “the Shemitah”.  Since that book was released, I have been asked about this repeatedly during radio appearances.  So in this article I am going to attempt to explain what the Shemitah is, and what this Biblical pattern seems to indicate may happen in 2015.  If you are an atheist, an agnostic, or are generally skeptical by nature, this article might prove quite challenging for you.  I would ask that you withhold judgment until you have examined the evidence.  When I first heard about these things, I had to go verify the facts for myself, because they are truly extraordinary.

So precisely what is “the Shemitah”?

In the Bible, the people of Israel were commanded to let the land lie fallow every seven years.  There would be no sowing and no reaping, and this is something that God took very seriously.  In fact, the failure to observe these Sabbath years was one of the main reasons cited in the Scriptures for why the Jewish people were exiled to Babylon in 586 BC.

But there was more to the Shemitah year than just letting the land lie fallow.

On the last day of the Shemitah year, the people of Israel were instructed to perform a releasing of debts.  We find the following in Deuteronomy chapter 15

At the end of every seven years you shall grant a relinquishing of debtsThis is the manner of the relinquishing: Every creditor that has loaned anything to his neighbor shall relinquish it. He shall not exact it of his neighbor, or of his brother, because it is called the Lord’s relinquishment.

This happened at the end of every seven years on Elul 29 – the day right before Rosh Hashanah on the Biblical calendar.

So what does this have to do with us today?

Well, if you go back to the last day of the Shemitah year in 2001, you will find that there was an absolutely horrifying stock market crash.

On September 17th, 2001 (which was Elul 29 on the Jewish calendar), we witnessed the greatest one day stock market crash in U.S. history up to that time.  The Dow fell an astounding 684 points, and it was a record that held for precisely seven years until the end of the next Shemitah year.

At the end of the next Shemitah year in 2008, another horrifying stock market crash took place.  On September 29th, 2008 the Dow plummeted 777 points, which still today remains the greatest one day stock market crash of all time.  It turns out that September 29th, 2008 corresponded with Elul 29 on the Jewish calendar – the precise day when the Bible calls for a releasing of debts.

So on the very last day of the last two Shemitah years, the stock market crashed so badly that it set a brand new all-time record.

And now we are in another Shemitah year.  It began last fall, and it will end next September.

Could it be possible that we will see another historic market crash?

Author Jonathan Cahn has correctly pointed out that we should never put God in a box.  Just because something has happened in the past does not mean that it will happen again.  But we should not rule anything out either.

Perhaps God is using His calendar to make a point.  Cahn believes that if we are going to see something happen, it will probably occur as the Shemitah year comes to an end

Cahn has pointed that, according to his research, the worst of the worst usually happens at the end of the Shemitah year, not at the beginning. In fact, the last day of the year, Elul 29 on the Hebrew calendar, which will occur on Sept. 13, 2015, is the most dreaded day.

The pattern revealed in “The Mystery of the Shemitah” is that the beginning of the Shemitah’s impact is often subtle, but leads to a dramatic climax.

“The beginning may mark a change in direction, even a foreshadow of what will come to a crescendo at the Shemitah’s end,” he said.

And this time around, far more people are paying attention.  Back in 2001 and 2008, most Americans had absolutely no idea what a “Shemitah year” was.  But now it is being talked about on some of the most prominent alternative news websites on the Internet.  For example, the following is what Joseph Farah of WND has to say about the Shemitah year…

Farah believes the date Sept. 13, 2015 bears close watching – though he is quick to admit he has no idea what, if anything, will happen in America.

“A clear pattern has been established,” he says. “I don’t believe it’s a coincidence what happened in America on Elul 29 in 2001 and 2008. It would be foolish to ignore the possibility that a greater judgment might be in the works – especially if America continues to move away from God and His Word.”

The Shemitah year that we are in now does end on September 13th, 2015 – and that falls on a Sunday so the markets will be closed.

But what it comes to the Shemitah, we aren’t just looking at one particular day.

And it is very interesting to note that there will also be a solar eclipse on September 13th, 2015.  Over the past century, there have only been two other times when a solar eclipse has corresponded with the end of a Shemitah year.  Those two times were in 1931 and 1987, and as Jonathan Cahn has told WND, those solar eclipses foreshadowed major financial disasters…

In 1931, a solar eclipse took place on Sept. 12 – the end of a “Shemitah” year. Eight days later, England abandoned the gold standard, setting off market crashes and bank failures around the world. It also ushered in the greatest monthlong stock market percentage crash in Wall Street history.

In 1987, a solar eclipse took place Sept. 23 – again the end of a “Shemitah” year. Less than 30 days later came “Black Monday” the greatest percentage crash in Wall Street history.

Is Cahn predicting doom and gloom on Sept. 13, 2015? He’s careful to avoid a prediction, saying, “In the past, this ushered in the worst collapses in Wall Street history. What will it bring this time? Again, as before, the phenomenon does not have to manifest at the next convergence. But, at the same time, and again, it is wise to take note.”

So what is going to happen this time?

We will just have to wait and see.

But without a doubt so many of the same patterns that we witnessed just prior to the financial crash of 2008 are happening again right before our very eyes.

It has been said that those that do not learn from history are doomed to repeat it.

Perhaps you believe that there is something to “the Shemitah”, or perhaps you think that it is all a bunch of nonsense.

But at least now you know what everyone is talking about.  What you choose to do with this information is up to you.


10 Key Events That Preceded The Last Financial Crisis That Are Happening Again RIGHT NOW

10 Key Events That Preceded The Last Financial CrisisIf you do not believe that we are heading directly toward another major financial crisis, you need to read this article.  So many of the exact same patterns that preceded the great financial collapse of 2008 are happening again right before our very eyes.  History literally appears to be repeating, but most Americans seem absolutely oblivious to what is going on.  The mainstream media and our politicians are promising them that everything is going to be okay somehow, and that seems to be good enough for most people.  But the signs that another massive financial crisis is on the horizon are everywhere.  All you have to do is open up your eyes and look at them.

Bill Gross, considered by many to be the number one authority on government bonds on the entire planet, made headlines all over the world on Tuesday when he released his January Investment Outlook.  I don’t know if we have ever seen Gross be more negative about a new year than he is about 2015.  For example, just consider this statement

“When the year is done, there will be minus signs in front of returns for many asset classes. The good times are over.”

And this is how he ended the letter

And so that is why – at some future date – at some future Ides of March or May or November 2015, asset returns in many categories may turn negative. What to consider in such a strange new world? High-quality assets with stable cash flows. Those would include Treasury and high-quality corporate bonds, as well as equities of lightly levered corporations with attractive dividends and diversified revenues both operationally and geographically. With moments of liquidity having already been experienced in recent months, 2015 may see a continuing round of musical chairs as riskier asset categories become less and less desirable.

Debt supercycles in the process of reversal are not favorable events for future investment returns. Father Time in 2015 is not the babe with a top hat in our opening cartoon. He is the grumpy old codger looking forward to his almost inevitable “Ides” sometime during the next 12 months. Be cautious and content with low positive returns in 2015. The time for risk taking has passed.

So why are Gross and so many other financial experts being so “negative” right now?

It is because they can see what is happening.

They can see the same patterns that we saw in early 2008 unfolding again right in front of us.  I wanted to put these patterns in a single article so that they will be easy to share with people.  The following are 10 key events that preceded the last financial crisis that are happening again right now…

#1 A really bad start to the year for the stock market.  During the first three trading days of 2015, the S&P 500 was down a total of 2.73 percent.  There are only two times in history when it has declined by more than three percent during the first three trading days of a year.  Those years were 2000 and 2008, and in both years we witnessed enormous stock market declines.

#2 Very choppy financial market behavior.  This is something that I discussed yesterday.  In general, calm markets tend to go up.  When markets get choppy, they tend to go down.  For example, the chart that I have posted below shows how the Dow Jones Industrial Average behaved from the beginning of 2006 to the end of 2008.  As you can see, the Dow was very calm as it rose throughout 2006 and most of 2007, but it got very choppy as 2008 played out…

The Dow 2006 to 2008

As I also mentioned yesterday, it is important not to get fooled if stocks soar on a particular day.  The three largest single day stock market gains in history were right in the middle of the financial crisis of 2008.  When you start to see big ups and big downs in the market, that is a sign of big trouble ahead.  That is why it is so alarming that global financial markets have begun to become quite choppy in recent weeks.

#3 A substantial decline for 10 year bond yields.  When investors get scared, there tends to be a “flight to safety” as investors move their money to safer investments.  We saw this happen in 2008, and that is happening again right now.

In fact, according to Bloomberg, global 10 year bond yields have already dropped to low levels that are absolutely unprecedented…

Taken together, the average 10-year bond yield of the U.S., Japan and Germany has dropped below 1 percent for the first time ever, according to Steven Englander, global head of G-10 foreign-exchange strategy at Citigroup Inc.

That’s not good news. The rock-bottom rates, which fall below zero when inflation is taken into account, show “that investors think we are going nowhere for a long time,” Englander wrote in a report yesterday.

#4 The price of oil crashes.  As I write this, the price of U.S. oil has dipped below $48 a barrel.  But back in June, it was sitting at $106 at one point.  As the chart below demonstrates, there is only one other time in history when the price of oil has declined by more than $50 in less than a year…

Price Of Oil 2015

The only other time there has been an oil price collapse of this magnitude we experienced the greatest financial crisis since the Great Depression shortly thereafter.  Are we about to see history repeat?  For much more on this, please see my previous article entitled “Guess What Happened The Last Time The Price Of Oil Crashed Like This?

#5 A dramatic drop in the number of oil and gas rigs in operation.  Right now, oil and gas rigs are going out of operation at a frightening pace.  During the fourth quarter of 2014, 93 oil and gas rigs were idled, and it is being projected that another 200 will shut down this quarter.  As this Business Insider article demonstrates, this is also something that happened during the financial crisis of 2008 and it continued well into 2009.

#6 The price of gasoline takes a huge tumble.  Millions of Americans are celebrating that the price of gasoline has plummeted in recent weeks.  But they were also celebrating when it happened back in 2008 as well.  But of course it turned out that there was really nothing to celebrate in 2008.  In short order, millions of Americans lost their jobs and their homes.  So the chart that I have posted below is definitely not “good news”…

Gas Price 2015

#7 A broad range of industrial commodities begin to decline in price.  When industrial commodities go down in price, that is a sign that economic activity is slowing down.  And just like in 2008, that is what we are watching unfold on the global stage right now.  The following is an excerpt from a recent CNBC article

From nickel to soybean oil, plywood to sugar, global commodity prices have been on a steady decline as the world’s economy has lost momentum.

For an extended discussion on this, please see my recent article entitled “Not Just Oil: Guess What Happened The Last Time Commodity Prices Crashed Like This?

#8 A junk bond crash.  Just like in 2008, we are witnessing the beginnings of a junk bond collapse.  High yield debt related to the energy industry is on the bleeding edge of this crash, but in recent weeks we have seen investors start to bail out of a broad range of junk bonds.  Check out this chart and this chart in addition to the chart that I have posted below…

High Yield Debt 2015

#9 Global inflation slows down significantly.  When economic activity slows down, so does inflation.  This is something that we witnessed in 2008, this is also something that is happening once again.  In fact, it is being projected that global inflation is about to fall to the lowest level that we have seen since World War II

Increases in the prices of goods and services in the world’s largest economies are slowing dramatically. Analysts are predicting that inflation will fall below 2pc in all of the countries that make up the G7 group of advanced nations this year – the first time that has happened since before the Second World War.

Indeed, Japan was the only G7 country whose inflation rate was above 2pc last year. And economists believe that was because its government increased sales tax which had the effect of artificially boosting prices.

#10 A crisis in investor confidence.  Just prior to the last financial crisis, the confidence that investors had that we would be able to avoid a stock market collapse in the next six months began to decline significantly.  And guess what?  That is something else that is happening once again…

Investor confidence that the US will avoid a stock-market crash in the next six months has dropped dramatically since last spring.

The Yale School of Management publishes a monthly Crash Confidence Index. The index shows the proportion of investors who believe we will avoid a stock-market crash in the next six months.

Yale points out that “crash confidence reached its all-time low, both for individual and institutional investors, in early 2009, just months after the Lehman crisis, reflecting the turmoil in the credit markets and the strong depression fears generated by that event, and is plausibly related to the very low stock market valuations then.”

Are you starting to get the picture?

And of course I am not the only one warning about these things.  As I wrote about earlier in the week, there are a whole host of prominent voices that are now warning of imminent financial danger.

Today, I would like to add one more name to the list.  He is respected author James Howard Kunstler, and what he predicts is coming in 2015 is absolutely chilling

*****

Here are my financial forecast particulars for 2015:

  • Early in 2015 the ECB proposes a lame QE program and is laughed out of the room. European markets tank.
  • Greek elections in January produce a government that stands up to the EU and ECB and causes a fatal slippage of faith in the ability of that project to continue.
  • Second half of 2015, the rest of the world gangs up and counter-attacks the US dollar.
  • Bond markets in Europe implode in first half and the contagion spreads to the US as fear and distrust rises about viability of US safe haven status.
  • Derivatives associated with currencies, interest rates, and junk bonds trigger a bloodbath in credit default swaps (CDS) and the appearance of countless black holes through which debt and “wealth” disappear forever.
  • US stock markets continue to bid upward in the first half of 2015, crater in Q3 as faith in paper and pixels erodes. DJA and S & P fall 30 to 40 percent in the initial crash, then further into 2016.
  • Gold and silver slide in the first half, then take off as debt and equity markets craters, faith in abstract instruments evaporates, faith in central bank omnipotence dissolves, and citizens all over the world desperately seek safety from currency war.
  • Goldman Sachs, Citicorp, Morgan Stanley, Bank of America, DeutscheBank, SocGen, all succumb to insolvency. American government and Federal Reserve officials don’t dare attempt to rescue them again.
  • By the end of 2015, central banks everywhere stand in general discredit. In the US, the Federal Reserve’s mandate is publically debated and revised back to its original mission as lender of last resort. It is forbidden to engage in further interventions and a new less-secretive mechanism is drawn up for regulating basic interest rates.
  • Oil prices creep back into the $65 – $70 range by May 2015. It is not enough to halt the destruction in the shale, tar sand, and deepwater sectors. As contraction in the failing global economy accelerates, oil sinks back to the $40 range in October…
  • …unless mischief in the Middle East (in particular, the Islamic State messing with Saudi Arabia) leads to gross and perhaps fatally permanent disruption in world oil markets — and then all bets are off for both the continuity of advanced economies and for peace between nations.

*****

Personally, I don’t agree with Kunstler on all of the particulars and the timing of certain events, but overall I think that we are going to look back when the year is done and say that he was a lot more right than he was wrong.

We are moving into a time of extreme danger for the global economy.  There has never been a time when I have been more concerned about a new year since I began The Economic Collapse Blog back in 2009.

Over the past couple of years, we have been very blessed to be able to enjoy a bubble of relative stability.  But this period of stability also fooled many people into thinking that our economic problems had been fixed, when in reality they have only gotten worse.

We consume far more wealth than we produce, our debt levels are at record highs and we are at the tail end of the largest Wall Street financial bubble in all of history.

It is inevitable that we are heading for a tragic conclusion to all of this.  It is just a matter of time.


The American People Are Utterly Clueless About What Is Going To Happen As We Enter 2015

Wrong Way - Public DomainThe American people are feeling really good right about now.  For example, Gallup’s economic confidence index has hit the highest level that we have seen since the last recession.  In addition, nearly half of all Americans believe that 2015 will be a better year than 2014 was, and only about 10 percent believe that it will be a worse year.  And a lot of people are generally feeling quite good about the people that have been leading our nation.  According to Gallup, once again this year Hillary Clinton is the most admired woman in America and Barack Obama is the most admired man in America.  I don’t know what that says about our nation, but it can’t be good.  Unfortunately, when things seem to be going well common sense tends to go out the window.  A couple days ago, the Guardian ran an article entitled “Goodbye to one of the best years in history“, and a whole lot of people out there are feeling really optimistic these days.  But should they be?

Sadly, what we are experiencing right now is so similar to what we witnessed in 2007 and early 2008.  The stock market had been on a great run, people were flipping houses like crazy and most people were convinced that the party would never end.

But then it did end – very painfully.

The signs of trouble were there, but most people chose to ignore them.

Sadly, the exact same thing is happening again.

On Monday, the price of oil hit a brand new five year low.  As I write this, U.S. oil is sitting at a price of $53.76 a barrel, which is nearly a 50 percent decline from the peak earlier this year.

There is only one other time in history when the price of oil has declined by more than 50 dollars a barrel in such a short time frame.  That was back in the middle of 2008, shortly before the worst stock market crash since the Great Depression.

Unless the price of oil starts really bouncing back, the U.S. economy is going to be hit really hard.

Since 2009, oil industry employment has risen by 50 percent.  And jobs in the oil industry pay quite well.  One figure that I saw put the average weekly wage at about 1700 dollars.

But now we aren’t going to be gaining those types of jobs.  Instead, we are going to rapidly start losing them.

Already, the oil rig count has dropped for three weeks in a row and is now at an 8 month low.  And as the oil industry suffers, all of the industries that it supports are also going to start feeling the pain.  In fact, Business Insider is reporting that Texas business executives are “freaked out” about what is happening…

Business executives in Texas are worried about the drop in oil prices.

On Monday, the Dallas Fed’s latest manufacturing survey showed that activity in Texas was slowing down.

The latest composite index came in at 4.1, widely missing expectations and down big from November’s reading. Expectations were for the index to come in at 9, down from 10.5 last month.

So while most Americans are feeling really good about the coming year, many of those with an inside view are becoming quite alarmed.  One Texas business executive went so far as to say that the stunning decline in oil prices was going to make things ugly … quickly.

Meanwhile, the 9 trillion dollar U.S. dollar carry trade is starting to unwind.

The following is an excerpt from a recent Zero Hedge article

Oil’s collapse is predicated by one major event: the explosion of the US Dollar carry trade. Worldwide, there is over $9 TRILLION in borrowed US Dollars that has been ploughed into risk assets.

Energy projects, particularly Oil Shale in the US, are one of the prime spots for this. But it is not the only one. Economies that are closely aligned with commodities (all of which are priced in US Dollars) are getting demolished too.

Just about everything will be hit as well. Most of the “recovery” of the last five years has been fueled by cheap borrowed Dollars. Now that the US Dollar has broken out of a multi-year range, you’re going to see more and more “risk assets” (read: projects or investments fueled by borrowed Dollars) blow up. Oil is just the beginning, not a  standalone story.

If things really pick up steam, there’s over $9 TRILLION worth of potential explosions waiting in the wings. Imagine if the entire economies of both Germany and Japan exploded and you’ve got a decent idea of the size of the potential impact on the financial system.

And that’s assuming NO increased leverage from derivative usage.

Ouch.

And yes, as that last excerpt mentioned, derivatives could soon become a massive problem.  The big banks are holding trillions in commodity derivatives that could blow up if the price of oil does not rebound.  Overall, there are five U.S. banks that each have more than 40 trillion dollars of exposure to derivatives of all types, and the total global derivatives bubble is at least 700 trillion dollars at this point.

At the same time, many are becoming concerned that the unprecedented bond bubble that we are witnessing could soon implode and trillions of dollars of “wealth” could disappear into thin air.

In fact, Bloomberg says that we should “get ready for a disastrous year” for bonds…

Get ready for a disastrous year for U.S. government bonds. That’s the message forecasters on Wall Street are sending.

With Federal Reserve Chair Janet Yellen poised to raise interest rates in 2015 for the first time in almost a decade, prognosticators are convinced Treasury yields have nowhere to go except up. Their calls for higher yields next year are the most aggressive since 2009, when U.S. debt securities suffered record losses, according to data compiled by Bloomberg.

That certainly does not sound very optimistic, does it?

Anyone with even a minimal amount of intelligence should be able to see the massive financial bubbles that the central banks of the world have created, and anyone with even a minimal amount of intelligence should be able to see that we are heading for a massive financial implosion which will be extraordinarily painful.

Unfortunately, as I wrote about yesterday, the American people have become “zombiefied“.  Instead of thinking for themselves, they let “the matrix” do their thinking for them.  And right now “the matrix” is telling them that everything is going to be just fine in 2015.

If you do not think that there is a propaganda machine that tells us what to think, I want you to watch the video posted below very carefully.  This video makes it so obvious that even a small child can understand it…


Junk Bonds Are Going To Tell Us Where The Stock Market Is Heading In 2015

Dominoes - Public DomainDo you want to know if the stock market is going to crash next year?  Just keep an eye on junk bonds.  Prior to the horrific collapse of stocks in 2008, high yield debt collapsed first.  And as you will see below, high yield debt is starting to crash again.  The primary reason for this is the price of oil.  The energy sector accounts for approximately 15 to 20 percent of the entire junk bond market, and those energy bonds are taking a tremendous beating right now.  This panic in energy bonds is infecting the broader high yield debt market, and investors have been pulling money out at a frightening pace.  And as I have written about previously, almost every single time junk bonds decline substantially, stocks end up following suit.  So don’t be fooled by the fact that some comforting words from Janet Yellen caused stock prices to jump over the past couple of days.  If you really want to know where the stock market is heading in 2015, keep a close eye on the market for high yield debt.

If you are not familiar with junk bonds, the concept is actually very simple.  Corporations that do not have high credit ratings typically have to pay higher interest rates to borrow money.  The following is how USA Today describes these bonds…

High-yield bonds are long-term IOUs issued by companies with shaky credit ratings. Just like credit card users, companies with poor credit must pay higher interest rates on loans than those with gold-plated credit histories.

But in recent years, interest rates on junk bonds have gone down to ridiculously low levels.  This is another bubble that was created by Federal Reserve policies, and it is a colossal disaster waiting to happen.  And unfortunately, there are already signs that this bubble is now beginning to burst

Back in June, the average junk bond yield was 3.90 percentage points higher than Treasury securities. The average energy junk bond yielded 3.91 percentage points higher than Treasuries, Lonski says.

That spread has widened to 5.08 percentage points for junk bonds vs. 7.86 percentage points for energy bonds — an indication of how worried investors are about default, particularly for small, highly indebted companies in the fracking business.

The reason why so many analysts are becoming extremely concerned about this shift in junk bonds is because we also saw this happen just before the great stock market crash of 2008.  In the chart below, you can see how yields on junk bonds started to absolutely skyrocket in September of that year…

High Yield Debt 2008

Of course we have not seen a move of that magnitude quite yet this year, but without a doubt yields have been spiking.  The next chart that I want to share is of this year.  As you can see, the movement over the past month or so has been quite substantial…

High Yield Debt 2014

And of course I am far from the only one that is watching this.  In fact, there are some sharks on Wall Street that plan to make an absolute boatload of cash as high yield bonds crash.

One of them is Josh Birnbaum.  He correctly made a giant bet against subprime mortgages in 2007, and now he is making a giant bet against junk bonds

When Josh Birnbaum was at Goldman Sachs in 2007, he made a huge bet against subprime mortgages.

Now he’s betting against something else: high-yield bonds.

From The Wall Street Journal:

Joshua Birnbaum, the ex-Goldman Sachs Group Inc. trader who made bets against subprime mortgages during the financial crisis, now has more than $2 billion in wagers against high-yield bonds at his Tilden Park Capital Management LP hedge-fund firm, according to investor documents.

Could you imagine betting 2 billion dollars on anything?

If he is right, he is going to make an incredible amount of money.

And I have a feeling that he will be.  As a recent New American article detailed, there is already panic in the air…

It’s a mania, said Tim Gramatovich of Peritus Asset Management who oversees a bond portfolio of $800 million: “Anything that becomes a mania — ends badly. And this is a mania.”

Bill Gross, who used to run PIMCO’s gigantic bond portfolio and now advises the Janus Capital Group, explained that “there’s very little liquidity” in junk bonds. This is the language a bond fund manager uses to tell people that no one is buying, everyone is selling. Gross added: “Everyone is trying to squeeze through a very small door.”

Bonds issued by individual energy developers have gotten hammered. For instance, Energy XXI, an oil and gas producer, issued more than $2 billion in bonds just in the last four years and, up until a couple of weeks ago, they were selling at 100 cents on the dollar. On Friday buyers were offering just 64 cents. Midstates Petroleum’s $700 million in bonds — rated “junk” by both Moody’s and Standard and Poor’s — are selling at 54 cents on the dollar, if buyers can be found.

So is there anything that could stop junk bonds from crashing?

Yes, if the price of oil goes back up to 80 dollars or more a barrel that would go a long way to settling things back down.

Unfortunately, many analysts are convinced that the price of oil is going to head even lower instead…

“We’re continuing to search for a bottom, and might even see another significant drop before the year-end,” said Gene McGillian, an analyst at Tradition Energy in Stamford, Connecticut.

As I write this, the price of U.S. oil has fallen $1.69 today to $54.78.

If the price of oil stays this low, junk bonds are going to keep crashing.

If junk bonds keep crashing, the stock market is almost certainly going to follow.

For additional reading on this, please see my previous article entitled “‘Near Perfect’ Indicator That Precedes Almost Every Stock Market Correction Is Flashing A Warning Signal“.

But just like in the years leading up to the crash of 2008, there are all kinds of naysayers proclaiming that a collapse will never happen.

Even though our financial problems and our underlying economic fundamentals have gotten much worse since the last crisis, they are absolutely convinced that things are somehow going to be different this time.

In the end, a lot of those skeptics are going to lose an enormous amount of money when the dominoes start falling.

Anyone That Believes That Collapsing Oil Prices Are Good For The Economy Is Crazy

Oil - Public DomainAre much lower oil prices good news for the U.S. economy?  Only if you like collapsing capital expenditures, rising unemployment and a potential financial implosion on Wall Street.  Yes, lower gasoline prices are good news for the middle class.  I certainly would rather pay two dollars for a gallon of gas than four dollars.  But in order to have money to fill up your vehicle you have got to have an income first.  And since the last recession, the energy sector has been the number one creator of good jobs in the U.S. economy by far.  Barack Obama loves to stand up and take credit for the fact that the employment picture in this country has been improving slightly, but without the energy industry boom, unemployment would be through the roof.  And now that the “energy boom” is rapidly becoming an “energy bust”, what will happen to the struggling U.S. economy as we head into 2015?

At the start of this article I mentioned that much lower oil prices would result in “collapsing capital expenditures”.

If you do not know what a “capital expenditure” is, the following is a definition that comes from Investopedia

“Funds used by a company to acquire or upgrade physical assets such as property, industrial buildings or equipment. This type of outlay is made by companies to maintain or increase the scope of their operations. These expenditures can include everything from repairing a roof to building a brand new factory.”

Needless to say, this kind of spending is very good for an economy.  It builds infrastructure, it creates jobs and it is an investment in the future.

In recent years, energy companies have been pouring massive amounts of money into capital expenditures.  In fact, the energy sector currently accounts for about a third of all capital expenditures in the United States according to Deutsche Bank

US private investment spending is usually ~15% of US GDP or $2.8trn now. This investment consists of $1.6trn spent annually on equipment and software, $700bn on non-residential construction and a bit over $500bn on residential. Equipment and software is 35% technology and communications, 25-30% is industrial equipment for energy, utilities and agriculture, 15% is transportation equipment, with remaining 20-25% related to other industries or intangibles. Non-residential construction is 20% oil and gas producing structures and 30% is energy related in total. We estimate global investment spending is 20% of S&P EPS or 12% from US. The Energy sector is responsible for a third of S&P 500 capex.

These companies make these investments because they believe that there are big profits to be made.

Unfortunately, when the price of oil crashes those investments become unprofitable and capital expenditures start getting slashed almost immediately.

For example, the budget for 2015 at ConocoPhillips has already been reduced by 20 percent

ConocoPhillips is one of the bigger shale players. And its decision to slash its budget for next year by 20% is raising eyebrows. The company said the new target reflects lower spending on major projects as well as “unconventional plays.” Despite the expectation that others will follow, it doesn’t mean U.S. shale oil production is dead. Just don’t expect a surge in spending like in recent years.

And Reuters is reporting that the number of new well permits for the industry as a whole plunged by an astounding 40 percent during the month of November…

Plunging oil prices sparked a drop of almost 40 percent in new well permits issued across the United States in November, in a sudden pause in the growth of the U.S. shale oil and gas boom that started around 2007.

Data provided exclusively to Reuters on Tuesday by industry data firm Drilling Info Inc showed 4,520 new well permits were approved last month, down from 7,227 in October.

If the price of oil stays this low or continues dropping, this is just the beginning.

Meanwhile, the flow of good jobs that this industry has been producing is also likely to start drying up.

According to the Perryman Group, the energy sector currently supports 9.3 million permanent jobs in this country

According to a new study, investments in oil and gas exploration and production generate substantial economic gains, as well as other benefits such as increased energy independence. The Perryman Group estimates that the industry as a whole generates an economic stimulus of almost $1.2 trillion in gross product each year, as well as more than 9.3 million permanent jobs across the nation.

The ripple effects are everywhere. If you think about the role of oil in your life, it is not only the primary source of many of our fuels, but is also critical to our lubricants, chemicals, synthetic fibers, pharmaceuticals, plastics, and many other items we come into contact with every day. The industry supports almost 1.3 million jobs in manufacturing alone and is responsible for almost $1.2 trillion in annual gross domestic product. If you think about the law, accounting, and engineering firms that serve the industry, the pipe, drilling equipment, and other manufactured goods that it requires, and the large payrolls and their effects on consumer spending, you will begin to get a picture of the enormity of the industry.

And these are good paying jobs.  They aren’t eight dollar part-time jobs down at your local big box retailer.  These are jobs that comfortably support middle class families.  These are precisely the kinds of jobs that we cannot afford to lose.

In recent years, there has been a noticeable economic difference between areas of the country where energy is being produced and where energy is not being produced.

Since December 2007, a total of 1.36 million jobs have been gained in shale oil states.

Meanwhile, a total of 424,000 jobs have been lost in non-shale oil states.

So what happens now that the shale oil boom is turning into a bust?

That is a very good question.

Even more ominous is what an oil price collapse could mean for our financial system.

The last time the price of oil declined by more than 40 dollars in less than six months, there was a financial meltdown on Wall Street and we experienced the deepest recession that we have seen since the days of the Great Depression.

And now many fear that this collapse in the price of oil could trigger another financial panic.

According to Citigroup, the energy sector now accounts for 17 percent of the high yield bond market.

J.P. Morgan says that it is actually 18 percent.

In any event, the reality of the matter is that the health of these “junk bonds” is absolutely critical to our financial system.  And according to Deutsche Bank, if these bonds start defaulting it could “trigger a broader high-yield market default cycle”

Based on recent stress tests of subprime borrowers in the energy sector in the US produced by Deutsche Bank, should the price of US crude fall by a further 20pc to $60 per barrel, it could result in up to a 30pc default rate among B and CCC rated high-yield US borrowers in the industry. West Texas Intermediate crude is currently trading at multi-year lows of around $75 per barrel, down from $107 per barrel in June.

A shock of that magnitude could be sufficient to trigger a broader high-yield market default cycle, if materialized,” warn Deutsche strategists Oleg Melentyev and Daniel Sorid in their report.

If the price of oil stays at this level or continues to go down, it is inevitable that we will start to see some of these junk bonds go bad.

In fact, one Motley Fool article recently stated that one industry analyst believes that up to 40 percent of all energy junk bonds could eventually go into default…

The junk bonds, or noninvestment-rated bonds, of energy companies are also beginning to see heavy selling as investors start to worry that drillers could one day default on these bonds. Those defaults could get so bad, according to one analyst, that up to 40% of all energy junk bonds go into default over the next few years if oil prices don’t recover.

That would be a total nightmare for Wall Street.

And of course bond defaults would only be part of the equation.  As I wrote about the other day, a crash in junk bonds is almost always followed by a significant stock market correction.

In addition, plunging oil prices could end up absolutely destroying the banks that are holding enormous amounts of energy derivatives.  This is something that I recently covered in this article and this article.

As you read this, there are five “too big to fail” banks that each have more than 40 trillion dollars in exposure to derivatives.  Of course only a small fraction of that total exposure is made up of energy derivatives, but a small fraction of 40 trillion dollars is still a massive amount of money.

These derivatives trades are largely unregulated, and even Forbes admits that they are likely to be at the heart of the coming financial collapse…

No one understands the derivative risk positions of the Too Big To Fail Banks, JP Morgan Chase, Citigroup, Bank of America, Goldman Sachs or Morgan Stanley. There is presently no way to measure the risks involved in the leverage, quantity of collateral, or stability of counter-parties for these major institutions. To me personally they are big black holes capable of potential wrack and ruin. Without access to confidential internal data about these risky derivative positions the regulators cannot react in a timely and measured fashion to block the threat to financial stability, according to a National Bureau of Economic Research study.

So do we have any hope?

Yes, if oil prices start going back up, much of what you just read about can be averted.

Unfortunately, that does not seem likely any time soon.  Even though U.S. energy companies are cutting back on capital expenditures, most of them are still actually projecting an increase in production for 2015.  Here is one example from Bloomberg

Continental, the biggest holder of drilling rights in the Bakken, last month said 2015 output will grow between 23 percent and 29 percent even after shelving plans to allocate more money to exploration.

Higher levels of production will just drive the price of oil even lower.

At this point, Morgan Stanley is saying that the price of oil could plummet as low as $43 a barrel next year.

If that happens, it would be absolutely catastrophic to the most important industry in the United States.

In turn, that would be absolutely catastrophic for the economy as a whole.

So don’t let anyone tell you that much lower oil prices are “good” for the economy.

That is just a bunch of nonsense.

Nowhere To Hide As Minority Report-Style Facial Recognition Technology Spreads Across America

Eye Black And White - Public DomainWhat is our society going to look like when our faces are being tracked literally everywhere that we go?  As part of the FBI’s new Next Generation Identification System, a facial recognition database known as the Interstate Photo System will have collected 52 million of our faces by the end of 2015.  But that is only a small part of the story.  According to Edward Snowden, the NSA has been using advanced facial recognition technology for years.  In addition, as you will see below, advertising companies are starting to use Minority Report-style face scanners in their billboards and many large corporations see facial recognition technology as a tool that they can use to serve their customers better.  Someday soon it may become virtually impossible to go out in public in a major U.S. city without having your face recorded.  Is that the kind of society that we want?

To the FBI, this technology does not represent an invasion of privacy.  Rather, they are very proud of the fact that they are not going to be so dependent on fingerprinting any longer.  The FBI has been developing the Next Generation Identification System for years, and this month it was announced that it is finally fully operational

The federal government’s Next Generation Identification System — a biometric database that relies largely on facial-recognition technology — is now fully operational, the FBI announced Monday.

“This effort is a significant step forward for the criminal justice community in utilizing biometrics as an investigative enabler,” the FBI said in a statement.

The latest advance in the technology gives users the ability to receive “ongoing status notifications” about individuals’ criminal histories, the FBI said. That means if, for instance, a teacher commits an offense, law enforcement can be immediately informed — and then pass that information on to administrators.

It’s to monitor criminal histories of those “in positions of trust,” the FBI said.

As part of this new system, every American will eventually be assigned a “Universal Control Number”.

Does that sound creepy to you?

Even mainstream news reports are admitting that it sounds like something out of a science fiction movie

It aims to eventually replace fingerprinting with a complex array of biometrics, assigning everyone with a “Universal Control Number”, in what sounds like a plotline from a sci-fi movie.

And it won’t just be the FBI using this database.

According to Fox News, more than 18,000 law enforcement agencies will have access to this information…

More than 18,000 law enforcement agencies and other authorized criminal justice partners across the country will have access to the system 24 hours a day, 365 days a year.

So if your face is scanned somewhere or you do something noteworthy that is registered by the system, virtually every law enforcement agency in the country will instantly know about it.

Pretty scary stuff, eh?

But the FBI is actually lagging far behind the NSA.

According to Edward Snowden, the NSA has been using “sophisticated facial recognition programs” for many years

The National Security Agency is harvesting huge numbers of images of people from communications that it intercepts through its global surveillance operations for use in sophisticated facial recognition programs, according to top-secret documents.

The spy agency’s reliance on facial recognition technology has grown significantly over the last four years as the agency has turned to new software to exploit the flood of images included in emails, text messages, social media, videoconferences and other communications, the N.S.A. documents reveal. Agency officials believe that technological advances could revolutionize the way that the N.S.A. finds intelligence targets around the world, the documents show.

Do you remember that stuff you saw in the Jason Bourne movies about how the NSA can track people?

Well, most of that stuff is real.

If you don’t like it, that is just too bad.  At this point not even Congress has much control over what the NSA does.

And there are police departments around the nation that are also way ahead of the FBI.

For example, just check out what has been going on in southern California

In a single second, law enforcement agents can match a suspect against millions upon millions of profiles in vast detailed databases stored on the cloud. It’s all done using facial recognition, and in Southern California it’s already occurring.

Imagine the police taking a picture: any picture of a person, anywhere, and matching it on the spot in less than a second to a personalized profile, scanning millions upon millions of entries from within vast, intricate databases stored on the cloud.

It’s done with state of the art facial recognition technology, and in Southern California it’s already happening.

At least one law enforcement agency in San Diego is currently using software developed by FaceFirst, a division of nearby Camarillo, California’s Airborne Biometrics Group. It can positively identify anyone, as long as physical data about a person’s facial features is stored somewhere the police can access. Though that pool of potential matches could include millions, the company says that by using the “best available facial recognition algorithms” they can scour that data set in a fraction of a second in order to send authorities all known intelligence about anyone who enters a camera’s field of vision.

Widespread use of facial recognition technology by our law enforcement authorities is becoming a way of life.

If the American people don’t like this, they need to stand up and say something.

But instead, in an era of widespread Internet hacking and identity theft, many Americans are actually clamoring for the implementation of more biometric identification.

For instance, the following is a brief excerpt from a Fox News article entitled “Biometric security can’t come soon enough for some people“…

In a world where nearly every ATM now uses an operating system without any technical support, where a bug can force every user of the Internet to change the password to every account they’ve ever owned overnight, where cyber-attacks and identity theft grow more menacing every day, the ability to use your voice, your finger, your face or some combination of the three to log into your e-mail, your social media feed or your checking account allows you to ensure it’s very difficult for someone else to pretend they’re you.

As financial institutions adopt this kind of technology, a day may come when virtually all of us are required to have our faces scanned at the checkout counter.

That may sound crazy to you, but according to the Daily Mail a company in Finland has already launched this technology…

Bank cards are already being replaced by phones and wristbands that have payment technology built-in but the latest threat to the lowly plastic in your pocket could be your face.

A Finnish startup called Uniqul has launched what it calls the first ever payment platform based on facial recognition.

The system doesn’t require a wallet, bank card or phone – instead a camera is positioned at the checkout and takes a photo of a shopper’s face when they are ready to pay.

It then scans a database for the face and matches it to stored payment details in order to complete the transaction.

And advertisers are even more eager to adopt facial recognition technology.  In fact, the kind of face scanning billboards that we saw in “Minority Report” are already a reality.  For example, a company called Amscreen says that it already has more than 6,000 face scanning digital screens that are being viewed by approximately 50 million people each week…

Advertising network Amscreen recently launched a unique face-detection technology, originally developed by automated audience measurement firm Quividi.

Cameras have been installed in Amscreen’s digital advertising displays that can scan a person’s face and determine their gender, age, date, time and volume of the viewers.

This is so adverts are served to the most appropriate audience.

Amscreen already has over 6,000 digital screens seen by a weekly audience of over 50 million people.

Even dating websites are starting to use facial recognition technology at this point.

Just check out what Match.com has been doing…

Popular dating site Match.com will use photos of users’ exes to determine which type of look they’re attracted to in order to find them a dating match.

The dating site has partnered with Three Day Rule, a Los Angeles-based matchmaking service, which has dating experts that act as personal dating concierges who hand-select and personally meet every potential match before making a formal introduction to clients, Mashable reports.

Members of Match.com will be able to upgrade to Three Day Rule’s premium service which will ask users to send pictures of exes to determine the type of look they’re attracted to. Three Day Rule will then use facial-recognition technology in an effort to help users find dates.

Our world is changing at a faster pace than ever before.

Powerful new technologies are literally being introduced every single day now, and the future is probably going to look far different than any of us are imagining.

But with all of this new technology, will we end up losing what little personal privacy that we have left?

Please feel free to share what you think by posting a comment below…