The Oil Crash Of 2016 Has The Big Banks Running Scared

Running Scared - Public Domain
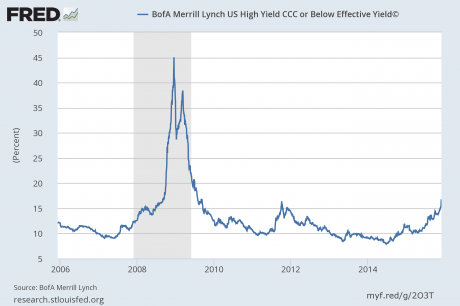
Last time around it was subprime mortgages, but this time it is oil that is playing a starring role in a global financial crisis.  Since the start of 2015, 42 North American oil companies have filed for bankruptcy, 130,000 good paying energy jobs have been lost in the United States, and at this point 50 percent of all energy junk bonds are “distressed” according to Standard & Poor’s.  As you will see below, some of the big banks have a tremendous amount of loan exposure to the energy industry, and now they are bracing for big losses.  And the longer the price of oil stays this low, the worse the carnage is going to get.

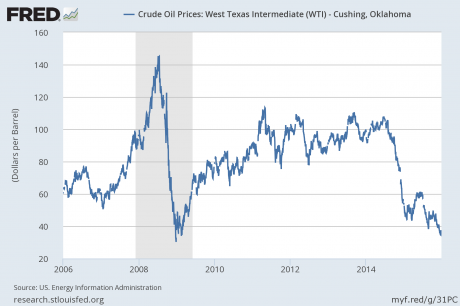
Today, the price of oil has been hovering around 29 dollars a barrel, and over the past 18 months the price of oil has fallen by more than 70 percent.  This is something that has many U.S. consumers very excited.  The average price of a gallon of gasoline nationally is just $1.89 at the moment, and on Monday it was selling for as low as 46 cents a gallon at one station in Michigan.

But this oil crash is nothing to cheer about as far as the big banks are concerned.  During the boom years, those banks gave out billions upon billions of dollars in loans to fund exceedingly expensive drilling projects all over the world.

Now those firms are dropping like flies, and the big banks could potentially be facing absolutely catastrophic losses.  The following examples come from CNN

For instance, Wells Fargo (WFC) is sitting on more than $17 billion in loans to the oil and gas sector. The bank is setting aside $1.2 billion in reserves to cover losses because of the “continued deterioration within the energy sector.”

JPMorgan Chase (JPM) is setting aside an extra $124 million to cover potential losses in its oil and gas loans. It warned that figure could rise to $750 million if oil prices unexpectedly stay at their current $30 level for the next 18 months.

Citigroup is another bank that also has a tremendous amount of exposure

Citigroup (C) built up loan loss reserves in the energy space by $300 million. The bank said the move reflects its view that “oil prices are likely to remain low for a longer period of time.”

If oil stays around $30 a barrel, Citi is bracing for about $600 million of energy credit losses in the first half of 2016. Citi said that figure could double to $1.2 billion if oil dropped to $25 a barrel and stayed there.

For the moment, these big banks are telling the public that the damage can be contained.

But didn’t they tell us the same thing about subprime mortgages in 2008?

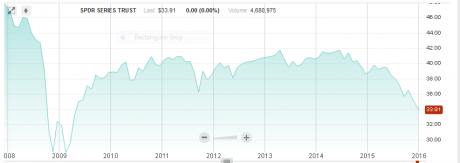
We are already seeing bank stocks start to slide precipitously.  People are beginning to realize that these banks are dangerously exposed to a lot of really bad deals.

If the price of oil were to shoot back up above 50 dollars in very short order, the damage would probably be manageable.  Unfortunately, that does not appear likely to happen.  In fact, now that sanctions have been lifted on Iran, the Iranians are planning to flood the world with massive amounts of oil that they have been storing in tankers at sea

Iran has been carefully planning for its return from the economic penalty box by hoarding tons of oil in tankers at sea.

Now that the U.S. and European Union have lifted some sanctions on Iran, the OPEC country can begin selling its massive stockpile of oil.

The sale of this seaborne oil will allow Iran to get an immediate financial boost before it ramps up production. The onslaught of Iranian oil is coming at a terrible time for the global oil markets, which are already drowning in an epic supply glut.

Just the other day, I explained that some of the biggest banks in the world are now projecting that the price of oil could soon fall much, much lower.

Morgan Stanley says that it could go as low as 20 dollars a barrel, the Royal Bank of Scotland says that it could go as low as 16 dollars a barrel, and Standard Chartered says that it could go as low as 10 dollars a barrel.

But the truth is that the price of oil does not need to go down one penny more to have a catastrophic impact on global financial markets.  If it just stays right here, we will see an endless parade of layoffs, energy company bankruptcies  and debt defaults.  Without any change, junk bonds will continue to crash and financial institutions will continue to go down like dominoes.

We are already experiencing a major disaster.  Things are already so bad that some forms of low quality crude oil are literally selling for next to nothing.  The following comes from Bloomberg

Oil is so plentiful and cheap in the U.S. that at least one buyer says it would pay almost nothing to take a certain type of low-quality crude.

Flint Hills Resources LLC, the refining arm of billionaire brothers Charles and David Koch’s industrial empire, said it offered to pay $1.50 a barrel Friday for North Dakota Sour, a high-sulfur grade of crude, according to a corrected list of prices posted on its website Monday. It had previously posted a price of -$0.50. The crude is down from $13.50 a barrel a year ago and $47.60 in January 2014.

While the near-zero price is due to the lack of pipeline capacity for a particular variety of ultra low quality crude, it underscores how dire things are in the U.S. oil patch.

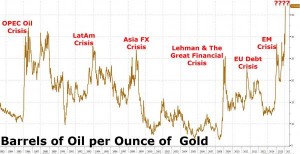
A chart that I saw posted on Zero Hedge earlier today can help put all of this into perspective.  Whenever the price of oil falls really low relative to the price of gold, there is a major global crisis.  Right now an ounce of gold will purchase more oil than ever before, and many believe that this indicates that a new great crisis is upon us…

The number of barrels of oil that a single ounce of gold can buy has never, ever been higher.

Barrels Of Oil Per Ounce Of Gold

All over the planet, big banks are absolutely teeming with bad loans.  And to be honest, the big banks in the U.S. are probably in better shape than some of the major banks in Europe and Asia.  But once the dominoes start to fall, very few financial institutions are going to escape unscathed.

In the coming days I would expect to see more headlines like we just got out of Italy.  Apparently, Italian banks are nearing full meltdown mode, and short selling has been temporarily banned.  To me, it appears that we are just inches away from full-blown financial panic in Europe.

However, just like with the last financial crisis, you never quite know where the next “explosion” is going to happen next.

But one thing is for sure – the financial crisis that began during the second half of 2015 is raging out of control, and the pain that we have seen so far is just the beginning.

20th Largest Bank In The World: 2016 Will Be A ‘Cataclysmic Year’ And ‘Investors Should Be Afraid’

Royal Bank Of ScotlandThe Royal Bank of Scotland is telling clients that 2016 is going to be a “cataclysmic year” and that they should “sell everything”.  This sounds like something that you might hear from The Economic Collapse Blog, but up until just recently you would have never expected to get this kind of message from one of the twenty largest banks on the entire planet.  Unfortunately, this is just another indication that a major global financial crisis has begun and that we are now entering a bear market.  The collective market value of companies listed on the S&P 500 has dropped by about a trillion dollars since the start of 2016, and panic is spreading like wildfire all over the globe.  And of course when the Royal Bank of Scotland comes out and openly says that “investors should be afraid” that certainly is not going to help matters.

It amazes me that the Royal Bank of Scotland is essentially saying the exact same thing that I have been saying for months.  Just like I have been telling my readers, RBS has observed that global markets “are flashing the same stress alerts as they did before the Lehman crisis in 2008″

RBS has advised clients to brace for a “cataclysmic year” and a global deflationary crisis, warning that the major stock markets could fall by a fifth and oil may reach US$16 a barrel.

The bank’s credit team said markets are flashing the same stress alerts as they did before the Lehman crisis in 2008.

So what should our response be to these warning signs?

According to RBS, the logical thing to do is to “sell everything” excerpt for high quality bonds…

“Sell everything except high quality bonds,” warned Andrew Roberts in a note this week.

He said the bank’s red flags for 2016 — falling oil, volatility in China, shrinking world trade, rising debt, weak corporate loans and deflation — had all been seen in just the first week of trading.

We think investors should be afraid,” he said.

And of course RBS is not the only big bank issuing these kinds of ominous warnings.

The biggest bank in America, J.P. Morgan Chase, is “urging investors to sell stocks on any bounce”

J.P. Morgan Chase has turned its back on the stock market: For the first time in seven years, the investment bank is urging investors to sell stocks on any bounce.

“Our view is that the risk-reward for equities has worsened materially. In contrast to the past seven years, when we advocated using the dips as buying opportunities, we believe the regime has transitioned to one of selling any rally,” Mislav Matejka, an equity strategist at J.P. Morgan, said in a report.

Aside from technical indicators, expectations of anemic corporate earnings combined with the downward trajectory in U.S. manufacturing activity and a continued weakness in commodities are raising red flags.

Major banks have not talked like this since the great financial crisis of 2008/2009.  Clearly something really big is going on.  Trillions of dollars of financial wealth were wiped out around the world during the last six months of 2015, and trillions more dollars have been wiped out during the first 12 days of 2016.  As I noted above, the collective market value of the S&P 500 is down by about a trillion dollars all by itself.

One of the big things driving all of this panic is the stunning collapse in the price of oil.  U.S. oil was trading as low as $29.93 a barrel on Tuesday, and this was the first time that oil has traded under 30 dollars a barrel since December 2003.

Needless to say, this collapse is absolutely killing energy companies.  The following comes from USA Today

There aren’t many people who feel bad for oil companies. But the implosion in oil prices is causing a profit decline that almost invokes pity.

The companies in the Standard & Poor’s 500 energy sector are expected to lose a collective $28.8 billion this calendar year, down from $95.4 billion in net income earned during the industry’s bonanza year of 2008, according to a USA TODAY analysis of data from S&P Capital IQ. That’s a $124 billion swing against energy companies – and one you’re probably enjoying at the pump. The analysis includes only the 36 S&P 500 energy companies that reported net income in 2008.

If we are to avoid a major global deflationary crisis, we desperately need the price of oil to get back above 50 dollars a barrel.  Unfortunately, that does not appear to be likely to happen any time soon.  In fact, Dallas Fed President Robert Kaplan says that the price of oil is probably going to stay very low for years to come

You’d expect at least some artificial optimism when the president of the Dallas Fed talks about oil. You’d expect some droplets of hope for that crucial industry in Texas. But when Dallas Fed President Robert Kaplan spoke on Monday, there was none, not for 2016, and most likely not for 2017 either, and maybe not even for 2018.

The wide-ranging speech included a blunt section on oil, the dismal future of the price of oil, the global and US causes for its continued collapse, and what it might mean for the Texas oil industry: “more bankruptcies, mergers and restructurings….”

The oil price plunge since mid-2014, with its vicious ups and downs, was bad enough. But since the OPEC meeting in December, he said, “the overall tone in the oil and gas sector has soured, as expectations have decidedly shifted to an ‘even lower for even longer’ price outlook.”

In recent articles I have discussed so many of the other signs that indicate that there is big trouble ahead, but today I just want to quickly mention another one that has just popped up in the news.

The amount of stuff being shipped across the U.S. by rail has been dropping dramatically.  The only times when we have seen similar large drops has been during previous recessions.  The following comes from Bloomberg

Railroad cargo in the U.S. dropped the most in six years in 2015, and things aren’t looking good for the new year.

“We believe rail data may be signaling a warning for the broader economy,” the recent note from Bank of America says. “Carloads have declined more than 5 percent in each of the past 11 weeks on a year-over-year basis. While one-off volume declines occur occasionally, they are generally followed by a recovery shortly thereafter. The current period of substantial and sustained weakness, including last week’s -10.1 percent decline, has not occurred since 2009.”

BofA analysts led by Ken Hoexter look at the past 30 years to see what this type of steep decline usually means for the U.S. economy. What they found wasn’t particularly encouraging: All such drops in rail carloads preceded, or were accompanied by, an economic slowdown (Note: They excluded 1996 due to an extremely harsh winter).

The “next economic downturn” is already here, and it is starting to accelerate.

Yes, the financial markets are starting to catch up with economic reality, but they still have a long, long way to go.  It is going to take another 30 percent drop or so just for them to get to levels that are considered to be “normal” or “average” by historical standards.

And the markets are so fragile at this point that any sort of a major “trigger event” could cause a sudden market implosion unlike anything that we have ever seen before.

So let us hope for the best, but let us also heed the advice of RBS and get prepared for a “cataclysmic” year.

Stock Markets All Over The World Crash As We Begin 2016

Dominoes - Public DomainThe first trading day of 2016 was full of chaos and panic.  It started in Asia where the Nikkei was down 582 points, Hong Kong was down 587 points, and Chinese markets experienced an emergency shutdown after the CSI 300 tumbled 7 percent.  When European markets opened, the nightmare continued.  The DAX was down 459 points, and European stocks overall had their worst start to a year ever.  In the U.S., it looked like we were on course for a truly historic day as well.  The Dow Jones Industrial Average was down 467 points at one stage, but some very mysterious late day buying activity helped trim the loss to just 276 points at the close of the market.  The sudden market turmoil caught many by surprise, but it shouldn’t have.  The truth is that a whole host of leading indicators have been telling us that this is exactly what should be happening.  The global financial crisis that began in 2015 is now accelerating, and my regular readers already know precisely what is coming next.

The financial turmoil of the last 24 hours is making headlines all over the globe.  It began last night in China.  Very bad manufacturing data and another troubling devaluation of the yuan sent Chinese stocks tumbling to a degree that we have not seen since last August.  In fact, the carnage would have probably been far, far worse if not for a new “circuit breaker” that China recently implemented.  Once the CSI 300 was down 7 percent, trading was completely shut down for the rest of the day.  The following comes from USA Today

Under a new market “circuit breaker” rule in China established last year, which is designed to slow down markets and halt panic in the event of moves of 5% or more, the CSI 300, a large-company stock index in mainland China was halted for 15 minutes in mid-afternoon trading after diving more than 5%. But when shares headed lower once again just minutes after the initial trading halt, and losses for the day swelled to more than 7%, the new circuit breaker rules kicked in, prompting a shutdown of mainland China’s stock market for the day, according to Bloomberg.

After the first 15 minute halt, panic set in as Chinese traders rushed to get out of their trades before the 7 percent circuit breaker kicked in.  This resulted in an absolutely chaotic seven minutes as investors made a mad dash for the exits…

The sell orders piled up fast on Monday at Shenwan Hongyuan Group, China’s fifth-biggest brokerage by market value.

China’s CSI 300 Index had just tumbled 5 percent, triggering a 15-minute trading halt, and stock investors were scrambling to exit before getting locked in by a full-day suspension set to take effect at 7 percent. When the first halt was lifted, the market reaction was swift: it took just seven minutes for losses to reach the limit as volumes surged to their highs of the day.

“Investors rushed to the door during the level-one stage of the circuit breaker as they fretted the market would go down further,” said William Wong, the head of sales trading at Shenwan Hongyuan in Hong Kong.

The financial carnage continued once the European markets opened.  Markets were red all across the continent, and things were particularly bad in Germany.  The DAX was down 459 points, and it is rapidly approaching the psychologically-important 10,000 barrier.  Overall, it was the worst start to a year that the European markets have ever experienced.

When U.S. markets opened, unexpectedly bad U.S. manufacturing data seemed to add fuel to the fire.  Monday morning we learned that our manufacturing sector is contracting at a pace that we haven’t seen since the last recession

America’s manufacturing sector shrank for the second straight month in December. The industry’s key index — ISM — hit 48.2% in December, the lowest mark since June 2009. Anything below 50% is a contraction and a month ago it hit 48.6%.

The index has fallen for six straight months.

The trend is certainly heading in a direction that would ring alarm bells,” says Sam Bullard, senior economist at Wells Fargo.

This is yet another sign that tells us that the U.S. economy has already entered the next recession.

And what happens to the markets during a recession?

They go down.

In addition to the bad data that we got from the U.S. and China, there was another number that was also extremely troubling.

South Korean exports have traditionally been considered a key leading indicator for the entire global economy, and on Monday we learned that they were down a whopping 13.8 percent in December from a year earlier…

One of the more reliable indicators of the global economy continues to confirm fears of a worldwide slowdown.

South Korean exports — also referred to as the world’s economic canary in the coal mine — fell 13.8% in December from a year earlier.

This was a deterioration from the 4.8% decline in November, and it was much worse than the 11.7% decline expected by economists.

The “nothing is happening” crowd may not be willing to admit it yet, but the truth is that a major global economic slowdown is already happening.

And what happened to global markets today is perfectly consistent with the longer term patterns that have been emerging over the past six months or so.

In the weeks and months to come, things are going to get even worse.  There will always be days when the markets are up, but don’t let those days fool you into thinking that the crisis is over.  In the western world we are so accustomed to 48 hour news cycles, and many of us seem to be incapable of focusing on trends that develop over longer periods of time.

If I was going to put together a scenario for a global financial crisis for a textbook, what we have seen over the past six months or so would be perfect.  Things are playing out exactly how they should be, and that means big trouble for the rest of 2016.

But that doesn’t mean that we have to live in fear.  In fact, I just wrote an entire article entitled “2016: A Year For Living With No Fear“.  It is when times are at their worst that our character is put to the test.  Some will respond to what happens in 2016 with courage and strength, and others will respond with fear and panic.

As things start falling apart all around us this year, how will you respond?

What Really Happened In 2015, And What Is Coming In 2016…

2015 2016 - Public DomainA lot of people were expecting some really big things to happen in 2015, and most of them did not happen.  But what did happen?  It is my contention that a global financial crisis began during the second half of 2015, and it threatens to greatly accelerate as we enter 2016.  During the last six months of the year that just ended, financial markets all over the planet crashed, trillions of dollars of global wealth was wiped out, and some of the largest economies in the world plunged into recession.  Here in the United States, 2015 was the worst year for stocks since 2008, nearly 70 percent of all investors lost money last year, and it is being projected that the final numbers will show that close to 1,000 hedge funds permanently shut down within the last 12 months.  This is what the early stages of a financial crisis look like, and the worst is yet to come.

If we were entering another 2008-style crisis, we would expect to see junk bonds crashing.  When financial trouble starts, it usually doesn’t start with the biggest and strongest companies.  Instead, it usually starts percolating on the periphery.  And right now bonds of firms that are considered to be on the risky side of things are rapidly losing value.

In the chart below, you can see that a high yield bond ETF that I track very closely known as JNK started crashing in the middle of 2008.  This crash began to unfold before the horrific crash of stocks in the fall.  Investors that saw junk bonds crashing in advance and pulled their money out of stocks in time saved an enormous amount of money.

Now, for the very first time since the last financial crisis, we are seeing junk bonds crash again.  In December, there was finally a sustained crash through the psychologically-important 35.00 level, and at this point JNK is sitting a bit below 34.00.  This stunning decline is a giant red flag that tells us that stocks will soon follow in the exact same direction…

JNK

In 2015, Third Avenue Management shocked Wall Street when they froze withdrawals from a 788 million dollar mutual fund that was highly focused on junk bonds.  Investors that couldn’t get their money out began to panic, and other mutual funds now find themselves under siege.  If junk bonds continue to crash, this will just be the beginning of the carnage.

One of the big reasons why junk bonds are crashing is because of the crash in the price of oil.  Over the past 18 months, the price of oil has plummeted from $108 a barrel to $37 a barrel.

There has only been one other time in all of history when we have ever seen an oil price crash of this magnitude. That was in 2008 – just before the greatest financial crisis since the Great Depression…

Oil - Federal Reserve

Why can’t people see the parallels?

Crashes are happening all around us, and yet so many of the “experts” seem completely blind to what is going on.

Unlike 2008, the price of oil is not expected to rapidly rebound any time soon.  The following comes from CNN

Crude prices dropped a whopping 35% last year and are hovering around $37 a barrel. That’s a level not seen since the global financial crisis.

It won’t get better any time soon. Most oil experts believe prices will bounce back in late 2016, but they expect more pain first.

Goldman Sachs forecasts that oil will average about $38 a barrel in February, even lower than for most of 2015.

Meanwhile, the prices of industrial commodities have been crashing as well.  For example, the chart below shows that the price of copper started crashing hard just before the great financial crisis of 2008, and the exact same thing is happening once again right before our very eyes…

Price Of Copper

Things are unfolding just as we would expect they would during the initial stages of a new global financial crisis.

And we have already seen a full blown stock market crash in many of the largest economies around the planet.  For instance, just look at what has been happening in Brazil.  The Brazilians have the 7th largest economy in the world, and Goldman Sachs says that they have plunged into an “outright depression“.  In the chart below, you can see the sharp downturn that took place in August, and Brazilian stocks actually kept falling all the way through the end of 2015…

Brazil Stock Market

We see a similar thing when we look at our neighbor to the north.  Canada has the 11th largest economy on the entire planet, and I recently wrote a lengthy article about the economic difficulties that the Canadians are now facing.  2015 was a very bad year for Canadian stocks as well, and they just kept falling steadily all the way through December…

Canada Stock Market

Of course nobody can forget what happened to China.  The Chinese have the second largest economy on the globe, and news about their economic slowdown in making headlines almost every single day now.

Last summer, Chinese stocks crashed about 40 percent, and they did manage to bounce back just a bit since then. But they are still down about 30 percent from the peak of the market…

China Stock Market

And there is plenty more that we could talk about.  European stocks just had their second worst December ever, and Japanese stocks are down about 500 points in early trading as I write this article.

Here in the United States, the Dow Jones Industrial Average, Dow Transports, the S&P 500 and the Russell 2000 all had their worst years since 2008.  As I mentioned the other day674 hedge funds shut down during the first nine months of 2015, and it is being projected that the final total for the year will be up around 1000.

But we aren’t hearing much about this financial carnage on the news yet, are we?

Many people that I talk to still think that “nothing is happening”, but don’t you dare say that to Warren Buffett.

He lost 7.8 billion dollars in 2015.

How would you feel if you lost 7.8 billion dollars in a single year?

The truth, of course, is that signs of financial chaos are erupting all around us.  Corporate profits are plunging, the bond distress ratio just hit the highest level that we have seen since the last financial crisis, and corporate debt defaults have risen to the highest level that we have seen in about seven years.

If you run a business, you may have noticed that fewer people are coming in and it seems like those that do come in have less money to spend.  Economic activity is slowing down, and inventories are piling up.  In fact, wholesale inventories have now risen to the highest level that we have seen since the last recession…

Inventory To Sales Ratio - Federal Reserve

Do you notice a theme?

So many things that have not happened in six or seven years are now happening again.

History may not repeat, but it sure does rhyme, and it astounds me that more people cannot see that 2015/2016 is looking eerily similar to a replay of 2008/2009.

Another number that I watch closely is the velocity of money.  When an economy is running well, money tends to circulate efficiently through the system.  But when an economy gets into trouble, people get scared and start holding on to their money.  As you can see from the chart below, the velocity of money declined during every single recession since 1960.  This is precisely what one would expect.  And of course during the recession that started in 2008, the velocity of money plunged precipitously.  But then a funny thing happened when that recession supposedly “ended”.  The velocity of money just kept going down, and now it has fallen to an all-time record low…

Velocity Of Money M2

A big reason for this is the ongoing decline of the middle class.  In 2015, we learned that middle class Americans now make up a minority of the population for the first time ever.

But if you go back to 1971, 61 percent of all Americans lived in middle class households.

Meanwhile, the share of the income pie that the middle class takes home has also continued to shrink.

In 1970, the middle class brought home approximately 62 percent of all income. Today, that number has fallen to just 43 percent.

As the middle class is systematically destroyed, the number of Americans living in poverty just continues to grow. And those that often suffer the most are the children.  It may be hard for you to believe, but the number of homeless children in the U.S. has increased by 60 percent over the past six years.

60 percent!

How in the world can anyone dare to claim that “things are getting better”?

Anyone that says that should be ashamed of themselves.

We are in the midst of a long-term economic collapse that is now accelerating once again.

Anyone that tries to tell you that “things are getting better” and that 2016 is going to be a better year than 2015 is simply not being honest with you.

A new global financial crisis erupted during the last six months of 2015, and this new financial crisis is going to intensify throughout the early months of 2016.  Financial institutions will begin falling like dominoes, and this will result in a great credit crunch around the world.  Businesses will fail, unemployment will skyrocket and millions will suddenly be faced with economic despair.

By the time it is all said and done, this new financial crisis will be even worse than what we experienced back in 2008, and the suffering that we will see around the world will be off the charts.

So does that mean that I am down about this year?

Not at all.  In fact, my wife and I are greatly looking forward to 2016.  In the midst of all the chaos and darkness, there will be great opportunities to do good and to make a difference.

What a great shaking comes, people go looking for answers.  And I think that this will be a year when millions of people start to understand that our politicians and the mainstream media are not telling them the truth.

Yes, great challenges are coming.  But now is not a time to dig a hole and try to hide from the world.  Instead, this will be a time for those that have prepared in advance to love others, help others and show them the truth.

What about you?

Are you ready to be a light during the dark times that are coming?

Please feel free to join the conversation by posting a comment below…

58 Facts About The U.S. Economy From 2015 That Are Almost Too Crazy To Believe

58The world didn’t completely fall apart in 2015, but it is undeniable that an immense amount of damage was done to the U.S. economy.  This year the middle class continued to deteriorate, more Americans than ever found themselves living in poverty, and the debt bubble that we are living in expanded to absolutely ridiculous proportions.  Toward the end of the year, a new global financial crisis erupted, and it threatens to completely spiral out of control as we enter 2016.  Over the past six months, I have been repeatedly stressing to my readers that so many of the exact same patterns that immediately preceded the financial crisis of 2008 are happening once again, and trillions of dollars of stock market wealth has already been wiped out globally.  Some of the largest economies on the entire planet such as Brazil and Canada have already plunged into deep recessions, and just about every leading indicator that you can think of is screaming that the U.S. is heading into one.  So don’t be fooled by all the happy talk coming from Barack Obama and the mainstream media.  When you look at the cold, hard numbers, they tell a completely different story.  The following are 58 facts about the U.S. economy from 2015 that are almost too crazy to believe…

#1 These days, most Americans are living paycheck to paycheck.  At this point 62 percent of all Americans have less than 1,000 dollars in their savings accounts, and 21 percent of all Americans do not have a savings account at all.

#2 The lack of saving is especially dramatic when you look at Americans under the age of 55.  Incredibly, fewer than 10 percent of all Millennials and only about 16 percent of those that belong to Generation X have 10,000 dollars or more saved up.

#3 It has been estimated that 43 percent of all American households spend more money than they make each month.

#4 For the first time ever, middle class Americans now make up a minority of the population. But back in 1971, 61 percent of all Americans lived in middle class households.

#5 According to the Pew Research Center, the median income of middle class households declined by 4 percent from 2000 to 2014.

#6 The Pew Research Center has also found that median wealth for middle class households dropped by an astounding 28 percent between 2001 and 2013.

#7 In 1970, the middle class took home approximately 62 percent of all income. Today, that number has plummeted to just 43 percent.

#8 There are still 900,000 fewer middle class jobs in America than there were when the last recession began, but our population has gotten significantly larger since that time.

#9 According to the Social Security Administration, 51 percent of all American workers make less than $30,000 a year.

#10 For the poorest 20 percent of all Americans, median household wealth declined from negative 905 dollars in 2000 to negative 6,029 dollars in 2011.

#11 A recent nationwide survey discovered that 48 percent of all U.S. adults under the age of 30 believe that “the American Dream is dead”.

#12 Since hitting a peak of 69.2 percent in 2004, the rate of homeownership in the United States has been steadily declining every single year.

#13 At this point, the U.S. only ranks 19th in the world when it comes to median wealth per adult.

#14 Traditionally, entrepreneurship has been one of the primary engines that has fueled the growth of the middle class in the United States, but today the level of entrepreneurship in this country is sitting at an all-time low.

#15 For each of the past six years, more businesses have closed in the United States than have opened.  Prior to 2008, this had never happened before in all of U.S. history.

#16 If you can believe it, the 20 wealthiest people in this country now have more money than the poorest 152 million Americans combined.

#17 The top 0.1 percent of all American families have about as much wealth as the bottom 90 percent of all American families combined.

#18 If you have no debt and you also have ten dollars in your pocket, that gives you a greater net worth than about 25 percent of all Americans.

#19 The number of Americans that are living in concentrated areas of high poverty has doubled since the year 2000.

#20 An astounding 48.8 percent of all 25-year-old Americans still live at home with their parents.

#21 According to the U.S. Census Bureau, 49 percent of all Americans now live in a home that receives money from the government each month, and nearly 47 million Americans are living in poverty right now.

#22 In 2007, about one out of every eight children in America was on food stamps. Today, that number is one out of every five.

#23 According to Kathryn J. Edin and H. Luke Shaefer, the authors of a new book entitled “$2.00 a Day: Living on Almost Nothing in America“, there are 1.5 million “ultrapoor” households in the United States that live on less than two dollars a day. That number has doubled since 1996.

#24 46 million Americans use food banks each year, and lines start forming at some U.S. food banks as early as 6:30 in the morning because people want to get something before the food supplies run out.

#25 The number of homeless children in the U.S. has increased by 60 percent over the past six years.

#26 According to Poverty USA, 1.6 million American children slept in a homeless shelter or some other form of emergency housing last year.

#27 Police in New York City have identified 80 separate homeless encampments in the city, and the homeless crisis there has gotten so bad that it is being described as an “epidemic”.

#28 If you can believe it, more than half of all students in our public schools are poor enough to qualify for school lunch subsidies.

#29 According to a Census Bureau report that was released a while back, 65 percent of all children in the U.S. are living in a home that receives some form of aid from the federal government.

#30 According to a report that was published by UNICEF, almost one-third of all children in this country “live in households with an income below 60 percent of the national median income”.

#31 When it comes to child poverty, the United States ranks 36th out of the 41 “wealthy nations” that UNICEF looked at.

#32 An astounding 45 percent of all African-American children in the United States live in areas of “concentrated poverty”.

#33 40.9 percent of all children in the United States that are being raised by a single parent are living in poverty.

#34 There are 7.9 million working age Americans that are “officially unemployed” right now and another 94.4 million working age Americans that are considered to be “not in the labor force”.  When you add those two numbers together, you get a grand total of 102.3 million working age Americans that do not have a job right now.

#35 According to a recent Pew survey, approximately 70 percent of all Americans believe that “debt is a necessity in their lives”.

#36 53 percent of all Americans do not even have a minimum three-day supply of nonperishable food and water at home.

#37 According to John Williams of shadowstats.com, if the U.S. government was actually using honest numbers the unemployment rate in this nation would be 22.9 percent.

#38 Back in 1950, more than 80 percent of all men in the United States had jobs.  Today, only about 65 percent of all men in the United States have jobs.

#39 The labor force participation rate for men has plunged to the lowest level ever recorded.

#40 Wholesale sales in the U.S. have fallen to the lowest level since the last recession.

#41 The inventory to sales ratio has risen to the highest level since the last recession.  This means that there is a whole lot of unsold inventory that is just sitting around out there and not selling.

#42 The ISM manufacturing index has fallen for five months in a row.

#43 Orders for “core” durable goods have fallen for ten months in a row.

#44 Since March, the amount of stuff being shipped by truck, rail and air inside the United States has been falling every single month on a year over year basis.

#45 Wal-Mart is projecting that its earnings may fall by as much as 12 percent during the next fiscal year.

#46 The Business Roundtable’s forecast for business investment in 2016 has dropped to the lowest level that we have seen since the last recession.

#47 Corporate debt defaults have risen to the highest level that we have seen since the last recession.  This is a huge problem because corporate debt in the U.S. has approximately doubled since just before the last financial crisis.

#48 Holiday sales have gone negative for the first time since the last recession.

#49 The velocity of money in the United States has dropped to the lowest level ever recorded.  Not even during the depths of the last recession was it ever this low.

#50 Barack Obama promised that his program would result in a decline in health insurance premiums by as much as $2,500 per family, but in reality average family premiums have increased by a total of $4,865 since 2008.

#51 Today, the average U.S. household that has at least one credit card has approximately $15,950 in credit card debt.

#52 The number of auto loans that exceed 72 months has hit at an all-time high of 29.5 percent.

#53 According to Dr. Housing Bubble, there have been “nearly 8 million homes lost to foreclosure since the homeownership rate peaked in 2004”.

#54 One very disturbing study found that approximately 41 percent of all working age Americans either currently have medical bill problems or are paying off medical debt.  And collection agencies seek to collect unpaid medical bills from about 30 million of us each and every year.

#55 The total amount of student loan debt in the United States has risen to a whopping 1.2 trillion dollars.  If you can believe it, that total has more than doubled over the past decade.

#56 Right now, there are approximately 40 million Americans that are paying off student loan debt.  For many of them, they will keep making payments on this debt until they are senior citizens.

#57 When you do the math, the federal government is stealing more than 100 million dollars from future generations of Americans every single hour of every single day.

#58 An astounding 8.16 trillion dollars has already been added to the U.S. national debt while Barack Obama has been in the White House.  That means that it is already guaranteed that we will add an average of more than a trillion dollars a year to the debt during his presidency, and we still have more than a year left to go.

What we have seen so far is just the very small tip of a very large iceberg.  About six months ago, I stated that “our problems will only be just beginning as we enter 2016″, and I stand by that prediction.

We are in the midst of a long-term economic collapse that is beginning to accelerate once again.  Our economic infrastructure has been gutted, our middle class is being destroyed, Wall Street has been transformed into the biggest casino in the history of the planet, and our reckless politicians have piled up the biggest mountain of debt the world has ever seen.

Anyone that believes that everything is “perfectly fine” and that we are going to come out of this “stronger than ever” is just being delusional.  This generation was handed the keys to the finest economic machine of all time, and we wrecked it.  Decades of incredibly foolish decisions have culminated in a crisis that is now reaching a crescendo, and this nation is in for a shaking unlike anything that it has ever seen before.

So enjoy the rest of 2015 while you still can.

2016 is almost here, and it is going to be quite a year…

The Global Commodity Crash Tells Us That A Major Deflationary Financial Crisis Is Imminent

Global - Public DomainIf we really are plunging into a deflationary global financial crisis, we would expect to see commodity prices crash hard.  That happened just before the great stock market crash of 2008, and that is precisely what is happening once again right now.  On Thursday, the Bloomberg Commodity Index closed at 79.1544.  The last time that it closed this low was 16 years ago.  Not even during the worst moments of the last recession did it ever get so low.  Overall, the Bloomberg Commodity Index is down more than 28 percent over the past 12 months, and it has plummeted by more than half since mid-2011.  As a result of this stunning commodity collapse, extremely large mining companies such as Anglo American are imploding, giant commodity trading firms such as Glencore and Trafigura are in full-blown crisis mode, and huge portions of the global financial system are in danger of utterly collapsing.

In recent days, I have been trying to stress that many of the exact same patterns that we witnessed just prior to the great stock market crash of 2008 are happening once again.  This includes the staggering crash of commodity prices that we are currently witnessing, and even CNN acknowledges that there are parallels to what we experienced seven years ago…

The last time raw materials like copper and oil were this cheap, an economic depression loomed just around the corner.

It’s no secret that commodities in general have had a horrendous 2015. A nasty combination of overflowing supply and soft demand has wreaked havoc on the industry.

But prices for everything from crude oil to industrial metals like aluminum, steel, copper, platinum, and palladium have collapsed even further in recent days.

As I mentioned above, this crash in prices is hitting mining companies really hard.  Just this week, the fifth largest mining company in the entire world announced a massive restructuring and will be laying off tens of thousands of workers…

In the latest example of just how bad things have gotten, Anglo American–the world’s fifth largest miner–just kitchen sink-ed it, announcing a sweeping restructuring, a massive round of layoffs, and a dividend cut. The company will reduce its assets by some 60% while headcount will be cut by a whopping 85,000 or, nearly two-thirds. 

Overall, the U.S. has lost approximately 123,000 good paying jobs from the mining sector since the end of 2014.  And if commodity prices stay low, this sector is going to continue to bleed good paying jobs.

Meanwhile, investors have been dumping the debt of any companies that have anything to do with commodities.  This has significantly contributed to the emerging junk bond crisis that I discussed in my last article.  As I write this, a high yield bond ETF known as JNK has fallen all the way down to 34.31, which is the lowest that it has been since the last recession.  For much more on the junk bond implosion, I would encourage you to read an article that Wolf Richter just put out entitled “Bond King Gets Antsy as Junk Bonds, Which Lead Stocks, Spiral to Heck“.

So why are commodity prices falling so rapidly?

Many analysts are pointing to the economic slowdown in China as the primary reason.  For years, the Chinese economy voraciously gobbled up commodities from sources all over the planet, but now things are changing.  The Chinese economy is really, really slowing down, and some recently released numbers give us some clues as to the true extent of that slowdown…

-Chinese exports fell 6.8 percent in November on a year over year basis after being down 6.9 percent on a year over year basis in October.

-Chinese imports were down 8.7 percent in November on a year over year basis.

-Chinese manufacturing activity has been contracting for nine months in a row.

-Last week, the China Containerized Freight Index plummeted to 718.58 – the lowest level ever recorded.

And of course it isn’t just China.  Goldman Sachs says that the seventh largest economy on the entire planet, Brazil, has plunged into a “depression“.  And as I pointed out the other day, of the 93 largest stock market indexes in the entire world, an astonishing 47 of them (more than half) are down at least 10 percent year to date.

Even though stocks slid in the U.S. this week, the major indexes still seem somewhat stable.  But this is a bit of an illusion.  Yes, the biggest names on Wall Street are still flying high for the moment, but shares of a multitude of smaller and mid-size firms have been plummeting.  At this point, nearly 70 percent of all U.S. stocks are already below their 200 day moving averages.  This is yet another thing that we would expect to see just before the bottom falls out for stocks.

Everything that I have been writing about this week (see here and here) is perfectly consistent with all of my warnings from earlier this year.

We are plunging into a deflationary financial crisis in textbook fashion.  And if the Federal Reserve actually does decide to go ahead with an interest rate hike next week that is just going to make things even worse.

But most people are not patient enough to watch a process play out.  Most people that write about “the coming economic collapse” hype it up like it is going to be some sort of big Hollywood blockbuster that is going to happen over a week or a month and then be over.  That is definitely not the way that I see things.

To me, “the economic collapse” is something that has been happening for decades, that is still in the process of happening right now, and that will continue to happen as we move forward into the future.  The long-term trends that are ripping our economy to shreds continue to intensify, and our leaders are not doing anything to fix our underlying fundamental problems.

And the financial crisis that I warned would start during 2015 and accelerate in 2016 has already begun.  More than half of all major global stock market indexes are down by at least 10 percent year to date, and some of them have plummeted by more than 30 or 40 percent.  Trillions of dollars of wealth has been wiped out around the globe, and this is just the beginning.

All of the numbers tell us the same thing.

Big trouble is ahead.

My job is to inform you of these things.  What you choose to do with this information is up to you.

Guess What Happened The Last Time The Price Of Oil Plunged Below 38 Dollars A Barrel?

Question Mark Burning - Public DomainOn Monday, the price of U.S. oil dropped below 38 dollars a barrel for the first time in six years.  The last time the price of oil was this low, the global financial system was melting down and the U.S. economy was experiencing the worst recession that it had seen since the Great Depression of the 1930s.  As I write this article, the price of U.S. oil is sitting at $37.65.  For months, I have been warning that the crash in the price of oil would be extremely deflationary and would have severe consequences for the global economy.  Nations such as Japan, Canada, Brazil and Russia have already plunged into recession, and more than half of all major global stock market indexes are down at least 10 percent year to date.  The first major global financial crisis since 2009 has begun, and things are only going to get worse as we head into 2016.

The global head of oil research at Societe Generale, Mike Wittner, says that his “head is spinning” after the stunning drop in the price of oil on Monday.  Just like during the last financial crisis, we have broken the psychologically important 40 dollar barrier, and there are concerns that we could go much lower from here…

Price Of Oil - Public Domain

One analyst told CNBC that he believes that we could soon see the price of U.S. oil go all the way down to 32 dollars a barrel…

“We’re in a tug-of-war between a heavily shorted market and a glut of oil in the U.S. and globally, as Saudi Arabia continues to produce oil at elevated levels to maintain market share,” said Chris Jarvis at Caprock Risk Management, an energy markets consultancy in Frederick, Maryland.

“Couple this with a strengthening dollar as the market anticipates a U.S. rate hike this month, oil is heading lower with a near term target of $32 for WTI.”

Analysts at Goldman Sachs are even more pessimistic than that.  According to Business Insider, they are saying that we could eventually see the price of oil go below 20 dollars a barrel…

At OPEC’s meeting on Friday, member countries decided to set its production level at 31.5 million barrels per day, and did not agree on what the new limit should be.

After OPEC’s meeting, commodity strategists at Goldman put out a note saying that oil prices could plunge another 50% in the coming months, as the oil market tries to rebalance the supply and demand situation.

That may sound really good to you, especially if you fill up your gas tank frequently.  But the truth is that plunging oil prices are exceedingly bad for the U.S. economy as a whole.  In recent years, the energy industry has been the primary engine for the creation of good jobs in this country, and now those firms are having to lay off people at a frightening pace.  Not only that, CNBC’s Jim Cramer is warning that many of these firms may actually start going under if the price of oil doesn’t start going back up soon…

“This is not ‘longer and lower;’ this is ‘longer and much lower.’ There’s companies that are not going to be able to fund with futures; there’re companies that are not going to be able to get credit,” Cramer said on “Squawk on the Street.”

Cramer made his remarks after the Organization of the Petroleum Exporting Countries decided not to lower production on Friday.

This was a devastating blow for the U.S. oil industry,” Cramer said.

On Monday, we witnessed another benchmark that we have not seen since the last financial crisis.

I watch a high yield bond ETF known as JNK very closely.  On Monday, JNK broke below 35 for the first time since the financial crisis of 2008.  Just like 40 dollar oil, this is a key psychological barrier.

So why is this important?

As I discussed last week, junk bonds crashed before stocks did in 2008, and now it is happening again.  If form holds true, we should expect U.S. stocks to start tumbling significantly very shortly.

Meanwhile, another notable expert has come forward with a troubling forecast for the global economy in 2016.  Just like Citigroup, Raoul Pal believes that there is a very significant chance that we will see a recession next year…

Former global macro fund manager Raoul Pal says there’s now a 65% chance of a global recession.

In July, Pal predicted that the Institute of Supply Management’s (ISM) manufacturing index would break the key level of 50 late in 2015.

On December 1, the ISM broke the 50 level for the first time since the 2008 recession, reaching 48.6.

“I use the ISM as a guide to the global business cycle, not just the US cycle,” Pal told Business Insider.

What amazes me is that so many people out there cannot see what is happening even though the next great crisis has already started.  The evidence is all around us, and yet so many choose to be willingly blind.

Instead of fixing our problems after the last crisis, we just papered them over with lots of money printing and lots more debt.  And of course all of this manipulation just made our long-term problems even worse.  I really like how Peter Schiff put it recently…

What’s happening is pretty much what we would anticipate. I don’t see from the data any real economic recovery, certainly not in the United States.

We’re spending more money, but it’s not because we’re generating more wealth. We’re generating more debt. We’re using that borrowed money to consume and so temporarily it feels that we’re wealthier because we get to spend all that money… but we have to come to terms with paying the bill.

The bills are going to come due. Right now interest rates are being kept at zero which makes it possible to service the debt even though it’s impossible to repay it… at least we can service it. But once interest rates go up then we can’t even service it let alone repay it. 

And then the party is going to come to an end.

Indeed – the party is coming to an end, and a new financial crisis is playing out in textbook fashion right in front of our eyes.

Hopefully you are already prepared for what is coming next, because it is going to be extremely painful for the U.S. economy.

27 Major Global Stocks Markets That Have Already Crashed By Double Digit Percentages In 2015

Earth Globe - Public DomainAnyone that tries to tell you that a global financial crisis is not happening is not being honest with you.  Right now, there are 27 major global stock markets that have declined by double digit percentages from their peaks earlier this year.  And this is truly a global phenomenon – we have seen stock market crashes in Asia, Europe, South America, Africa and the Middle East.  But because U.S. stocks are only down less than a thousand points from the peak earlier this year, most Americans seem to think that everything is just fine.

The truth, of course, is that everything is not fine.  We are witnessing a pattern similar to what we saw back in 2008.  Back then, Chinese stocks and other major stock markets started crashing first, and then U.S. stocks followed later.

And it appears that we may have entered the next leg down for markets in the western world this week.  The Dow was down another 252 points on Thursday, and all of the major stock indexes in the U.S. are now negative for the year except for the NASDAQ.  Unless there is a major turnaround in the coming weeks, the six year winning streak for U.S. stocks is likely over.

But when you step back and look at what has been happening globally, a much more ominous picture emerges.  I spent much of the afternoon looking at stock market charts for the largest economies all over the globe.  What I discovered was financial carnage that was much worse than I anticipated.

It turns out that there are 27 major global stock markets that have fallen by more than 10 percent from peaks that were set earlier this year.  If you want to verify this information for yourself, just go to Trading Economics.  As you can see, many of these stock market declines have been quite impressive…

1. China: down more than 30 percent

2. Saudi Arabia: down 26 percent

3. Germany: down about 13 percent

4. United Kingdom: down close to 12 percent

5. Spain: down 15 percent

6. Brazil: down more than 22 percent (13,000 points overall)

7. Kuwait: down 14 percent

8. Turkey: down 16 percent

9. India: down close to 12 percent

10. Chile: down 11 percent

11. Columbia: down about 30 percent

12. Peru: down more than 40 percent

13. Bulgaria: down more than 20 percent

14. Greece: down more than 30 percent

15. Poland: down about 19 percent

16. Malaysia: down 10 percent

17. Egypt: down 32 percent

18. Indonesia: down 18 percent

19. Canada: down 12 percent

20. Ukraine: down 45 percent

21. Morocco: down 13 percent

22. Ghana: down 17 percent

23. Kenya: down 27 percent

24. Australia: down 13 percent

25. Nigeria: down more than 30 percent

26. Taiwan: down 15 percent

27. Thailand: down 20 percent

We have not seen numbers like these since 2008, and trillions of dollars of stock market wealth has been wiped out globally.  So the “nothing is happening” crowd is simply dead wrong.  Stocks are already crashing all over the planet.  Just because the big U.S. stock market crash has not happened quite yet does not mean that a major global financial crisis is not happening.

But do you know what is crashing here in this country?

Junk bonds.

At this point, yields on the riskiest junk bonds have risen to levels that we have not seen since the last financial crisis.  As I have discussed repeatedly, yields on junk bonds spiked dramatically just before the stock market crash of 2008, and now it is happening again…

Yield On CCC Bonds - Chart from Federal Reserve

This is precisely the kind of behavior that we would expect to see if a major U.S. stock market crash was imminent.  Personally, I watch the junk bond market very, very closely because it is such a key leading indicator.  And according to Jeffrey Snider, it appears that “something” is starting to cause junk bonds to sell off at an alarming pace…

There isn’t much as far as confirmation, but it increasingly appears as if “something” just hit the triple hooks (CCC) in the junk bond bubble. At least as far as one view of it, Bank of America ML’s CCC implied yield, there was a huge selloff that brought the yield to a new cycle high (low in price) above even the 2011 crisis peak.

But just like in 2008, a lot of people will not heed the warnings because they don’t have the patience to watch long-term trends play out.

We live in a society where we expect constant instant gratification.  We have instant coffee, video on demand and 48 hour news cycles.  If something does not happen immediately, most of us quickly lose patience.

On my other website, I include a lot more stories about things that are trending in the news.  For example, earlier today I wrote about the horrible shootings in San Bernardino, California and I explained why I believe that Islamic terror is now more of a threat to the American people than ever before.

But on this website I like to take a broader view of things.  For months, I have been warning that conditions were perfect for another major global financial crisis, and since that time events have been unfolding in textbook fashion.

And as you can see from the numbers above, we have already entered a new global financial crisis.  If you tried to tell someone in China, Brazil or Saudi Arabia that a financial crisis was not happening, they would just laugh at you.  We need to start learning that the world doesn’t revolve around the United States.

Of course the U.S. is heading for tremendous difficulties as well.  This is something that I covered yesterday.  All of the fundamental economic numbers are absolutely screaming “recession”, and yet most of the “experts” are still forecasting good things for the coming year.

Those that do not learn from history are doomed to repeat it.  None of the problems that caused the crisis the last time around have been fixed, and most of our “leaders” seem blind to what is happening at this moment even though the exact same patterns that played out in 2008 are playing out once again right in front of our eyes.

If you have been waiting for the next global financial crisis, you can stop, because it is already here.

As we move toward the end of 2015, let us hope for the best, but let us also get prepared for the worst.