12 Ways The Economy Is Already In Worse Shape Than It Was During The Depths Of The Last Recession

Twelve - Public DomainDid you know that the percentage of children in the United States that are living in poverty is actually significantly higher than it was back in 2008?  When I write about an “economic collapse”, most people think of a collapse of the financial markets.  And without a doubt, one is coming very shortly, but let us not neglect the long-term economic collapse that is already happening all around us.  In this article, I am going to share with you a bunch of charts and statistics that show that economic conditions are already substantially worse than they were during the last financial crisis in a whole bunch of different ways.  Unfortunately, in our 48 hour news cycle world, a slow and steady decline does not produce many “sexy headlines”.  Those of us that are news junkies (myself included) are always looking for things that will shock us.  But if you stand back and take a broader view of things, what has been happening to the U.S. economy truly is quite shocking.  The following are 12 ways that the U.S. economy is already in worse shape than it was during the depths of the last recession…

#1 Back in 2008, 18 percent of all Americans kids were living in poverty.  This week, we learned that number has now risen to 22 percent

There are nearly three million more children living in poverty today than during the recession, shocking new figures have revealed.

Nearly a quarter of youngsters in the US (22 percent) or around 16.1 million individuals, were classed as living below the poverty line in 2013.

This has soared from just 18 percent in 2008 – during the height of the economic crisis, the Casey Foundation’s 2015 Kids Count Data Book reported.

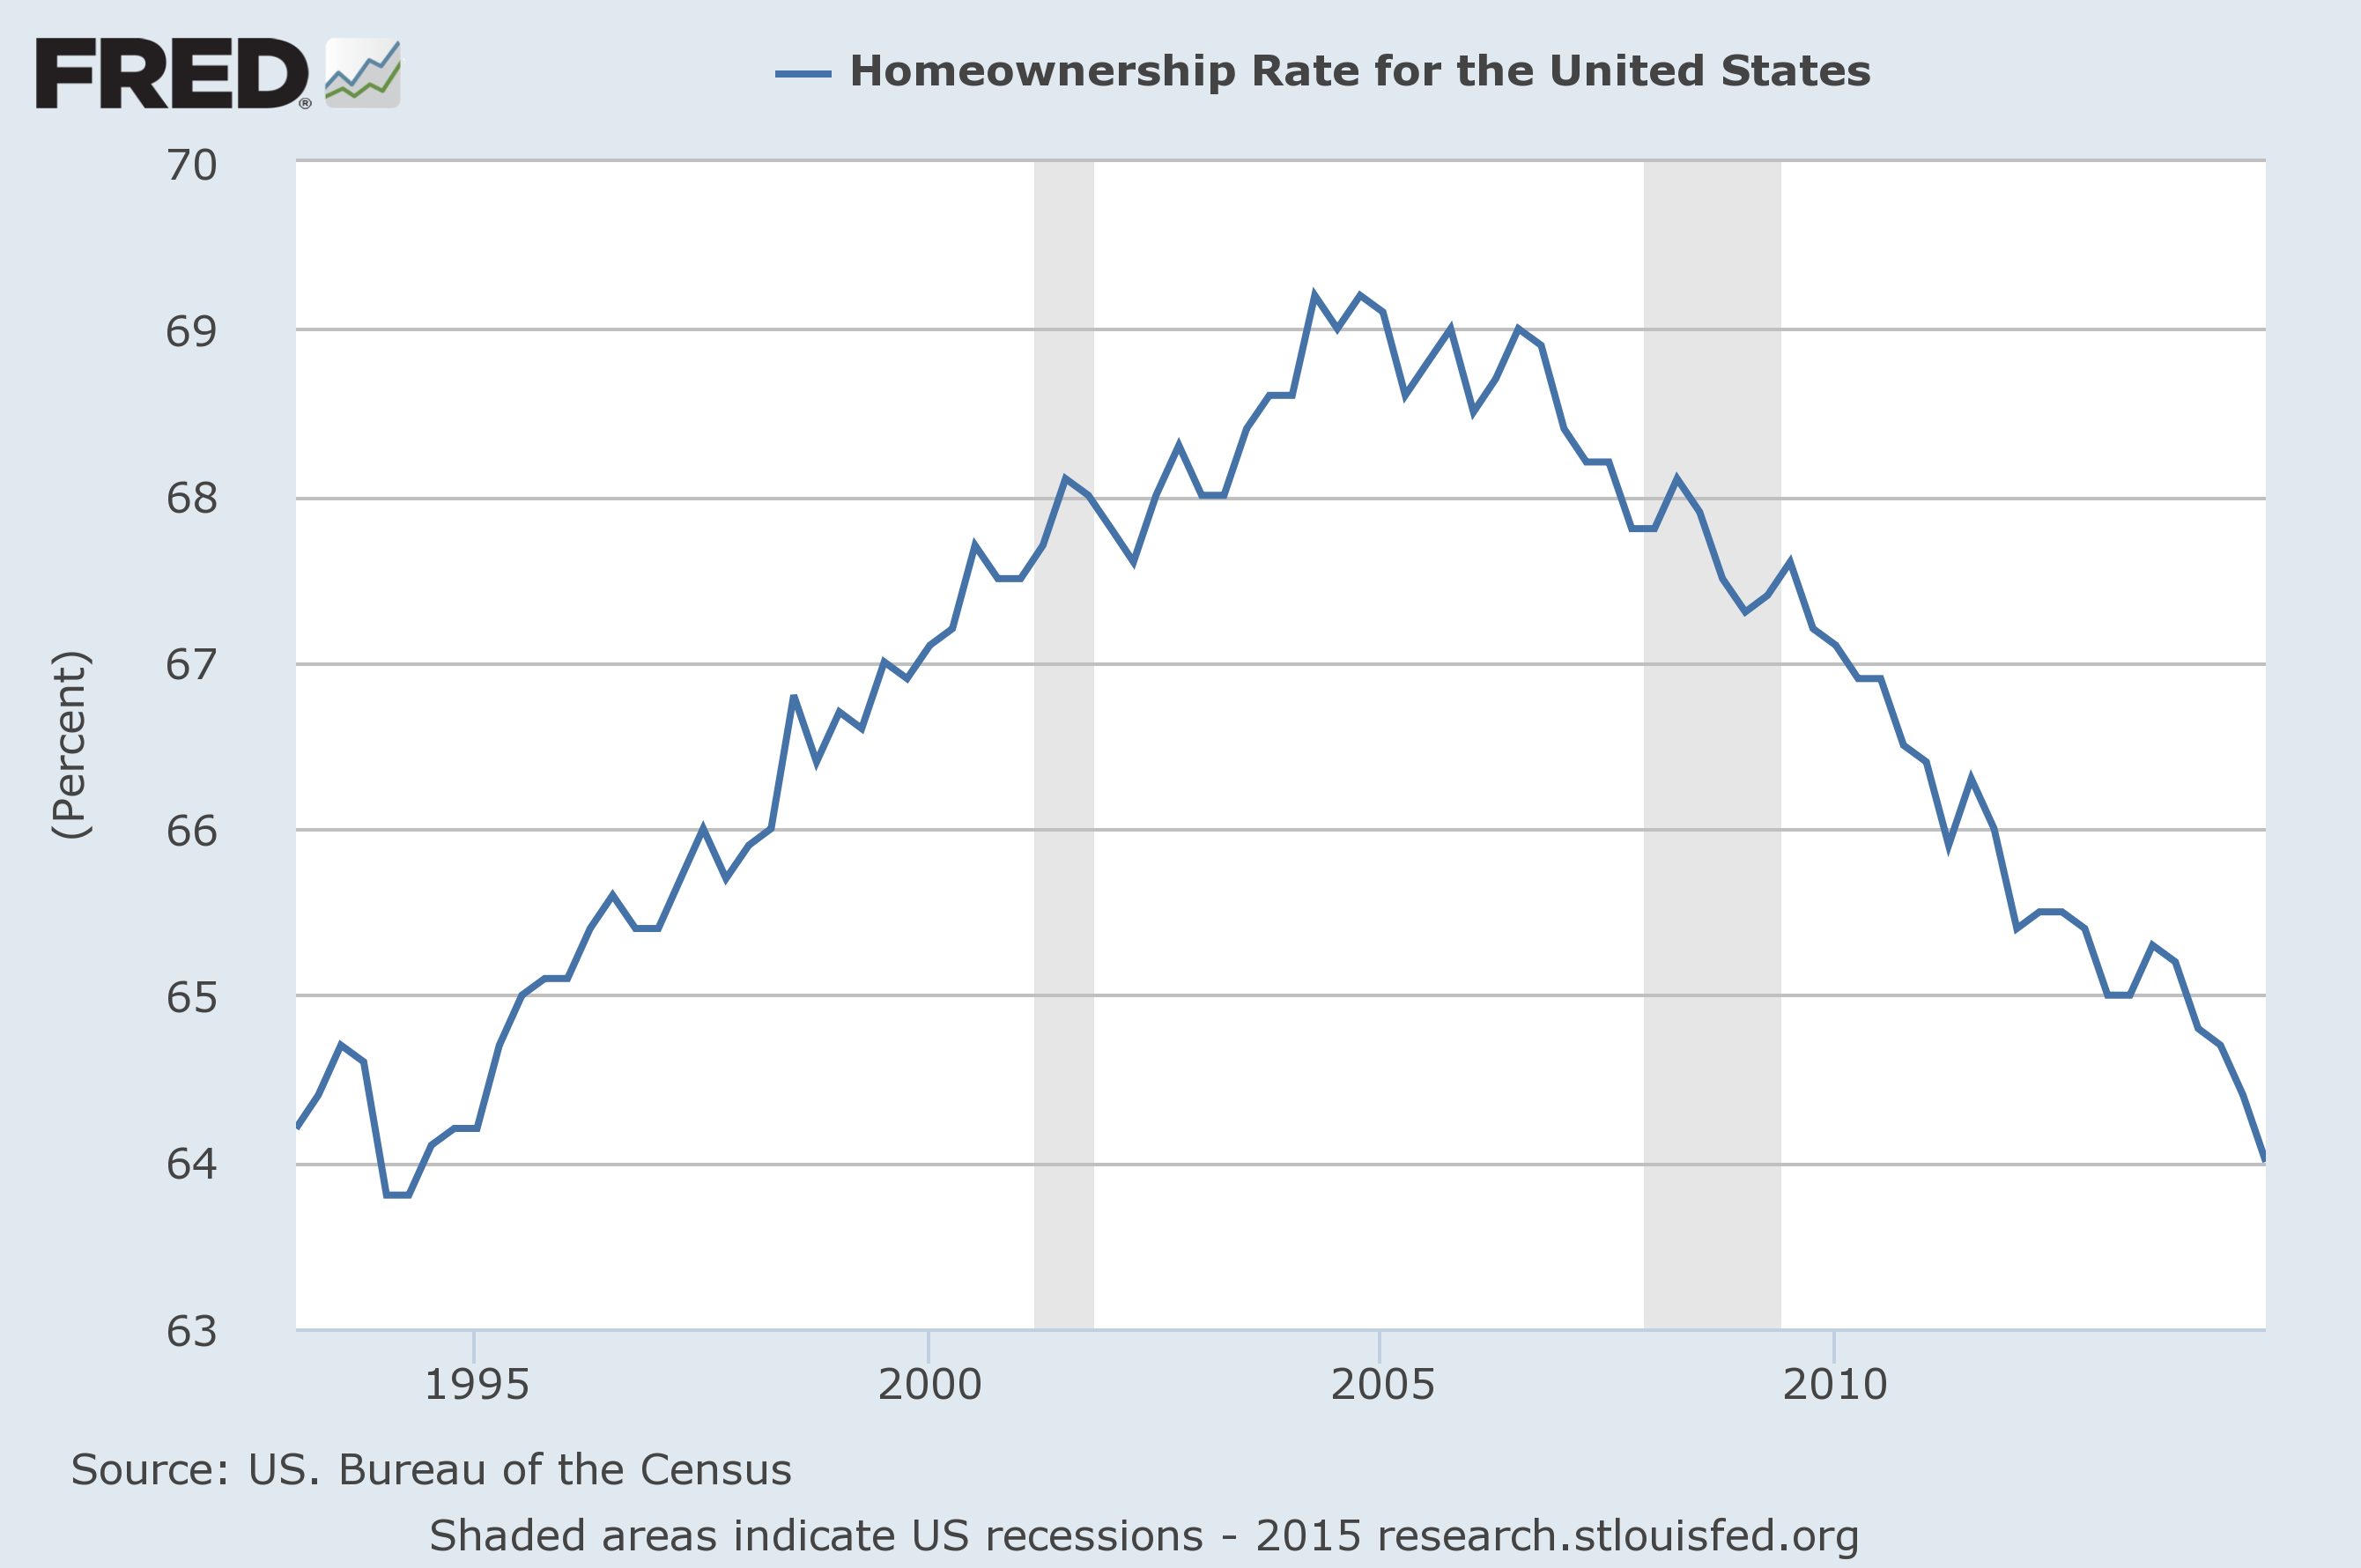
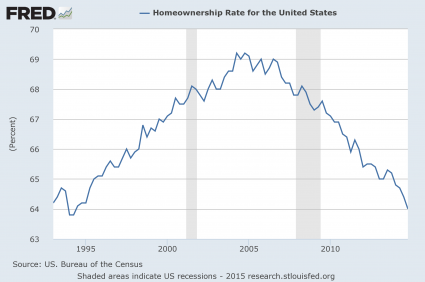
#2 In early 2008, the homeownership rate in the U.S. was hovering around 68 percent.  Today, it has plunged below 64 percent.  Incredibly, it has not been this low in more than 20 years.  Just look at this chart – the homeownership rate has continued to plummet throughout Obama’s “economic recovery”…

Homeownership Rate 2015

#3 While Barack Obama has been in the White House, government dependence has skyrocketed to levels that we have never seen before.  In 2008, the federal government was spending about 37 billion dollars a year on the federal food stamp program.  Today, that number is above 74 billion dollars.  If the economy truly is “recovering”, why is government dependence so much higher than it was during the last recession?

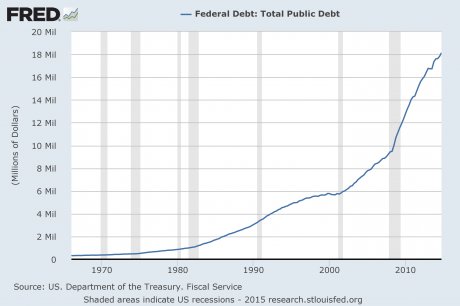
#4 On the chart below, you can see that the U.S. national debt was sitting at about 9 trillion dollars when we entered the last recession.  Since that time, the debt of the federal government has doubled.  We are on the exact same path that Greece has gone down, and what you are looking at below is a recipe for national economic suicide…

Presentation National Debt

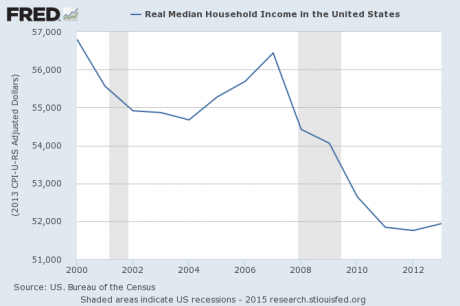
#5 During Obama’s “recovery”, real median household income has actually gone down quite a bit.  Just prior to the last recession, it was above $54,000 per year, but now it has dropped to about $52,000 per year…

Median Household Income

#6 Even though our incomes are stagnating, the cost of living just continues to rise steadily.  This is especially true of basic things that we all purchase such as food.  As I wrote about earlier this year, the price of ground beef in the United States has doubled since the last recession.

#7 In a healthy economy, lots of new businesses are opening and not that many are being forced to shut down.  But for each of the past six years, more businesses have closed in the United States than have opened.  Prior to 2008, this had never happened before in all of U.S. history.

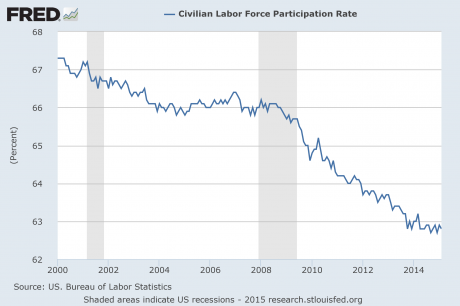
#8 Barack Obama is constantly telling us about how unemployment is “going down”, but the truth is that the  percentage of working age Americans that are either working or considered to be looking for work has steadily declined since the end of the last recession…

Presentation Labor Force Participation Rate

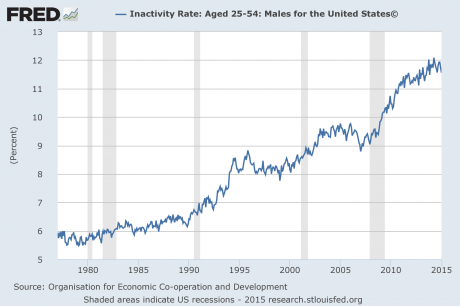
#9 Some have suggested that the decline in the labor force participation rate is due to large numbers of older people retiring.  But the reality of the matter is that we have seen a spike in the inactivity rate for Americans in their prime working years.  As you can see below, the percentage of males between the ages of 25 and 54 that aren’t working and that aren’t looking for work has surged to record highs since the end of the last recession…

Presentation Inactivity Rate

#10 A big reason why we don’t have enough jobs for everyone is the fact that millions upon millions of good paying jobs have been shipped overseas.  At the end of Barack Obama’s first year in office, our yearly trade deficit with China was 226 billion dollars.  Last year, it was more than 343 billion dollars.

#11 Thanks to all of these factors, the middle class in America is dying.  In 2008, 53 percent of all Americans considered themselves to be “middle class”.  But by 2014, only 44 percent of all Americans still considered themselves to be “middle class”.

When you take a look at our young people, the numbers become even more pronounced.  In 2008, 25 percent of all Americans in the 18 to 29-year-old age bracket considered themselves to be “lower class”.  But in 2014, an astounding 49 percent of all Americans in that age range considered themselves to be “lower class”.

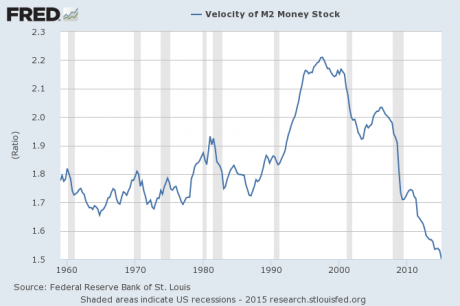
#12 This is something that I have covered before, but it bears repeating.  The velocity of money is a very important indicator of the health of an economy.  When an economy is functioning smoothly, people generally feel quite good about things and money flows freely through the system.  I buy something from you, then you take that money and buy something from someone else, etc.  But when an economy is in trouble, the velocity of money tends to go down.  As you can see on the chart below, a drop in the velocity of money has been associated with every single recession since 1960.  So why has the velocity of money continued to plummet since the end of the last recession?…

Velocity Of Money M2

If you are waiting for an “economic collapse” to happen, you can stop waiting.

One is unfolding right now before our very eyes.

But what most people really mean when they ask about these things is that they are wondering when the next great financial crisis will happen.  And as I discussed yesterday, things are lining up in textbook fashion for one to happen in our very near future.

Once the next great financial crisis does strike, all of the numbers that I just discussed above are going to get a whole lot worse.

So as bad as things are now, the truth is that this is just the beginning of the pain.

The German Siege Of Greece Begins (No, This Is Not A Repeat From 1941)

Siege - Public DomainDid you notice that Greece’s creditors are not rushing to offer the Greeks a new deal in the wake of the stunning referendum result on Sunday?  In fact, it is being reported that the initial reaction to the “no” vote from top European politicians was “a thunderous silence“.  Needless to say, the European elite were not pleased by how the Greek people voted, but they still have all of the leverage.  In particular, it is the Germans that are holding all of the cards.  If the Germans want to cave in and give the Greeks the kind of deal that they desire, everyone else would follow suit.  And if the Germans want to maintain a hard line with Greece, they can block any deal from happening all by themselves.  So in the final analysis, this is really an economic test of wills between Germany and Greece, and time is on Germany’s side.  Germany doesn’t have to offer anything new.  The Germans can just sit back and wait for the Greek government to default on their debts, for Greek banks to totally run out of cash and for civil unrest to erupt in Greek cities as the economy grinds to a standstill.

In ancient times, if a conquering army came up against a walled city that was quite formidable, often a decision would be made to conduct a siege.  Instead of attacking a heavily defended city directly and taking heavy casualties, it was often much more cost effective to simply surround the city from a safe distance and starve the inhabitants into submission.

In a sense, that is exactly what the Germans appear to want to do to the Greeks.  Without more cash, the Greek government cannot pay their bills.  Without more cash, Greek banks are going to start collapsing left and right.  Without more cash, the Greek economy is going to completely and utterly collapse.

So yes, the Greeks voted for change, but the Germans still hold the purse strings.

And right now the Germans do not sound like they are in any mood to compromise.  The following comes from a Reuters report that was published on Monday…

German Chancellor Angela Merkel’s deputy said Athens had wrecked any hope of compromise with its euro zone partners by overwhelmingly rejecting further austerity.

Merkel and French President Francois Hollande conferred by telephone and will meet in Paris on Monday afternoon to seek a joint response. Responding to their call, European Council President Donald Tusk announced that euro zone leaders would meet in Brussels on Tuesday evening (1600 GMT).

German Vice-Chancellor Sigmar Gabriel, leader of Merkel’s centre-left Social Democratic junior coalition partner, said it was hard to conceive of fresh negotiations on lending more billions to Athens after Greeks voted against more austerity.

Leftist Prime Minister Alexis Tsipras had “torn down the last bridges on which Greece and Europe could have moved towards a compromise,” Gabriel told the Tagesspiegel daily.

In addition, Angela Merkel’s office released a statement on Monday that placed the onus on making a new proposal to end this crisis on the Greek government

It is up to Greece to make something of this. We are waiting to see which proposals the Greek government makes to its European partners,” the office of German Chancellor Angela Merkel, Europe’s leading austerity advocate, said in a statement.

Just because the Greek people want the Germans to give them a very favorable deal does not mean that the Germans will be inclined to do so.  The Germans know that whatever they do with the Greeks will set a precedent for the rest of the financially-troubled nations all across Europe.  If Greece gets a free lunch, then Italy, Spain, Portugal, Ireland and France will expect the same kind of treatment

Angelos Chryssogelos, an expert on Greek politics at the London-based think tank Chatham House, said the strength of Sunday’s mandate handed to Tsipras means it will be almost impossible for the prime minister’s leftist Syriza party to make a deal with European creditors.

“The Europeans made it pretty clear where they stand, and they have been consistent,” Chryssogelos said, adding that the creditors also are unlikely to back down. “Right now, voters across the eurozone largely support the tough stance taken by the eurozone.”

Chryssogelos said Greek voters may have underestimated the resolve of the creditors to reach an accord on their terms. “If someone is seen getting preferential treatment, then someone else will want that treatment,” he said, referring to other eurozone debtors such as Ireland and Portugal.

And remember, there is a very important Spanish election coming up in December.

If Syriza comes out as the big winner in this crisis, it will empower similar movements in Spain and all over the rest of the continent.

So look for Greece’s creditors to tighten the screws over the coming days.  In fact, we already saw a bit of screw tightening on Monday when the ECB announced that Greek banks would not be receiving additional emergency assistance

In a move sure to increase pressure on Greece’s flailing banks, the European Central Bank on Monday decided not to expand an emergency assistance program, raising fears that Greece could soon go completely bankrupt.

The move put a swift crimp on Greek leaders’ jubilation after winning a landslide endorsement from their citizens to reject Europe’s austerity demands and seek a new bailout bargain. Now they must seek a bargain before the money runs out within days, which would likely force them off the euro.

Basically we are watching a very high stakes game of chicken play out.  And as the cash dwindles, economic activity in Greece is slowly grinding to a halt.  The following comes from the Washington Post

The dwindling cash is sucking the life out of everything from coffee shops to taxis, as anxious Greeks economize amid fears for the future. Greek leaders also banned transfers of money abroad, meaning that very little can now be imported into the country.

Printing plants are warning that they may run out of paper to print newspapers by the end of the week. Butchers say that stocks of imported meat are dwindling.

Some are even projecting that we could see civil unrest erupt in Greece in about “48 hours” once the ATM machines  run out of cash

Greek Prime Minister Alexis Tsipras probably has 48 hours to resolve a standoff with creditors before civil unrest breaks out and ATMs run out of cash, hedge fund Balyasny Asset Management said.

Yes, the Greek people exhibited great resolve in voting against the demands of the creditors on Sunday.

But how long can they endure this economic siege?

It is inevitable that a breaking point will come.  Either the Greek government will give in, or the Greeks will leave the euro and start to transition back to the drachma.

If we do see a “Grexit”, and many analysts believe that one is coming, it could set off a chain of events that could cause immense financial pain all over the planet.  There are tens of trillions of dollars of derivatives that are tied to European bond yields, European interest rates, etc.  The following is an excerpt from a piece authored by Phoenix Capital Research that explains what kind of jeopardy we could potentially be facing…

The global derivatives market is roughly $700 trillion in size. That’s over TEN TIMES the world’s GDP. And sovereign bonds… including even bonds from bankrupt countries such as Greece… are one of, if not the primary collateral underlying all of these trades.

Greece is not the real issue for Europe. The entire Greek debt market is about €345 billion in size. So we’re not talking about a massive amount of collateral… though the turmoil this country has caused in the last three years gives a sense of the importance of the issue.

Spain, by comparison has over €1.0 trillion in debt outstanding… and Italy has €2.6 trillion. These bonds are backstopping tens of trillions of Euros’ worth of derivatives trades. A haircut on them would trigger systemic failure in Europe.

If Greece gets a “haircut” on their debt, other European nations would want the same and that would cause massive chaos in the derivatives markets.

But if Greece does not get a deal and ends up leaving the eurozone, that will cause bond yields to go crazy all over Europe and that would also cause tremendous chaos in the derivatives markets.

So much depends on keeping this system of legalized gambling that we call “derivatives trading” stable.  We have allowed the global derivatives bubble to become many times larger than the GDP of the entire planet, and in the end we will pay a great price for this foolishness.

Every pyramid scheme eventually collapses, and this one will too.

But the difference with this pyramid scheme is that it is going to take the entire global financial system down with it.

A Recession Within A Recession

Recession - Public DomainOn Friday, the federal government announced that the U.S. economy contracted at a 0.7 percent annual rate during the first quarter of 2015.  This unexpected shrinking of the economy is being primarily blamed on “harsh” weather during the first three months of this year and on the strengthening of the U.S. dollar.  Most economists are confident that U.S. GDP will rebound back into positive territory when the numbers for the second quarter come out, but if that does not happen we will officially meet the government’s criteria for being in another “recession”.  To make sure that the numbers for Q2 will look “acceptable”, the Bureau of Economic Analysis is about to change the way that it calculates GDP again.  They are just going to keep “seasonally adjusting” the numbers until they get what they want.  At this point, the government numbers are so full of “assumptions” and “estimates” that they don’t really bear much resemblance to reality anyway.  In fact, John Williams of shadowstats.com has calculated that if the government was actually using honest numbers that they would show that we have continually been in a recession since 2005.  That is why I am referring to this as a “recession within a recession”.  Most people can look around and see that economic conditions for most Americans are not good, and now they are about to get even worse.

For quite a while I have been warning that another economic downturn was coming.  Well, now we have official confirmation from the Obama administration that it is happening.  The following is an excerpt from the statement that the Bureau of Economic Analysis released on Friday

Real gross domestic product — the value of the production of goods and services in the United
States, adjusted for price changes — decreased at an annual rate of 0.7 percent in the first quarter of
2015, according to the “second” estimate released by the Bureau of Economic Analysis. In the fourth
quarter, real GDP increased 2.2 percent.

The GDP estimate released today is based on more complete source data than were available for
the “advance” estimate issued last month. In the advance estimate, real GDP increased 0.2 percent.
With the second estimate for the first quarter, imports increased more and private inventory investment
increased less than previously estimated (for more information, see “Revisions” on page 3).

The decrease in real GDP in the first quarter primarily reflected negative contributions from
exports, nonresidential fixed investment, and state and local government spending that were partly offset by positive contributions from personal consumption expenditures (PCE), private inventory investment, and residential fixed investment.

And actually, Q1 GDP would have been far worse if not for a very large inventory buildup.  Without that inventory buildup, Q1 GDP would have been in the neighborhood of negative three percent according to Zero Hedge.  Despite the happy face that most analysts are putting on these numbers, the truth is that they reveal some deeply troubling trends.

One of the things that is driving this current downturn is the fact that our trade balance continues to get even worse.  In other words, the gap between how much we buy from the rest of the world and how much we sell to the rest of the world is growing.

During the first quarter, imports surged by 5.6 percent.  That means that we are buying more from the rest of the planet than we did before.

Unfortunately, during the first quarter of this year exports dropped by a staggering 7.6 percent.  That means that the amount of stuff that we are selling to the rest of the planet is falling precipitously.

When our trade deficit expands, we lose jobs, businesses and economic infrastructure at an even faster pace.  This is why I write about trade issues so much.  Our economy is being absolutely eviscerated, and the Obama administration is pushing another giant trade deal which will greatly accelerate this process.

We are committing national economic suicide by running colossal trade deficits year after year.  But instead of addressing our problems, our “leaders” just continue to conduct business as usual.

And to make themselves look good, they just keep manipulating the numbers until they seem “reasonable”.  As I mentioned above, the negative number for Q1 is causing a lot of consternation in Washington, so now the Bureau of Economic Analysis is going to modify the way that GDP is calculated once again.  The following comes from Bloomberg

The way some parts of U.S. gross domestic product are calculated are about to change in the wake of the debate over persistently depressed first-quarter growth.

In a blog post published Friday, the Bureau of Economic Analysis listed a series of alterations it will make in seasonally adjusting data used to calculate economic growth. The changes will be implemented with the release of the initial second-quarter GDP estimate on July 30, the BEA said.

Although the agency adjusts its figures for seasonal variations, growth in any given first quarter still tends to be weaker than in the remaining three, economists have found, a sign there may be some bias in the data. It’s a phenomenon economists call “residual seasonality.”

Why can’t they just give us honest numbers?

Meanwhile, we also learned on Friday that corporate profits declined again during the first quarter of 2015.  This was the second quarter in a row that we have seen this happen.  The following comes from CNS News

The BEA report also released data on corporate profits, which showed a decrease from the previous quarter. ‘Profits from current production decreased $125.5 billion in the first quarter, compared with a decrease of $30.4 billion in the fourth,’ BEA said.

Can you guess the last time that corporate profits declined for two quarters in a row?

It was in 2008.

So many of the exact same red flags that popped up seven years ago are popping up once again.

I know that I must sound like a broken record, but right now there are more signals that another major economic downturn is approaching than there has been at any other time since I started The Economic Collapse Blog in 2009.

Hopefully this summer will be relatively quiet, but I fully expect for events to start accelerating significantly during the second half of this year.

So if you have things that you need to get done before the next crisis arrives, you better hurry up, because time is quickly running out.

16 Signs That The Economy Has Stalled Out And The Next Economic Downturn Is Here

Get Prepared NowIf U.S. economic growth falls any lower, we are officially going to be in recession territory.  On Wednesday, we learned that U.S. GDP grew at a 0.2 percent annual rate in the first quarter of 2015.  That was much lower than all of the “experts” were projecting.  And of course there are all sorts of questions whether the GDP numbers the government feeds us are legitimate anyway.  According to John Williams of shadowstats.com, if honest numbers were used they would show that U.S. GDP growth has been continuously negative since 2005.  But even if we consider the number that the government has given us to be the “real” number, it still shows that the U.S. economy has stalled out.  It is almost as if we have hit a “turning point”, and there are many out there (including myself) that believe that the next major economic downturn is dead ahead.  As you will see in this article, a whole bunch of things are happening right now that we would expect to see if a recession was beginning.  The following are 16 signs that the economy has stalled out and the next economic downturn is here…

#1 We just learned that U.S. GDP grew at an anemic 0.2 percent annual rate during the first quarter of 2015…

The gross domestic product grew between January and March at an annualized rate of 0.2 percent, the U.S. Commerce Department said, adding to the picture of an economy braking sharply after accelerating for much of last year. The pace fell well shy of the 1 percent mark anticipated by analysts and marked the weakest quarter in a year.

#2 If you strip a very unusual inventory buildup out of the GDP number, U.S. GDP would have actually fallen at a -2.5 percent annual rate during the first quarter…

The only good news: the massive inventory build, the largest since 2010, boosted GDP by nearly 3.0%. Without this epic stockpiling of non-farm inventory which will have to be liquidated at some point (and at a very low price) Q1 GDP would have been -2.5%.

#3 Our trade deficit with the rest of the planet is absolutely killing our economic growth.  According to the Reality Chek Blog, U.S. economic growth would have been a total of 8 percent higher since the end of the last recession if we actually had balanced trade with other nations…

As of the new first quarter figures, the worsening of the trade deficit has reduced the cumulative real growth of the U.S. economy by 7.99 percent since the current recovery began in the second quarter of 2009.

#4 According to numbers that were just released by the Bureau of Labor Statistics, in one out of every five American families nobody has a job.  So how in the world can the “unemployment rate” be sitting at “5.5 percent” when everyone is unemployed in 20 percent of all families in the United States?  It doesn’t make any sense.

#5 The rate of homeownership in the United States has just hit a brand new 25 year low.  How can anyone claim that the middle class is “healthy” when the percentage of Americans that own a home is the lowest that it has been in more than two decades?

#6 Back in 2013, 31 percent of all Americans said that they did not anticipate buying a home “for the foreseeable future”.  Just two years later, that number has risen to 41 percent.

#7 The student loan bubble is clearly bursting.  According to Bloomberg, only 37 percent of all student loan borrowers are actually up to date on their payments and reducing their balances…

With borrowers increasingly struggling to repay their student loans, Moody’s Investors Service is warning it may take investors longer than promised to get their money back. The credit grader said this month it may lower rankings on $3 billion of top-rated debt as investors face the threat of slowing principal payments or even receiving no interest.

The concern underscores the fallout from a record $1.2 trillion in U.S. student loans that’s spreading to everything from the housing market and consumer spending to taxpayers. As a sluggish economic recovery forces borrowers to miss payments or tap relief programs, only 37 percent are current and reducing their balances, according to a Federal Reserve Bank of New York presentation this month.

#8 Procter & Gamble has announced that it will be cutting up to 6,000 more jobs from their payroll.  Why would they be doing this if the economy is “getting better”?

#9 McDonald’s plans to permanently shut down 700 “poorly performing” restaurants over the course of 2015.  Why would they be doing this if the economy is “getting better”?

#10 It is being projected that half of all fracking companies in the United States will be either “dead or sold” by the end of 2015.

#11 Retail sales in the U.S. have not dropped this rapidly since the last recession.

#12 Wholesale sales in the U.S. have not dropped this rapidly since the last recession.

#13 Factory orders in the U.S. have not dropped this rapidly since the last recession.

#14 Credit requests are being declined at a rate that we haven’t seen since the last recession.

#15 U.S. export growth has gone negative for the first time since the last recession.

#16 As the U.S. economy begins to head into another downturn, most Americans are completely unprepared for it.  In fact, one recent survey discovered that 62 percent of all Americans are currently living paycheck to paycheck.

Don’t let this next recession take you by surprise.

Back in 2008 and 2009, millions of Americans suddenly lost their jobs or businesses because of the sharp economic downturn.  Because most of them were living paycheck to paycheck, all of a sudden a whole lot of Americans could not make their mortgage payments and foreclosures surged to unprecedented heights.  Millions of families that thought they were operating on a solid foundation saw their middle class lifestyles evaporate in just a matter of a few months.

That is why it is so vital to prepare yourself financially, mentally, emotionally, physically and spiritually for the great storm that is coming ahead of time.  Over the past couple of years, I have been working on a new book entitled “Get Prepared Now” which talks about how to make these preparations.  On Wednesday, it was finally released to the public.  I hope that you will check it out.

The past few years have been a period of relative stability for the U.S. economy.  A lot of people have been lulled into a false sense of security during that time.  These people have become convinced that our problems have been fixed.  But they haven’t been fixed at all.  In fact, our problems are far, far worse than they were just prior to the last financial crisis.

When the next great financial crisis strikes, we are going to see a spike in the suicide rate just like we did during the last one.  Millions will be blindsided by what is coming and will give in to depression and despair.  But that doesn’t have to happen to you.  It is empowering to know what is coming and to understand why it is coming.  It is empowering to get prepared in advance for turbulent times.  It is empowering to have a plan for the years ahead.

Even though I write about all of the horrible things that are coming to this country every day, I live my life with no fear, and that is what I want for all of you as well.

Do you want to know who will be giving in to fear and panic when things start to go really crazy?

It will be the people that had no idea what was coming and made no preparations whatsoever.

Yes, the times ahead are going to be extremely challenging, but they can also be the best times of your life.

It is all going to come down to how you respond to a world that is going completely insane.

The choice is up to you.


Why The Price Of Oil Is More Likely To Fall To 20 Rather Than Rise To 80

Oil - Public DomainThis is just the beginning of the oil crisis.  Over the past couple of weeks, the price of U.S. oil has rallied back above 50 dollars a barrel.  In fact, as I write this, it is sitting at $52.93.  But this rally will not last.  In fact, analysts at the big banks are warning that we could soon see U.S. oil hit the $20 mark.  The reason for this is that the production of oil globally is still way above the current level of demand.  Things have gotten so bad that millions of barrels of oil are being stored at sea as companies wait for the price of oil to go back up.  But the price is not going to go back up any time soon.  Even though rigs are being shut down in the United States at the fastest pace since the last financial crisis, oil production continues to go up.  In fact, last week more oil was produced in the U.S. than at any time since the 1970s.  This is really bad news for the economy, because the price of oil is already at a catastrophically low level for the global financial system.  If the price of oil stays at this level for the rest of the year, we are going to see a whole bunch of energy companies fail, billions of dollars of debt issued by energy companies could go bad, and trillions of dollars of derivatives related to the energy industry could implode.  In other words, this is a recipe for a financial meltdown, and the longer the price of oil stays at this level (or lower), the more damage it is going to do.

The way things stand, there is simply just way too much oil sitting out there.  And anyone that has taken Economics 101 knows that when supply far exceeds demand, prices go down

Oil prices have gotten crushed for the last six months. The extent to which that was caused by an excess of supply or by a slowdown in demand has big implications for where prices will head next. People wishing for a big rebound may not want to read farther.

Goldman Sachs released an intriguing analysis on Wednesday that shows what many already suspected: The big culprit in the oil crash has been an abundance of oil flooding the market. A massive supply shock in the second half of last year accounted for most of the decline. In December and January, slowing demand contributed to the continued sell-off.

At this point so much oil has already been stored up that companies are running out of places to put in all.  Just consider the words of Goldman Sachs executive Gary Cohn

“I think the oil market is trying to figure out an equilibrium price. The danger here, as we try and find an equilibrium price, at some point we may end up in a situation where storage capacity gets very, very limited. We may have too much physical oil for the available storage in certain locations. And it may be a locational issue.”

“And you may just see lots of oil in certain locations around the world where oil will have to price to such a cheap discount vis-a-vis the forward price that you make second tier, and third tier and fourth tier storage available.”

[…] “You could see the price fall relatively quickly to make that storage work in the market.”

The market for oil has fundamentally changed, and that means that the price of oil is not going to go back to where it used to be.  In fact, Goldman Sachs economist Sven Jari Stehn says that we are probably heading for permanently lower prices

The big take-away: “[T]he decline in oil has been driven by an oversupplied global oil market,” wrote Goldman economist Sven Jari Stehn. As a result, “the new equilibrium price of oil will likely be much lower than over the past decade.”

So how low could prices ultimately go?

As I mentioned above, some analysts are throwing around $20 as a target number

The recent surge in oil prices is just a “head-fake,” and oil as cheap as $20 a barrel may soon be on the way, Citigroup said in a report on Monday as it lowered its forecast for crude.

Despite global declines in spending that have driven up oil prices in recent weeks, oil production in the U.S. is still rising, wrote Edward Morse, Citigroup’s global head of commodity research. Brazil and Russia are pumping oil at record levels, and Saudi Arabia, Iraq and Iran have been fighting to maintain their market share by cutting prices to Asia. The market is oversupplied, and storage tanks are topping out.

A pullback in production isn’t likely until the third quarter, Morse said. In the meantime, West Texas Intermediate Crude, which currently trades at around $52 a barrel, could fall to the $20 range “for a while,” according to the report.

Keep in mind that the price of oil is already low enough to be a total nightmare for the global financial system if it stays here for the rest of 2015.

If we go down to $20 and stay there, a global financial meltdown is virtually guaranteed.

Meanwhile, the “fracking boom” in the United States that generated so many jobs, so much investment and so much economic activity is now turning into a “fracking bust”

The fracking-for-oil boom started in 2005, collapsed by 60% during the Financial Crisis when money ran out, but got going in earnest after the Fed had begun spreading its newly created money around the land. From the trough in May 2009 to its peak in October 2014, rigs drilling for oil soared from 180 to 1,609: multiplied by a factor of 9 in five years! And oil production soared, to reach 9.2 million barrels a day in January.

It was a great run, but now it is over.

In the months ahead, the trickle of good paying oil industry jobs that are being lost right now is going to turn into a flood.

And this boom was funded with lots and lots of really cheap money from Wall Street.  I like how Wolf Richter described this in a recent article

That’s what real booms look like. They’re fed by limitless low-cost money – exuberant investors that buy the riskiest IPOs, junk bonds, leveraged loans, and CLOs usually indirectly without knowing it via their bond funds, stock funds, leveraged-loan funds, by being part of a public pension system that invests in private equity firms that invest in the boom…. You get the idea.

As all of this bad paper unwinds, a lot of people are going to lose an extraordinary amount of money.

Don’t get caught with your pants down.  You will want your money to be well away from the energy industry long before this thing collapses.

And of course in so many ways what we are facing right now if very reminiscent of 2008.  So many of the same patterns that have played out just prior to previous financial crashes are happening once again.  Right now, oil rigs are shutting down at a pace that is almost unprecedented.  The only time in recent memory that we have seen anything like this was just before the financial crisis in the fall of 2008.  Here is more from Wolf Richter

In the latest reporting week, drillers idled another 84 rigs, the second biggest weekly cut ever, after idling 83 and 94 rigs in the two prior weeks. Only 1056 rigs are still drilling for oil, down 443 for the seven reporting weeks so far this year and down 553 – or 34%! – from the peak in October.

Never before has the rig count plunged this fast this far:

Fracking Bust

What if the fracking bust, on a percentage basis, does what it did during the Financial Crisis when the oil rig count collapsed by 60% from peak to trough? It would take the rig count down to 642!

But even though rigs are shutting down like crazy, U.S. production of oil has continued to rise

Rig counts have long been used to help predict future oil and gas production. In the past week drillers idled 98 rigs, marking the 10th consecutive decline. The total U.S. rig count is down 30 percent since October, an unprecedented retreat. The theory goes that when oil rigs decline, fewer wells are drilled, less new oil is discovered, and oil production slows.

But production isn’t slowing yet. In fact, last week the U.S. pumped more crude than at any time since the 1970s. “The headline U.S. oil rig count offers little insight into the outlook for U.S. oil production growth,” Goldman Sachs analyst Damien Courvalin wrote in a Feb. 10 report.

Look, it should be obvious to anyone with even a basic knowledge of economics that the stage is being set for a massive financial meltdown.

This is just the kind of thing that can plunge us into a deflationary depression.  And when you combine this with the ongoing problems in Europe and in Asia, it is easy to see that a “perfect storm” is brewing on the horizon.

Sadly, a lot of people out there will choose not to believe until the day the crisis arrives.

By then, it will be too late to do anything about it.


This Housing Chart Destroys The Arguments Of The Economic Optimists

Chart - Public DomainDid you know that the rate of homeownership in the United States has fallen to a 20 year low?  Did you know that it has been falling consistently for an entire decade?  For the past couple of years, the economic optimists have been telling us that the economy has been getting better.  Well, if the economy really has been getting better, why does the homeownership rate keep going down?  Yes, the ultra-wealthy have received a temporary financial windfall thanks to the reckless money printing the Federal Reserve has been doing, but for most Americans economic conditions have not been improving.  This is clearly demonstrated by the housing chart that I am about to share with you.  If the economy really was healthy, more people would be getting good jobs and thus would be able to buy homes.  But instead, the homeownership rate has continued to plummet throughout the entire “Obama recovery”.  I think that this chart speaks for itself…

Homeownership Rate 2015

Of course this homeownership collapse began well before Barack Obama entered the White House.  Our economic problems are the result of decades of incredibly bad decisions.  But anyone that believes that things have “turned around” for the middle class under Barack Obama is just being delusional.

If the U.S. economy truly was in “good shape”, the percentage of Americans that own homes would not be at a 20 year low

The U.S. homeownership rate fell to the lowest in more than two decades in the fourth quarter as many would-be buyers stayed on the sidelines, giving the rental market a boost.

The share of Americans who own their homes was 64 percent in the fourth quarter, down from 64.4 percent in the previous three months, the Census Bureau said in a report. The rate was at the lowest since the second quarter of 1994, data compiled by Bloomberg show.

Rising prices and a tight supply of lower-end listings have put homes out of reach for some entry-level buyers, who also face strict mortgage standards. The share of U.S. homebuyers making their first purchase dropped in 2014 to the lowest level in almost three decades, the National Association of Realtors reported last week.

And it appears that this trend is actually accelerating.  During 2014, the rate of homeownership plummeted by a total of 1.2 percentage points for the year.  That was the largest one year decline that has ever been measured.

So why is this happening?

Well, in order to buy a home you have got to have a good job, and good jobs are in very short supply these days.

Over the past decade, the quality of the jobs in our economy has steadily declined as good jobs have been replaced by low paying jobs.  In addition, government policies are absolutely murdering small business.  At this point, small business ownership in the U.S. is hovering near record lows.

This has resulted in millions of people falling out of the middle class, and it has contributed to the growing divide between the wealthy and the rest of the country.

If our economy was working the way that it should, the middle class would be thriving.

But instead, it is being systematically destroyed.  If you doubt this, I have some statistics that I would like to share with you.  The following facts come from my previous article entitled “The Death Of The American Dream In 22 Numbers“…

#1 The Obama administration tells us that 8.69 million Americans are “officially unemployed” and that 92.90 million Americans are considered to be “not in the labor force”.  That means that more than 101 million U.S. adults do not have a job right now.

#2 One recent survey discovered that 55 percent of Americans believe that the American Dream either never existed or that it no longer exists.

#3 Considering the fact that Obama is in the White House, it is somewhat surprising that 55 percent of all Republicans still believe in the American Dream, but only 33 percent of all Democrats do.

#4 After adjusting for inflation, median household income has fallen by nearly $5,000 since 2007.

#5 After adjusting for inflation, “the median wealth figure for middle-income families” fell from $78,000 in 1983 to $63,800 in 2013.

#6 At this point, 59 percent of Americans believe that “the American dream has become impossible for most people to achieve”.

You can read the rest of that article right here.

The group that has been hit the hardest by all of this has been young adults.

Back in 2005, the homeownership rate for households headed up by someone under the age of 35 was approximately 43 percent.

Today, it has declined to about 35 percent.

From a very early age, we push our young people to go to college, and today more of them are getting secondary education than ever before.

But when they leave school, the “good jobs” that we promised them are often not there, and most of them end up entering the “real world” already loaded down with massive amounts of debt.

According to the Pew Research Center, close to four out of every ten households that are led by someone under the age of 40 are currently paying off student loan debt.

It is hard to believe, but total student loan debt in this country is now actually higher than total credit card debt.  At this point, student loan debt has reached a grand total of 1.2 trillion dollars, and that number has grown by an astounding 84 percent just since 2008.

If you are already burdened with tens of thousands (or in some cases hundreds of thousands) of dollars of debt when you get out of school and you can’t find a decent job, there is no way that you are going to be able to afford to buy a house.

So we have millions upon millions of young people that should be buying homes and starting families that are living with their parents instead.

Back in 1968, well over 50 percent of all Americans in the 18 to 31-year-old age bracket were already married and living on their own.

But today, that number is actually below 25 percent.  Instead, approximately 31 percent of all U.S. adults in the 18 to 34-year-old age bracket are currently living with their parents.

Something has fundamentally gone wrong.

Our economy is broken, and anyone that cannot see this is just being foolish.

So what is the solution?

Please feel free to share what you think by posting a comment below…

Why The Damage To The Economy Caused By The Oil Crash Is Going To Get Progressively Worse

Oil Price Crash - Public DomainWe are really starting to see the price of oil weigh very heavily on the economy and on the stock market.  On Tuesday, the Dow was down 291 points, and the primary reason for the decline was disappointing corporate sales numbers.  For example, heavy equipment manufacturer Caterpillar is blaming the “dramatic decline in the price of oil” for much lower than anticipated sales during the fourth quarter of 2014.  Even though Caterpillar is not an “energy company”, the price of oil is critical to their success.  And the same could be said about thousands of other companies.  That is why I have repeatedly stated that anyone who believes that collapsing oil prices are good for the U.S. economy is crazy.  The key to how much damage this oil collapse is going to do to our economy is not how low prices ultimately go.  Rather, the key is how long they stay at these low levels.  If the price of oil went back to $80 a barrel next week, the damage would be fairly minimal.  But if the price of oil stays at this current level for the remainder of 2015, the damage will be absolutely catastrophic.  Just think of the price of oil like a hot iron.  If you touch it for just a fraction of a second, it won’t do too much damage.  But if you press it against your skin for an hour, you will be severely damaged for the rest of your life at the very least.

So the damage that we are witnessing right now is just the very beginning unless the price of oil goes back up substantially.

When the price of oil first started crashing, most analysts focused on the impact that it would have on energy companies.  And without a doubt, quite a few of them are likely to be wiped out if things don’t change soon.

But of even greater importance is the ripple effects that the price of oil will have throughout our entire economy.  The oil price crash is not that many months old at this point, and yet big companies are already blaming it for causing significant problems.  The following is how Caterpillar explained their disappointing sales numbers on Tuesday

The recent dramatic decline in the price of oil is the most significant reason for the year-over-year decline in our sales and revenues outlook.  Current oil prices are a significant headwind for Energy & Transportation and negative for our construction business in the oil producing regions of the world.  In addition, with lower prices for copper, coal and iron ore, we’ve reduced our expectations for sales of mining equipment.  We’ve also lowered our expectations for construction equipment sales in China.  While our market position in China has improved, 2015 expectations for the construction industry in China are lower”

We also learned on Tuesday that orders for durable goods were extremely disappointing.  Many analysts believe that this is another area where the oil price crash is having an impact

Orders for business equipment unexpectedly fell in December for a fourth month, signaling a global growth slowdown is weighing on American companies. Bookings for non-military capital goods excluding aircraft dropped 0.6 percent for a second month, data from the Commerce Department showed. Demand for all durable goods − items meant to last at least three years − declined 3.4 percent, the worst performance since August.

Let’s keep an eye on the durable goods numbers in coming months.  Usually, when the economy is heading into a recession durable goods numbers start declining.

Meanwhile, a bunch of other big companies reported disappointing sales numbers on Tuesday as well.  The following summary comes from the Crux

Microsoft lost 9.9 percent as software-license sales to businesses were below forecasts. Caterpillar plunged 7.3 percent after forecasting 2015 results that trailed estimates as plunging oil prices signal lower demand from energy companies. DuPont Co. dropped 2.8 percent as a stronger dollar cuts into the chemical maker’s profit. Procter & Gamble Co. and United Technologies Corp. declined at least 2 percent after saying the surging greenback will lower full-year earnings.

What the economy could really use right now is a huge rebound in the price of oil.

Unfortunately, as I wrote about the other day, that is not likely to happen any time soon.

In fact, a top executive for Goldman Sachs recently told CNBC that he believes that the price of oil could ultimately go as low as 30 dollars a barrel.

And hedge fund managers are backing up their belief that oil is heading even lower with big money

Hedge funds boosted bearish wagers on oil to a four-year high as US supplies grew the most since 2001.

Money managers increased short positions in West Texas Intermediate crude to the highest level since September 2010 in the week ended January 20, US Commodity Futures Trading Commission data show. Net-long positions slipped for the first time in three weeks.

US crude supplies rose by 10.1 million barrels to 397.9 million in the week ended January 16 and the country will pump the most oil since 1972 this year, the Energy Information Administration says. Saudi Arabia’s King Salman, the new ruler of the world’s biggest oil exporter, said he will maintain the production policy of his predecessor despite a 58 percent drop in prices since June.

Sadly, the truth is that anyone that thought that the stock market would go up forever and that the U.S. economy would be able to avoid a major downturn indefinitely was just being delusional.

Our economy goes through cycles, and every financial bubble eventually bursts.

For example, did you know that the S&P 500 has never had seven up years in a row?  The following comes from a CNBC article that was posted on Tuesday…

Doubleline Capital founder Jeff Gundlach, more known for his bond prowess than as an equity market expert, pointed out that the S&P 500 has never had seven consecutive up years.

Of course, records are made to be broken, and each year is supposed to stand on its own.

But in a market that faces an uncertain future regarding monetary policy, the specter of a global economic slowdown, and an oil price plunge that is dampening capital investment, Gundlach’s little factoid sparked a lot of chatter at ETF.com’s InsideETFs conference in Hollywood, Florida.

Hmm – that reminds me of the seven year cycles that I discussed in my article yesterday.

If the price of oil stays this low for the rest of 2015, there is no way that we are going to avoid a recession.

If the price of oil stays this low for the rest of 2015, there is no way that we are going to avoid a stock market crash.

So let’s hope that the price of oil starts going back up.

If it doesn’t, the damage that is inflicted on our economy is going to get progressively worse.

12 Signs That The Economy Is Really Starting To Bleed Oil Patch Jobs

Oil Rig Texas - Public DomainThe gravy train is over for oil workers.  All over North America, people that felt very secure about their jobs just a few weeks ago are now getting pink slips.  There are even some people that I know personally that this has happened to.  The economy is really starting to bleed oil patch jobs, and as long as the price of oil stays down at this level the job losses are going to continue.  But this is what happens when a “boom” turns into a “bust”.  Since 2003, drilling and extraction jobs in the United States have doubled.  And these jobs typically pay very well.  It is not uncommon for oil patch workers to make well over $100,000 a year, and these are precisely the types of jobs that we cannot afford to be losing.  The middle class is struggling mightily as it is.  And just like we witnessed in 2008, oil industry layoffs usually come before a downturn in employment for the overall economy.  So if you think that it is tough to find a good job in America right now, you definitely will not like what comes next.

At one time, I encouraged those that were desperate for employment to check out states like North Dakota and Texas that were experiencing an oil boom.  Unfortunately, the tremendous expansion that we witnessed is now reversing

In states like North Dakota, Oklahoma and Texas, which have reaped the benefits of a domestic oil boom, the retrenchment is beginning.

“Drilling budgets are being slashed across the board,” said Ron Ness, president of the North Dakota Petroleum Council, which represents more than 500 companies working in the state’s Bakken oil patch.

Smaller budgets and less extraction activity means less jobs.

Often, the loss of a job in this industry can come without any warning whatsoever.  Just check out the following example from a recent Bloomberg article

The first thing oilfield geophysicist Emmanuel Osakwe noticed when he arrived back at work before 8 a.m. last month after a short vacation was all the darkened offices.

By that time of morning, the West Houston building of his oilfield services company was usually bustling with workers. A couple hours later, after a surprise call from Human Resources, Osakwe was adding to the emptiness: one of thousands of energy industry workers getting their pink slips as crude prices have plunged to less than $50 a barrel.

These jobs are not easy to replace.  If oil industry veterans go down to the local Wal-Mart to get jobs, they will end up making only a very small fraction of what they once did.  Every one of these jobs that gets lost is really going to hurt.

And at this point, the job losses in the oil industry are threatening to become an avalanche.  The following are 12 signs that the economy is really starting to bleed oil patch jobs…

#1 It is being projected that the U.S. oil rig count will decline by 15 percent in the first quarter of 2015 alone.  And when there are less rigs operating, less workers are needed so people get fired.

#2 Last week, 55 more oil rigs shut down.  That was the largest single week decline in the United States in 24 years.

#3 Oilfield services provider Baker Hughes has announced that it plans to lay off 7,000 workers.

#4 Schlumberger, a big player in the energy industry, has announced plans to get rid of 9,000 workers.

#5 Suncor Energy is eliminating 1,000 workers from their oil projects up in Canada.

#6 Halliburton’s energy industry operations have slowed down dramatically, so they gave pink slips to 1,000 workers last month.

#7 Diamondback Energy just slashed their capital expenditure budget 40 percent to just $450 million.

#8 Elevation Resources plans to cut their capital expenditure budget from $227 million to $100 million.

#9 Concho Resources says that it plans to reduce the number of rigs that it is operating from 35 to 25.

#10 Tullow Oil has reduced their exploration budget from approximately a billion dollars to about 200 million dollars.

#11 Henry Resources President Danny Campbell has announced that his company is reducing activity “by up to 40 percent“.

#12 The Federal Reserve Bank of Dallas is projecting that 140,000 jobs related to the energy industry will be lost in the state of Texas alone during 2015.

And of course it isn’t just workers that are going to suffer.

Some states are extremely dependent on oil revenues.  Just take the state of Alaska for instance.  According to one recent news report, 90 percent of the budget of Alaska comes from oil revenue…

But oil is also a revenue source in more than two dozen states, especially for about a third of them. In Alaska, where up to 90 percent of the budget is funded by oil, new Gov. Bill Walker has ordered agency heads to start identifying spending cuts.

Sadly, it looks like oil is not going to rebound any time soon.

China, the biggest user of oil in the world, just reported that economic growth expanded at the slowest pace in 24 years.  And concerns about oversupply drove the price of U.S. crude down another couple of dollars on Monday

Oil declined about 5 percent on Tuesday after the International Monetary Fund cut its 2015 global economic forecast on lower fuel demand and key producer Iran hinted prices could drop to $25 a barrel without supportive OPEC action.

U.S. crude, also known as West Texas Intermediate or WTI, settled 4.7 percent lower at $46.39 a barrel, near its intraday bottom of $46.23.

There is only one other time in history when we have seen an oil price crash of this magnitude.

That was in 2008, just before the greatest financial crisis since the Great Depression.

Many believe that we are now on the verge of the next great financial crisis.

I hope that you are getting ready.