37 Reasons Why “The Economic Recovery” Is A Giant Lie

37 Sign“If you repeat a lie often enough, people will believe it.”  Sadly, that appears to be the approach that the Obama administration and the mainstream media are taking with the U.S. economy.  They seem to believe that if they just keep telling the American people over and over that things are getting better, eventually the American people will believe that it is actually true.  On Friday, it was announced that the unemployment rate had fallen to “7 percent”, and the mainstream media responded with a mix of euphoria and jubilation.  For example, one USA Today article declared that “with today’s jobs report, one really can say that our long national post-financial crisis nightmare is over.”  But is that actually the truth?  As you will see below, if you assume that the labor force participation rate in the U.S. is at the long-term average, the unemployment rate in the United States would actually be 11.5 percent instead of 7 percent.  There has been absolutely no employment recovery.  The percentage of Americans that are actually working has stayed between 58 and 59 percent for 51 months in a row.  But most Americans don’t understand these things and they just take whatever the mainstream media tells them as the truth.

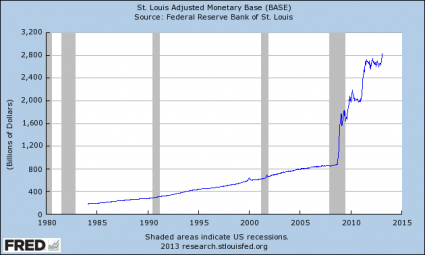
And of course the reality of the matter is that we should have seen some sort of an economic recovery by now.  Those running our system have literally been mortgaging the future in a desperate attempt to try to pump up our economic numbers.  The federal government has been on the greatest debt binge in U.S. history and the Federal Reserve has been printing money like crazed lunatics.  All of that “stimulus” should have had some positive short-term effects on the economy.

Sadly, all of those “emergency measures” do not appear to have done much at all.  The percentage of Americans that have a job has stayed remarkably flat since the end of 2009, median household income has fallen for five years in a row, and the rate of homeownership in the United States has fallen for eight years in a row.  Anyone that claims that the U.S. economy is experiencing a “recovery” is simply not telling the truth.  The following are 37 reasons why “the economic recovery” is a giant lie…

#1 The only reason that the official unemployment rate has been declining over the past couple of years is that the federal government has been pretending that millions upon millions of unemployed Americans no longer want a job and have “left the labor force”.  As Zero Hedge recently demonstrated, if the labor force participation rate returned to the long-term average of 65.8 percent, the official unemployment rate in the United States would actually be 11.5 percent instead of 7 percent.

#2 The percentage of Americans that are actually working is much lower than it used to be.  In November 2000, 64.3 percent of all working age Americans had a job.  When Barack Obama first entered the White House, 60.6 percent of all working age Americans had a job.  Today, only 58.6 percent of all working age Americans have a job.  In fact, as you can see from the chart posted below, there has been absolutely no “employment recovery” since the depths of the last recession…

Employment-Population Ratio 2013

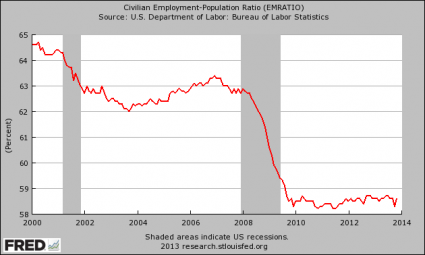
#3 The employment-population ratio has now been under 59 percent for 51 months in a row.

#4 There are 1,148,000 fewer Americans working today than there was in November 2006.  Meanwhile, our population has grown by more than 16 million people during that time frame.

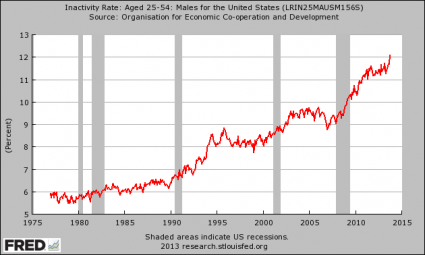
#5 The “inactivity rate” for men in their prime working years (25 to 54) has just hit a brand new all-time record high.  Does this look like an “economic recovery” to you?…

Inactivity Rate Men

#6 The number of working age Americans without a job has increased by a total of 27 million since the year 2000.

#7 In November 2007, there were 121.9 million full-time workers in the United States.  Today, there are only 116.9 million full-time workers in the United States.

#8 Middle-wage jobs accounted for 60 percent of the jobs lost during the last recession, but they have accounted for only 22 percent of the jobs created since then.

#9 Only about 47 percent of all adults in America have a full-time job at this point.

#10 The ratio of wages to corporate profits in the United States just hit a brand new all-time low.

#11 It is hard to believe, but in America today one out of every ten jobs is now filled by a temp agency.

#12 Approximately one out of every four part-time workers in America is living below the poverty line.

#13 In this economic environment, there is intense competition even for the lowest paying jobs.  Wal-Mart recently opened up two new stores in Washington D.C., and more than 23,000 people applied for just 600 positions.  That means that only about 2.6 percent of the applicants were ultimately hired.  In comparison, Harvard offers admission to 6.1 percent of their applicants.

#14 According to the Social Security Administration, 40 percent of all U.S. workers make less than $20,000 a year.

#15 When Barack Obama took office, the average duration of unemployment in this country was 19.8 weeks.  Today, it is 37.2 weeks.

#16 According to the New York Times, long-term unemployment in America is up by 213 percent since 2007.

#17 Thanks to Obama administration policies which are systematically killing off small businesses in the United States, the percentage of self-employed Americans is at an all-time low today.

#18 According to economist Tim Kane, the following is how the number of startup jobs per 1000 Americans breaks down by presidential administration

Bush Sr.: 11.3

Clinton: 11.2

Bush Jr.: 10.8

Obama: 7.8

#19 According to the U.S. Census Bureau, median household income in the United States has fallen for five years in a row.

#20 The rate of homeownership in the United States has fallen for eight years in a row.

#21 Back in 1999, 64.1 percent of all Americans were covered by employment-based health insurance.  Today, only 54.9 percent of all Americans are covered by employment-based health insurance, and thanks to Obamacare millions more Americans are now losing their health insurance plans.

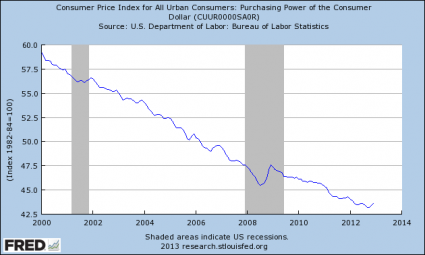
#22 As 2003 began, the average price of a gallon of regular gasoline was about $1.30.  When Barack Obama took office, the average price of a gallon of regular gasoline was $1.85.  Today, it is $3.26.

#23 Total consumer credit has risen by a whopping 22 percent over the past three years.

#24 In 2008, the total amount of student loan debt in this country was sitting at about 440 billion dollars.  Today, it has shot up to approximately a trillion dollars.

#25 Under Barack Obama, the velocity of money (a very important indicator of economic health) has plunged to a post-World War II low.

#26 Back in the year 2000, our trade deficit with China was 83 billion dollars.  In 2008, our trade deficit with China was 268 billion dollars.  Last year, it was 315 billion dollars.  That was the largest trade deficit that one nation has had with another nation in world history.

#27 The gap between the rich and the poor in the United States is at an all-time record high.

#28 Right now, 1.2 million students that attend public schools in the United States are homeless.  That is a brand new all-time record high, and that number has risen by 72 percent since the start of the last recession.

#29 When Barack Obama first entered the White House, there were about 32 million Americans on food stamps.  Today, there are more than 47 million Americans on food stamps.

#30 Right now, approximately one out of every five households in the United States is on food stamps.

#31 According to the Survey of Income and Program Participation conducted by the U.S. Census, well over 100 million Americans are enrolled in at least one welfare program run by the federal government.

#32 In 2000, the U.S. government spent 199 billion dollars on Medicaid.  In 2008, the U.S. government spent 338 billion dollars on Medicaid.  In 2012, the U.S. government spent 417 billion dollars on Medicaid, and now Obamacare is going to add tens of millions more Americans to the Medicaid rolls.

#33 In 2000, the U.S. government spent 219 billion dollars on Medicare.  In 2008, the U.S. government spent 462 billion dollars on Medicare.  In 2012, the U.S. government spent 560 billion dollars on Medicare, and that number is expected to absolutely skyrocket in the years ahead as the Baby Boomers retire.

#34 According to the most recent numbers from the U.S. Census Bureau, an all-time record high 49.2 percent of all Americans are receiving benefits from at least one government program.

#35 The U.S. government has spent an astounding 3.7 trillion dollars on welfare programs over the past five years.

#36 When Barack Obama was first elected, the U.S. debt to GDP ratio was under 70 percent.  Today, it is up to 101 percent.

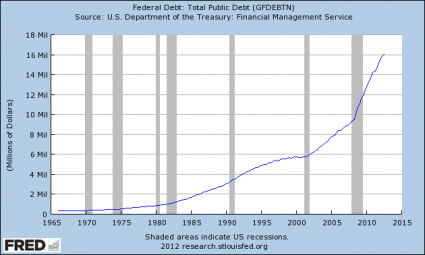
#37 The U.S. national debt is on pace to more than double during the eight years of the Obama administration.  In other words, under Barack Obama the U.S. government will accumulate more debt than it did under all of the other presidents in U.S. history combined.

Fortunately, it appears that most Americans are not buying into the propaganda.  According to a new CNN survey, the percentage of Americans that believe that the economy is getting worse far exceeds the percentage of Americans that believe that the economy is improving…

Americans views on the state of the nation are turning increasingly sour, according to a new national poll.

And a CNN/ORC International survey released Friday also indicates that less than a quarter of the public says that economic conditions are improving, while nearly four in ten say the nation’s economy is getting worse.

Forty-one percent of those questioned in the poll say things are going well in the country today, down nine percentage points from April, and the lowest that number has been in CNN polling since February 2012. Fifty-nine percent say things are going badly, up nine points from April.

So what do you think?

Do you believe that the U.S. economy is getting better or getting worse?  Please feel free to share what you think by posting a comment below…

Show This To Anyone That Believes That “Things Are Getting Better” In America

Show This To Anyone That Believes That Things Are Getting Better In AmericaHow can anyone not see that the U.S. economy is collapsing all around us?  It just astounds me when people try to tell me that “everything is just fine” and that “things are getting better” in America.  Are there people out there that are really that blind?  If you want to see the economic collapse, just open up your eyes and look around you.  By almost every economic and financial measure, the U.S. economy has been steadily declining for many years.  But most Americans are so tied into “the matrix” that they can only understand the cheerful propaganda that is endlessly being spoon-fed to them by the mainstream media.  As I have said so many times, the economic collapse is not a single event.  The economic collapse has been happening, it is is happening right now, and it will continue to happen.  Yes, there will be times when our decline will be punctuated by moments of great crisis, but that will be the exception rather than the rule.  A lot of people that write about “the economic collapse” hype it up as if it will be some huge “event” that will happen very rapidly and then once it is all over we will rebuild.  Unfortunately, that is not how the real world works.  We are living in the greatest debt bubble in the history of the world, and once it completely bursts there will be no going back to how things were before.  Right now, we are living in a “credit card economy”.  As long as we can keep borrowing more money, most people think that things are just fine.  But anyone that has lived on credit cards knows that eventually there comes a point when the game is over, and we are rapidly approaching that point as a nation.

Have you ever been there?  Have you ever desperately hoped that you could just get one more credit card or one more loan so that you could keep things going?

At first, living on credit can be a lot of fun.  You can live a much higher standard of living than you otherwise would be able to.

But inevitably a day of reckoning comes.

If the federal government and the American people were forced at this moment to live within their means, the U.S. economy would immediately plunge into a depression.

That is a 100% rock solid guarantee.

But our politicians and the mainstream media continue to perpetuate the fiction that we can live in this credit card economic fantasy land indefinitely.

And most Americans could not care less about the future.  As long as “things are good” today, they don’t really think much about what the future will hold.

As a result of our very foolish short-term thinking, we have now run up a national debt of 16.4 trillion dollars.  It is the largest debt in the history of the world, and it has gotten more than 23 times larger since Jimmy Carter first entered the White House.

The chart that you see below is a recipe for national financial suicide…

U.S. National Debt

Of course things have accelerated over the past four years.  Since Barack Obama entered the White House, the U.S. government has run a budget deficit of well over a trillion dollars every single year, and we have stolen more than 100 million dollars from our children and our grandchildren every single hour of every single day.

It is the biggest theft of all time.  What we are doing to our children and our grandchildren is beyond criminal.

And now our debt is at a level that most economists would consider terminal.  When Barack Obama first entered the White House, the U.S. debt to GDP ratio was under 70 percent.  Today, it is up to 103 percent.

We are officially in “the danger zone”.

If things really were “getting better” in America, we would not need to borrow so much money.

Our politicians are stealing from the future in order to make the present look better.  During Obama’s first term, the federal government accumulated more debt than it did under the first 42 U.S presidents combined.

That is utter insanity!

If you started paying off just the new debt that the U.S. has accumulated during the Obama administration at the rate of one dollar per second, it would take more than 184,000 years to pay it off.

So what is the solution?

Get ready to laugh.

The most prominent economic journalist in the entire country, Paul Krugman of the New York Times, recently suggested the following in an article that he wrote entitled “Kick That Can“…

Realistically, we’re not going to resolve our long-run fiscal issues any time soon, which is O.K. — not ideal, but nothing terrible will happen if we don’t fix everything this year. Meanwhile, we face the imminent threat of severe economic damage from short-term spending cuts.

So we should avoid that damage by kicking the can down the road. It’s the responsible thing to do.

You mean that we might actually do damage to the debt-fueled economic fantasy world that we are living in if we stopped stealing so much money from future generations?

Oh the humanity!

It is horrifying to think that all that one of the “top economic minds” in America can come up with is to “kick the can” down the road some more.

Unfortunately, neither Paul Krugman nor most of the American people understand that our financial system is actually designed to create government debt.

The bankers that helped create the Federal Reserve intended to permanently enslave the U.S. government to a perpetually expanding spiral of debt, and their plans worked.

At this point, the U.S. national debt is more than 5000 times larger than it was when the Federal Reserve was first created.

So why don’t the American people understand what the Federal Reserve system is doing to us?

It is because most of them are still plugged into the matrix.  A Zero Hedge article that I came across today put it beautifully…

US society in a nutshell: Chris Dorner has been around for a week and has 222 million results on Google; the Federal Reserve has been around for one hundred years and has 187 million results.

If nothing is done about our exploding debt, it is only a matter of time before we reach financial oblivion.

According to Boston University economist Laurence Kotlikoff, the U.S. government is facing a “present value difference between projected future spending and revenue” of 222 trillion dollars in the years ahead.

So how in the world are we going to come up with an extra 222 trillion dollars?

But it is not just the U.S. government that is drowning in debt.

Just check out this chart which shows the astounding growth of state and local government debt in recent years…

State And Local Government Debt

All over the United States there are state and local governments that are on the verge of bankruptcy.  Just check out what is going on in Detroit.  The only way that most of our state and local governments can keep going at this point is to also “kick the can” down the road some more.

And of course most of the rest of us are drowning in debt as well.

40 years ago, the total amount of debt in the U.S. economic system (government + business + consumer) was less than 2 trillion dollars.

Today, the total amount of debt in the U.S. economic system has grown to more than 55 trillion dollars.

Can anyone say bubble?

The good news is that U.S. GDP is now more than 12 times larger than it was 40 years ago.

The bad news is that the total amount of debt in our financial system is now more than 30 times larger than it was 40 years ago…

Total Credit Market Debt Owed

At the same time that we are going into so much debt, our ability to produce wealth continues to decline.

According to the World Bank, U.S. GDP accounted for 31.8 percent of all global economic activity in 2001.  That number dropped to 21.6 percent in 2011.  That is not just a decline – that is a nightmarish freefall.  Just check out the chart in this article.

We are becoming less competitive as a nation with each passing year.  In fact, the U.S. has fallen in the global economic competitiveness rankings compiled by the World Economic Forum for four years in a row.

Most Americans don’t understand this, but the United States buys far more from the rest of the world than they buy from us each year.  In 2012, we had a trade deficit of more than 500 billion dollars with the rest of the world.

That means that more than 500 billion dollars that could have gone to U.S. workers and U.S. businesses went out of the country instead.

So how does our country survive if hundreds of billions of dollars more is flowing out of the country than is flowing into it?

Well, to make up the shortfall we go to the countries that we sent our money to and we beg them to lend it back to us.  If that doesn’t work, we just print and borrow even more money.

Overall, the United States has run a trade deficit of more than 8 trillion dollars with the rest of the world since 1975.

That is 8 trillion dollars that could have saved U.S. businesses, paid the salaries of U.S. workers and that would have helped fund government.

But instead, our foolish policies have greatly enriched China and the oil barons of the Middle East.

Sadly, politicians from both political parties continue to boldly support the one world economic agenda of the global elite.

Just consider how destructive many of these “free trade” deals have been to our economy…

When NAFTA was pushed through Congress in 1993, the United States had a trade surplus with Mexico of 1.6 billion dollars.

By 2010, we had a trade deficit with Mexico of 61.6 billion dollars.

Back in 1985, our trade deficit with China was approximately 6 million dollars (million with a little “m”) for the entire year.

In 2012, our trade deficit with China was 315 billion dollars.  That was the largest trade deficit that one nation has had with another nation in the history of the world.

In particular, our trade with China is extremely unbalanced.  Today, U.S. consumers spend approximately 4 dollars on goods and services from China for every one dollar that Chinese consumers spend on goods and services from the United States.

But isn’t getting cheap stuff from China good?

No, because it costs us good paying jobs.

According to the Economic Policy Institute, the United States is losing half a million jobs to China every single year.

Overall, more than 56,000 manufacturing facilities in the United States have been shut down since 2001.  During 2010, manufacturing facilities in the United States were shutting down at a rate of 23 per day.  How can anyone say that “things are getting better” when our economic infrastructure is being absolutely gutted?

The truth is that there are never going to be enough jobs in America ever again, because millions of our jobs are being sent overseas and millions of our jobs are being lost to technology.

You won’t hear this on the news, but the percentage of the civilian labor force in the United States that is employed has been steadily declining every single year since 2006.

Younger workers have been hit particularly hard.  In 2007, the unemployment rate for the 20 to 29 age bracket was about 6.5 percent.  Today, the unemployment rate for that same age group is about 13 percent.

If you are under the age of 30 and you aren’t living with your parents, there is a really good chance that you are living in poverty.  If you can believe it, U.S. families that have a head of household that is under the age of 30 have a poverty rate of 37 percent.

Our economy has been steadily bleeding huge numbers of middle class jobs, and many of those jobs have been replaced by low paying jobs in recent years.

According to one study, 60 percent of the jobs lost during the last recession were mid-wage jobs, but 58 percent of the jobs created since then have been low wage jobs.

And at this point, an astounding 53 percent of all American workers make less than $30,000 a year.

Oh, but “things are getting better”, right?

Maybe if you live on Wall Street or if you are an employee of the federal government.

But for most families this economic decline has been a total nightmare.  Median household income in America has fallen for four consecutive years.  Overall, it has declined by over $4000 during that time span.

Sometimes people forget how good things were about a decade ago.  About three times as many new homes were sold in the United States in 2005 as were sold in 2012.

But we like to live in denial.

In fact, a lot of families are trying to keep up their standards of living by going into tremendous amounts of debt.

Back in 1983, the bottom 95 percent of all income earners in the United States had 62 cents of debt for every dollar that they earned.  By 2007, that figure had soared to $1.48.

Fake it until you make it, right?

But how much debt can our system possibly handle?

Total home mortgage debt in the United States is now about 5 times larger than it was just 20 years ago.

Total credit card debt in the United States is now more than 8 times larger than it was just 30 years ago.

We are a nation that is completely addicted to debt, but as the financial crisis of 2008 demonstrated, all of that debt can have horrific consequences.

As the economy has slowed in recent years, the Federal Reserve has decided that “the solution” is to recklessly print money in an attempt to get the debt spiral cranked up again.

Have they gone overboard?  You be the judge…

Monetary Base 2013

And of course this won’t have any affect on the value of the money that you have been saving up all these years right?

Wrong.

Every single dollar that you own is continually losing value…

Purchasing Power Of The Dollar

Overall, the value of the U.S. dollar has declined by more than 96 percent since the Federal Reserve was first created.

As the cost of living continues to go up and wages continue to go down, millions of American families have fallen out of the middle class and into poverty.

If you can believe it, the number of Americans on food stamps has grown from about 17 million in the year 2000 to more than 47 million today.

But “things are getting better”, right?

Incredibly, more than a million public school students in the United States are homeless.  This is the first time that has ever happened in our history.

But “things are getting better”, right?

There are now 20.2 million Americans that spend more than half of their incomes on housing.  That represents a 46 percent increase from 2001.

But “things are getting better”, right?

In 1999, 64.1 percent of all Americans were covered by employment-based health insurance.  Today, only 55.1 percent are covered by employment-based health insurance.

But “things are getting better”, right?

Today, more Americans than ever have found themselves forced to turn to the federal government for help.

Overall, the federal government runs nearly 80 different “means-tested welfare programs”, and at this point more than 100 million Americans are enrolled in at least one of them.

According to the U.S. Census Bureau, 49 percent of all Americans live in a home that receives direct monetary benefits from the federal government.  Back in 1983, less than a third of all Americans lived in a home that received direct monetary benefits from the federal government.

So is it a good sign or a bad sign that the percentage of Americans that are financially dependent on the federal government is at an all-time high?

And in future years the number of Americans that are receiving benefits from the federal government is projected to absolutely skyrocket.

Back in 1965, only one out of every 50 Americans was on Medicaid.  Today, one out of every 6 Americans is on Medicaid, and things are about to get a whole lot worse.  It is being projected that Obamacare will add 16 million more Americans to the Medicaid rolls.

If you take a look at Medicare, things are very more sobering.

As I wrote recently, it is being projected that the number of Americans on Medicare will grow from 50.7 million in 2012 to 73.2 million in 2025.

At this point, Medicare is facing unfunded liabilities of more than 38 trillion dollars over the next 75 years.  That comes to approximately $328,404 for every single household in the United States.

Are you ready to contribute your share?

Social Security is a complete and total nightmare as well.

Right now, there are approximately 56 million Americans collecting Social Security benefits.

By 2035, that number is projected to soar to an astounding 91 million.

Overall, the Social Security system is facing a 134 trillion dollar shortfall over the next 75 years.

Oh, but don’t worry because “things are getting better”, right?

I honestly do not know how anyone can look at the numbers above and come to the conclusion that the economy is in good shape.

We have accumulated the largest mountain of debt in the history of the world, our economic infrastructure is being gutted, we are bleeding good jobs, government dependence is at an all-time high and we are getting poorer as a nation with each passing day.

But other than that, everything is rainbows and lollipops, right?

If you want to see the economic collapse, just open up your eyes.

And if dramatic changes are not made quickly, things are going to get much, much worse from here.

Please share this article with as many people as possible.  Time is quickly running out and there are a whole lot of people out there that we need to wake up while we still can.

The Economic Collapse Is Happening