12 Signs That An Imminent Global Financial Crash Has Become Even More Likely

Time Spinning Skyline - Public Domain
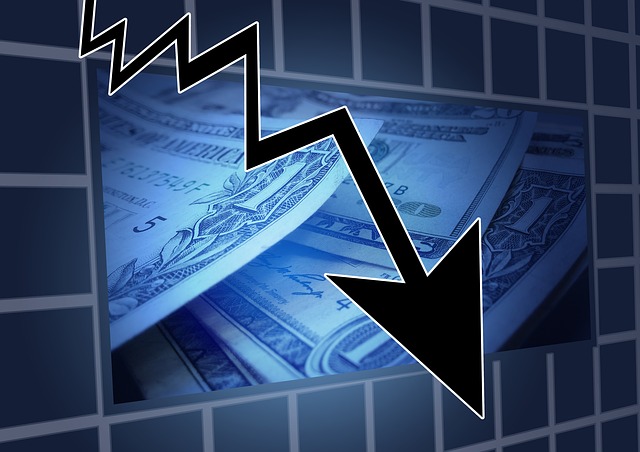
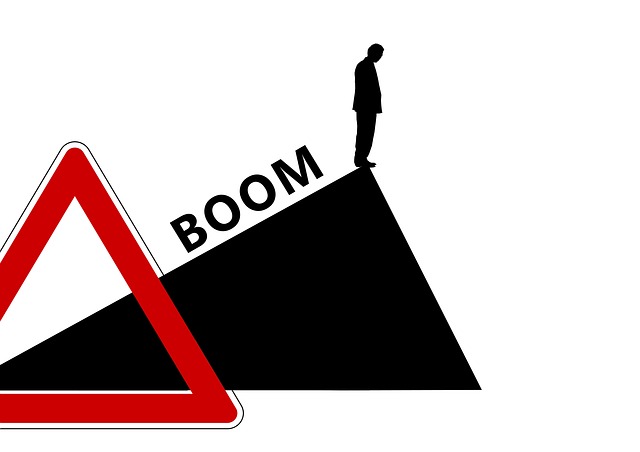
Did you see what just happened?  The devaluation of the yuan by China triggered the largest one day drop for that currency in the modern era.  This caused other global currencies to crash relative to the U.S. dollar, the price of oil hit a six year low, and stock markets all over the world were rattled.  The Dow fell 212 points on Tuesday, and Apple stock plummeted another 5 percent.  As we hurtle toward the absolutely critical months of September and October, the unraveling of the global financial system is beginning to accelerate.  At this point, it is not going to take very much to push us into a full-blown worldwide financial crisis.  The following are 12 signs that indicate that a global financial crash has become even more likely after the events of the past few days…

#1 The devaluation of the yuan on Tuesday took virtually the entire planet by surprise (and not in a good way).  The following comes from Reuters

China’s 2 percent devaluation of the yuan on Tuesday pushed the U.S. dollar higher and hit Wall Street and other global equity markets as it raised fears of a new round of currency wars and fed worries about slowing Chinese economic growth.

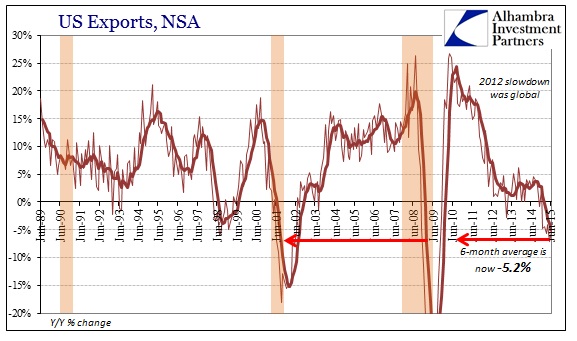
#2 One of the big reasons why China devalued the yuan was to try to boost exports.  China’s exports declined 8.3 percent in July, and global trade overall is falling at a pace that we haven’t seen since the last recession.

#3 Now that the Chinese have devalued their currency, other nations that rely on exports are indicating that they might do the same thing.  If you scan the big financial news sites, it seems like the term “currency war” is now being bandied about quite a bit.

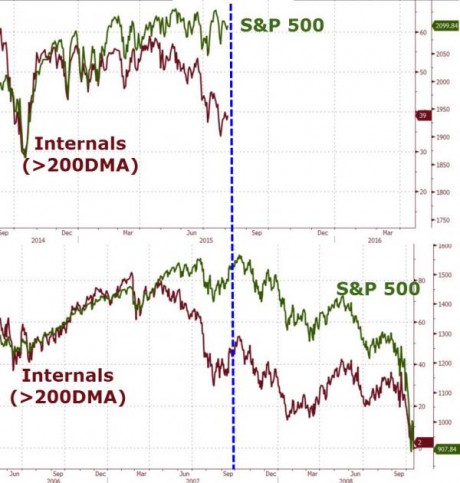
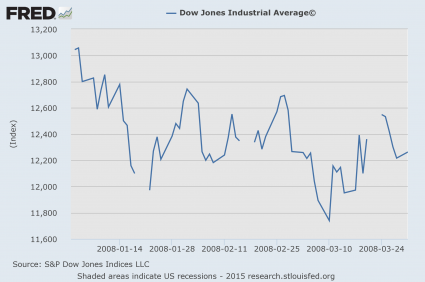
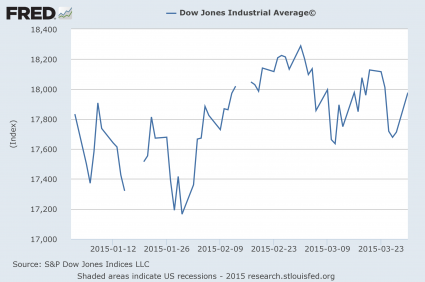
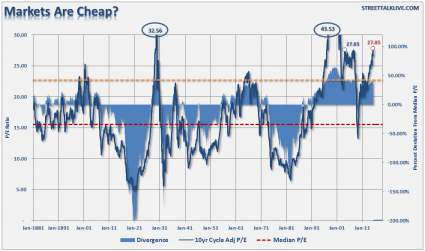
#4 This is the very first time that the 50 day moving average for the Dow has moved below the 200 day moving average in the last four years. This is known as a “death cross”, and it is a very troubling sign.  We are just about at the point where all of the most common technical signals that investors typically use to make investment decisions will be screaming “sell”.

#5 The price of oil just closed at a brand new six year low.  When the price of oil started to decline back in late 2014, a whole lot of people were proclaiming that this would be a good thing for the U.S. economy.  Now we can see just how wrong they were.

At this point, the price of oil has already fallen to a level that is going to be absolutely nightmarish for the global economy if it stays here.  Just consider what Jeff Gundlach had to say about this in December…

And back in December 2014, “Bond King” Jeff Gundlach had a serious warning for the world if oil prices got to $40 a barrel.

“I hope it does not go to $40,” Gundlach said in a presentation, “because then something is very, very wrong with the world, not just the economy. The geopolitical consequences could be — to put it bluntly — terrifying.”

#6 This week we learned that OPEC has been pumping more oil than we thought, and it is being projected that this could cause the price of oil to plunge into the 30s

Increased pumping by OPEC as Chinese demand appears to be slackening could drive oil to the lowest prices since the peak of the financial crisis.

West Texas Intermediate crude futures skidded through the year’s lows and looked set to break into the $30s-per-barrel range after the Organization of the Petroleum Exporting Countries admitted to more pumping and China devalued its currency, sending ripples through global markets.

#7 In a recent article, I explained that the collapse in commodity prices that we are witnessing right now is eerily similar to what we witnessed just before the stock market crash of 2008.  On Tuesday, things got even worse for commodities as the price of copper closed at a brand new six year low.

#8 The South American debt crisis of 2015 continues to intensify.  Brazil’s government bonds have been downgraded to just one level above junk status, and the approval rating of Brazil’s president has fallen into the single digits.

#9 Just before the financial crisis of 2008, a surging U.S. dollar put an extraordinary amount of stress on emerging markets.  Now that is happening again.  Emerging market stocks just hit a brand new four year low on Tuesday thanks to the stunt that China just pulled.

#10 Things are not so great in the United States either.  The ratio of wholesale inventories to sales in the United States just hit the highest level since the last recession.  What that means is that there is a whole lot of stuff sitting in warehouses out there that is waiting to be sold in an economy that is rapidly slowing down.

#11 Speaking of slowing down, the growth of consumer spending in the United States has just plummeted to multi-year lows.

#12 Deep inside, most of us can feel what is coming.  According to Gallup, the number of Americans that believe that the economy is getting worse is almost 50 percent higher than the number of Americans that believe that the economy is getting better.

Things are lining up perfectly for a global financial crisis and a major recession beginning in the fall and winter of 2015.

But just because things look like they will happen a certain way does not necessarily mean that they will.  All it takes is a single “event” of some sort to change everything.

So what do you believe will happen in the months ahead?

Please feel free to join the discussion by posting a comment below…

The Dow Has Already Fallen Nearly 900 Points From The Peak Of The Market

Financial Crisis Stocks - Public DomainIn an eerie repeat of what we witnessed in 2008, U.S. stocks are steadily sliding throughout the summer as we head toward the month of September.  From August 1st, 2008 to September 1st, 2008 the Dow fell by nearly 700 points.  And of course we all remember what happened the following month.  Right now, we are watching a similar thing happen.  The Dow has plummeted nearly 700 points since July 16th, and it is down nearly 900 points from the peak of the market back in May.  At this point the Dow has now fallen for six days in a row and eleven of the last thirteen.  Of course most of the talking heads on television are still insisting that everything is going to be just fine and that a repeat of 2008 is not possible.  So what do you think?  Should we trust them?

Personally, I find that I put a lot more faith in cold, hard numbers than in what the talking heads on television have to say.  And at this moment, the cold, hard numbers are telling us that another financial crisis in imminent.

This is one of the reasons why I am such a fan of Zero Hedge.  Nobody stays on top of the hard financial numbers like Zero Hedge does.  And according to Zero Hedge, market internals are absolutely screaming that a U.S. stock market crash is right around the corner

In early 2007, market internals began to weaken dramatically. Talking heads and asset gatherers said fears were overblown, risk was contained, Fed has it under control, stay the course. Six months later, the equity markets began to collapse and then accelerated lower. Today, in an eery case of deja vu all over again, it has been six months now since US equity market internals began to decouple from the manipulated index levels that manufacture wealth and happiness across America… what would you do?

Here is the chart that immediately followed that paragraph.  As you can see, we are repeating the exact same pattern that we witnessed back during the last financial crisis…

Internals - Zero Hedge chart

Meanwhile, the second largest stock market in the world is already crashing.  The Chinese have spent approximately 1.3 trillion dollars propping up stocks in China, but they just continue to fall.  They were down again on Wednesday night, and nobody is quite sure when the carnage is going to end.

And remember, Chinese stocks started to crash before U.S. stocks did in 2008 as well.

Another eerie similarity to 2008 is the behavior of oil.  In the summer of 2008, the price of oil crashed hard, and then a stock crash followed a couple of months later.

Well, guess what?

The price of oil is crashing hard once again.  The following comes from CNBC

Oil set multi-month lows on Thursday as investors and traders sought clues about the market’s next bottom after a large drop in U.S. crude inventories failed to boost prices.

A bigger-than-expected build in U.S. gasoline stockpiles last week proved more important to investors than crude storage numbers that came in three times below forecast on Wednesday.

U.S. crude was down 50 cents at $44.65 a barrel at 1:30 p.m. EDT (1730 GMT), after touching a 4½ month bottom at $44.20.

Why can’t more people see the signs?

They are so obvious.

We are also getting indications that the real economy is starting to be affected by all of this chaos.  The mainstream media has been very quiet about this, but the number of job cuts just hit a four year high

Challenger, Gray & Christmas has released its monthly job cuts for July, and it is ugly. The 105,696 job cuts was the highest number since 2011. To put this in perspective, the July job cuts total is a whopping 136% higher than the 44,842 job cuts reported in June, as well as 125% higher than the in same report a year ago.

The July report showed that the last time more than 100,000 job cuts were announced was back in September 2011, when there were some 115,730 layoffs.

Another bad trend is that July’s surge now brings the year-to-date job cuts up to a total of 393,368. That is 34% higher than the run rate for the same period in 2014.

If alarm bells are going off in your head right now, that is good, because they should be.

A 34 percent increase in job cuts is not a good thing.

Of course it would probably help if the Obama administration was not bringing in far more immigrant workers than the limits that have been officially set by Congress.  Just check out these numbers

In written responses to the Senate Judiciary Immigration and the National Interest Subcommittee Republicans obtained by Breitbart News, U.S. Citizenship and Immigration Services reveal that the Obama administration has been approving work authorizations for immigrants beyond admission limits and for some categories of immigrants that Congress never intended to work in the U.S.

Beyond those limits each year, these new and renewed work permit approvals amounted to about 1.23 million in fiscal year 2009, 1.08 million in FY 2010, 970,277 in FY 2011, 1.24 million in FY 2012, 1.68 million in FY 2013 and 1.24 million in FY 2014.

Also, this is the first time that imports and exports have both been declining on a year over year basis since the last recession.  Just check out this chart and this chart.

When imports and exports are both falling, that means that economic activity is slowing down.  And we are seeing a similar thing happen all over the planet.  At this point, global trade has fallen by a total of about 2 percent over the past six months.

Are you starting to get the picture?

Just like in the summer of 2008, global economic activity is diminishing and things in the financial world are lining up in textbook fashion for a major crisis.

But for those that are not convinced by now, there is not that much more that I can do.  I could keep throwing out numbers and charts and graphs, but if people refuse to see the truth they simply will not see it.

Less than a month from now, we will officially be in the danger zone.

September is coming, and I truly hope that you are already prepared for it.

8 Financial Experts That Are Warning That A Great Financial Crisis Is Imminent

Earth Clock Pocketwatch - Public DomainWill there be a financial collapse in the United States before the end of 2015?  An increasing number of respected financial experts are now warning that we are right on the verge of another great economic crisis.  Of course that doesn’t mean that it will happen.  Experts have been wrong before.  But without a doubt, red flags are popping up all over the place and things are lining up in textbook fashion for a new financial crisis.  As I write this article, U.S. stocks have declined four days in a row, the Dow is down more than 750 points from the peak of the market in May, and one out of every five U.S. stocks is already in a bear market.  I fully expect the next several months to be extremely chaotic, and I am far from alone.  The following are 8 financial experts that are warning that a great financial crisis is imminent…

#1 During one recent interview, Doug Casey stated that we are heading for “a catastrophe of historic proportions”

“With these stupid governments printing trillions and trillions of new currency units,” says investor Doug Casey, “it’s building up to a catastrophe of historic proportions.”

Doug Casey, a wildly successful investor who’s the head of the outfit Casey Research, is predicting doom and gloom for the global economy.

“I wouldn’t keep significant capital in banks,” he told Reason magazine Editor-in-Chief Matt Welch. “Most of the banks in the world are bankrupt.”

#2 Bill Fleckenstein is warning that U.S. markets could be headed for calamity in the coming months

Noted short seller Bill Fleckenstein, who correctly predicted the financial crisis in 2007, says he is one step closer to opening up a short-focused fund for the first time since 2009. In the meantime, Fleckenstein says the entire market could be heading for calamity in the coming months.

The market is uniquely crash-prone,” Fleckenstein told CNBC’s “Fast Money” this week. “I think the market is very brittle because of high-frequency trading, ETFs, a lot of momentum investors. I don’t think there’s going to be any painless back door.”

#3 Richard Russell believes that the bear market that is coming “will tear apart the current economic system”

From my standpoint, this is the strangest period that I have gone through since the 1940s. The Industrials are declining faster than the Transports. If this continues, at some point the Industrials will touch the Transports. When that happens, I believe a bear market will be signaled, as both Industrials and Transports accelerate on the downside.

I expect a brief period of higher prices which will draw in the amateurish retail public. This brief breather will be followed by an historic bear market that will tear apart the current economic system.

#4 Larry Edelson is “100% confident” that a global financial crisis will be triggered “within the next few months”…

On October 7, 2015, the first economic supercycle since 1929 will trigger a global financial crisis of epic proportions. It will bring Europe, Japan and the United States to their knees, sending nearly one billion human beings on a roller-coaster ride through hell for the next five years. A ride like no generation has ever seen. I am 100% confident it will hit within the next few months.”

#5 John Hussman is warning that market conditions such as we are observing right now have only happened at a few key moments throughout our history

In any event, this is no time to be on autopilot. Look at the data, and you’ll realize that our present concerns are not hyperbole or exaggeration. We simply have not observed the market conditions we observe today except in a handful of instances in market history, and they have typically ended quite badly (see When You Look Back on This Moment in History and All Their Eggs in Janet’s Basket for a more extended discussion of current conditions). In my view, this is one of the most important moments in a generation to examine all of your risk exposures, the extent to which you believe historical evidence is informative, your tolerance for loss, your comfort or discomfort with missing out on potential rallies even in a wickedly overvalued market, and your true investment horizon.

#6 During a recent appearance on CNBC, Marc Faber suggested that U.S. stocks could soon plummet by up to 40 percent

The U.S. stock market could “easily” drop 20 percent to 40 percent, closely followed contrarian Marc Faber said Wednesday—citing a host of factors including the growing list of companies trading below their 200-day moving average.

In recent days, “there were [also] more declining than advancing stocks, and the list of 12-month new lows was very high on Friday,” the publisher of The Gloom, Boom & Doom Report told CNBC’s “Squawk Box.”

“It shows you a lot of stocks are already declining.”

#7 In a previous article, I noted that Henry Blodget of Business Insider is suggesting that U.S. stocks could soon drop by up to 50 percent

As regular readers know, for the past ~21 months I have been worrying out loud about US stock prices. Specifically, I have suggested that a decline of 30% to 50% would not be a surprise.

I haven’t predicted a crash. But I have said clearly that I think stocks will deliver returns that are way below average for the next seven to 10 years. And I certainly won’t be surprised to see stocks crash. So don’t say no one warned you!

#8 Egon von Greyerz is even more bearish.  He recently told King World News that we are heading for “the most historic wealth destruction ever”…

Eric, there are now more problem areas in the world, rather than stable situations. No major nation in the West can repay its debts. The same is true for Japan and most of the emerging markets. Europe is a failed experiment for socialism and deficit spending. China is a massive bubble, in terms of its stock markets, property markets and shadow banking system. Japan is also a basket case and the U.S. is the most indebted country in the world and has lived above its means for over 50 years.

So we will see twin $200 trillion debt and $1.5 quadrillion derivatives implosions. That will lead to the most historic wealth destruction ever in global stock, with bond and property markets declining at least 75 – 95 percent. World trade will also contract dramatically and we will see massive hardship across the globe.

So are they right?

We’ll know soon.

And of course they are not the only ones with a bad feeling about what is ahead.  A recent WSJ/NBC News survey found that 65 percent of all Americans believe that the country is currently on the wrong track.

Also, Gallup’s Economic Confidence Index just plunged to the lowest level that we have seen so far in 2015

Americans confidence in the US economy dropped sharply in July to its lowest level in 2015, according to a new US Economic Confidence Index rating released by Gallup on Tuesday.

“Gallup’s Economic Confidence Index declined to an average of —12 in July from —8 in June. This is the lowest monthly average since last October, and is a noticeable departure from the +3 average in January,” the polling company said.

Gallup said that “unsettled economic” conditions, including tumult in Chinese markets and uncertainty in Europe over a Greek debt deal, as well as US stock market volatility are factors driving lower confidence in the US economy.

These “bad feelings” are also reflected in the hard economic data.  U.S. consumer spending has declined for three months in a row, and U.S. factory orders have fallen for eight months in a row.

The numbers are screaming that we are heading for another major recession.

But could it be possible that this is just another false alarm?

Could it be possible that the blind optimists are right and that everything will work out okay somehow?

Please feel free to join the discussion by posting a comment below…

Crashing: Apple, Twitter, Oil, Commodities, Greek Stocks, Chinese Stocks

Crash - Public DomainThe month of August sure has started off with a bang.  Tech stocks are crashing, oil is crashing, industrial commodities are crashing, Greek stocks crashed the moment that the Greek stock market reopened for trading, and Chinese stocks continue to crash.  At this point we have not seen a broad crash of U.S. stocks yet, but it is important to note that the Dow is already down more than 700 points from the peak in May.  If it continues to slide like it has in recent days, it won’t be too long before we will officially reach “correction” territory.  Just a few days ago, I described August as a “pivotal month“, and so far that is indeed turning out to be the case.

A full-blown financial crisis has not erupted yet, but we are well on the way.  In this article, I want to look at a few of the “crashes” that are already happening…

Apple

This is more of a “correction” than a “crash”, but it is very noteworthy because it is happening to one of the most important U.S. stocks of all.  The price of Apple stock has already broken through the 200 day moving average, and at this point it is down nearly 11 percent from the peak

Shares of Apple are down 10.9% from their highest point in a year — which places the stock squarely in what’s considered to be a correction. The unofficial definition of a correction is a 10% or greater drop from a recent high. Shares of Apple hit a 52-week (and all-time) high on $134.54 on April 28.

Twitter

If you want to see a real crash, just look at what is happening to Twitter.  The stock was down close to 6 percent on Monday, and overall it has fallen 58 percent since early last year.  The price of Twitter stock has never been lower than it is right now, and many investors are very apprehensive about what comes next…

Twitter shares hit a record low on Monday, closing down nearly 6% to $29.27.

That is 58% below their peak in January 2014.

Shares have fallen to their lowest point since the company went public in November 2014 weighed down by negative comments on growth from company executives that rattled investors. Its previous low was $30.50 in May 2014 as concerns over slowing user growth began to take a toll.

Of course there are tech companies that are in far worse shape than Twitter.  For example, just consider what is happening to Yelp.  Shares of Yelp recently plummeted 25 percent in a single day, and they are down about 70 percent over the past year.

Greece

The Greek government was quite eager to reopen their stock market this week.

Perhaps they should have waited longer.

On Monday, we witnessed the greatest stock bloodbath in Greek history.  The following comes from Reuters

Greece’s stock market closed with heavy losses on Monday after a five-week shutdown brought on by fears that the country was about to be dumped from the euro zone.

Bank shares plummeted 30 percent before loss limits kicked in to stop investors selling any more. The main Athens stock index .ATG ended down 16.2 percent, recovering slightly after plunging nearly 23 percent at the open.

It was the worst daily performance since at least 1985 when modern records began, including a 15 percent fall when Wall Street crashed in 1987.

Puerto Rico

Things also continue to unravel for “America’s Greece”.  On Monday, a U.S. commonwealth territory defaulted on debt for the first time ever

Puerto Rico’s Government Development Bank announced Monday that it was only able to make a partial payment on its Public Finance Corporation (PFC) debt service due over the weekend.

In response to the non-payment of the full service, Moody’s said it viewed the situation as a default.

“Due to the lack of appropriated funds for this fiscal year the entirety of the PFC payment was not made today (the first business day after the Saturday deadline),” GDB President Melba Acosta-Febo said in a statement. This was a decision that reflects the serious concerns about the Commonwealth’s liquidity in combination with the balance of obligations to our creditors and the equally important obligations to the people of Puerto Rico to ensure the essential services they deserve are maintained.”

China

As I noted the other day, the Shanghai Composite Index declined 13.4 percent during the month of July.  It was the worst month for stocks in China since October 2009.

On Monday, Chinese stocks were down another 1.11 percent.  Since closing at 5,166.35 on June 12th, the Shanghai Composite Index has fallen precipitously.  As I write this, it is sitting at just 3622.86.

Oil

In the months prior to the financial crisis of 2008, the price of oil crashed hard.

Now it is happening again.

In July, the price of oil plunged 21 percent.  That was the worst monthly decline that we have seen since October 2008.

And on Monday, the oil crash continued.  The following comes from Business Insider

On Monday in New York, West Texas Intermediate (WTI) crude fell more than 4% and slipped below $45 per barrel, a level it hasn’t touched since March.

Brent crude oil, the international benchmark that joined WTI in a bear market last week, dropped more than 4%, below $50 per barrel for the first time since January.

Commodities

In recent weeks, I have been writing over and over about industrial commodities.  This is yet another striking similarity to the last financial crisis.  In 2008, they started crashing before stocks did, and now it is happening again

We see the Bloomberg Commodities index now at a 13-year low. Copper is down 28 percent for the year, tin is down 30 percent, and nickel is down 44 percent.

This is a giant red flag that indicates that we are plunging into a deflationary cycle.  When global economic activity slows down, so does demand for industrial commodities.  I don’t understand why more people can’t see this.

I have been warning that a deflationary downturn was coming for a very long time, and so have others.  For instance, just consider the following excerpt from a recent article by Nicole Foss

Our consistent theme here at the Automatic Earth since its inception has been that we are facing a very powerful deflationary depression, following on from the bursting of an epic financial bubble. What we have witnessed in our three decades of expansion and inflation is nothing short of a monetary supernova, and that period has been the just culmination of a much larger upward trend going back many decades at least. We have lived through a credit hyper-expansion for the record books, with an unprecedented generation of excess claims to underlying real wealth. In doing so we have created the largest financial departure from reality in human history.

Bubbles are not new – humanity has experienced them periodically going all the way back to antiquity – but the novel aspect of this one, apart from its scale, is its occurrence at a point when we have reached or are reaching so many limits on a global scale. The retrenchment we are about to experience as this bubble bursts is also set to be unprecedented, given that the scale of a bust is predictably proportionate to the scale of the excesses during the boom that precedes it. We have built an incredibly complex economic system, but despite its robust appearance it is over-extended, brittle and fragile after decades of fueling its continued expansion by feeding on its own substance.

Things continue to line up in textbook fashion for a major financial crisis during the fall and winter.

I hope that you are prepared for what comes next.

The Stock Market Will Start To Fall In July? The Dow Plummeted More Than 500 Points Last Week

Falling - Public DomainWas last week a preview of things to come? There are quite a few people out there that believe that the stock market would begin to decline in July, and that appears to be precisely what is happening. Last week, the Dow Jones Industrial Average fell by more than 530 points. It was the biggest one week decline that we have seen so far in 2015, and some are suggesting that this could only be just the beginning. By just about any measurement that you might want to use, the stock market is overvalued. But we have been in this bubble for so long that many people have come to believe that this is “the new normal”. In fact, earlier today someone that I know dropped me a line and suggested that our financial overlords may be able to use the tools at their disposal to get this current bubble to persist indefinitely. Unfortunately, the truth is that no financial bubble ever lasts forever, and right now some very alarming things are starting to happen behind the scenes. Over the past couple of weeks, the smart money has been dumping stocks like crazy, and the lack of liquidity in the bond markets is beginning to become acute.  Could it be possible that another great financial crisis is just around the corner?

Last week took a lot of investors by surprise. The following is how Zero Hedge summarized the carnage…

-Russell 2000 -3.1% – worst week since Oct 2014 (Bullard)
-Dow -2.8% – worst week since Dec 2014
-S&P -2.1% – worst week since Jan 2015
-Trannies -2.8% – worst week since Mar 2015
-Nasdaq -2.2% – worst week since Mar 2015

The talking heads on television were not quite sure what to make of this sudden downturn. On CNBC, analysts mainly blamed the usual suspects…

“I think the market’s very much concerned about the commodity (decline),” said John Lonski, chief economist at Moody’s. “The contraction in China manufacturing activity is gaining momentum and the credit market has yet to signal that rates are not about to go higher.”

He also noted a surprising decline in new home sales and continued lack of revenue growth in earnings. Nearly all the commodities are in a bear market and gold and crude settled at lows Friday.

“You’ve got some major growth concerns and that is what’s weighing on investors minds,” said Peter Boockvar, chief market strategist at The Lindsey Group.

And without a doubt, there are some new numbers that are deeply troubling for Wall Street. For example, it is being projected that S&P 500 companies will collectively report a 2.2 percent decline in earnings for the second quarter of 2015. If this comes to pass, it will be the first drop that we have seen since the third quarter of 2012.

The biggest reason for this decline in earnings is the implosion of U.S. energy companies due to the crash in oil prices. The following comes from CNBC

Thanks to a collapse in the price of oil, the energy sector is slated to report a monster 54 percent drop in earnings and 28 percent swoon in revenue, compared to the second quarter in the year prior.

Hmm – unlike what so many others were saying initially, it turns out that the oil crash is bad for the U.S. economy after all.

But just like at this time of the year in 2008, most people fully expect that everything is going to be just fine. So many of the exact same patterns that we witnessed the last time around are playing out once again, and yet most of the “experts” refuse to see what is happening right in front of their eyes.

When things crash this time, it won’t just be stocks that collapse. As I have been writing about so frequently, we are also headed for an implosion of the bond markets as well. The following comes from Dr. David Eifrig

In the U.S. Treasury securities market, financial-services giant JPMorgan Chase estimates that five years ago, you could move about $280 million worth of Treasury securities before your trades moved the market’s price. Now, that’s down to $80 million… a decline of more than 70%.

When a panic sets in, reduced liquidity can cause big swings in market prices.

There is that word “liquidity” again. This is something that I have repeatedly been taking about. Just check out this article from a little over a month ago. A bond is only worth what someone else is willing to pay for it, and if the market runs out of buyers that can cause seismic shifts in price very rapidly. Here is more from Eifrig

In a run-of-the-mill bear market, you just have a downward trend… When enough investors are selling bonds, it drives down prices. Falling prices lead more investors to start selling. We see that all the time.

A liquidity crisis goes even further. It’s like a classic run on a bank… Without sufficient liquidity, the sellers don’t just see lower prices… they see no prices. Since no one wants to buy bonds at this particular time, the price for them effectively becomes zero.

There has been a lot of speculation about what will happen in the second half of 2015.

We only have a little over five months to go in the year, so it won’t be too long before we see who was right and who was wrong.

Our perceptions of the future are very much shaped by our worldviews. All the time, I get “Obamabots” that come to my website and leave comments on my articles telling me how Barack Obama has “turned the economy around” and has set the stage for a new era of prosperity in America.

Despite all the evidence to the contrary, they choose to believe that things are in great shape because that is what they want to believe. Just check out the results from one recent survey

While 55 percent of Democrats reported feeling positive about the economy, for example, just 25 percent of Republicans felt the same from March 25 to May 27.

When asked if they thought the economy would improve over the next 12 months, 53 percent of Democrats said yes. Only 23 percent of the Republicans in the survey agreed.

The same perception gap extends to the far future, with 41 percent of Democrats believing that the next generation will be better off than their parents, and just 24 percent of Republicans saying the same.

To me, those numbers are quite striking.

Many Democrats very much want to believe that things are getting better because Barack Obama is in the White House.

Many Republicans very much want to believe that things are totally falling apart because Barack Obama is in the White House.

So who is right and who is wrong?

Please feel free to share what you think by posting a comment below…

Stocks Began Falling Right At This Time Of The Year Just Prior To The Last Financial Crisis

Stock Market Crash Bear - Public DomainHave you heard of the saying “sell in May and go away”?  Traditionally, the period from May through October has been a time of weakness for stocks.  In fact, on average stocks hit their lowest point of the year on October 27th.  And most people don’t remember this, but the Dow Jones Industrial Average actually began plunging right at this time of the year just prior to the financial crisis of 2008.  Most people do remember the huge stock crash that happened in the fall of that year, but the market actually started to slide in May.  Throughout the first four and a half months of 2008, stocks moved up and down in a fairly narrow range, and the Dow closed at a short-term peak of 13,028.16 on May 19th.  From there it was all downhill for the rest of the year.  So will a similar thing happen in 2015 as we approach the next great financial crisis?  Since March 20th, the Dow Jones Transportation Average has already fallen by almost 800 points.  So will the Dow Jones Industrial Average soon follow?  Well, only time will tell, but the Dow was down 190 points on Tuesday.  Signs of trouble are popping up all over the place, and the “smart money” is getting out while the getting is good.

The chart that I have posted below shows how the Dow Jones Industrial Average performed during 2008.  As you can see, stocks began plummeting long before the financial crisis in the fall.  From May 19th through early July, the Dow fell by about 2,000 points.  Should we expect to see a similar pattern this summer?…

Dow Jones Industrial Average 2008

Like I stated earlier in this article, red flags and warning signs are starting to pop up all over the place.  The following are just a few of the trouble signs that we have seen this week…

-On Tuesday, the VIX (a closely watched measure of market volatility) jumped by the highest percentage that we have seen so far in 2015.  As I have explained so often before, markets tend to go up in calm markets and they tend to go down in volatile markets.  So the fact that volatility is on the rise is not a good sign.

-The U.S. dollar index is surging again.  In fact, we just witnessed the largest seven day rise in the U.S. dollar index since the collapse of Lehman Brothers.  This is another indication that big trouble is ahead.  For much more on this, please see my previous article entitled “Guess What Happened The Last Time The U.S. Dollar Skyrocketed In Value Like This?…

-Thanks to the ongoing Greek crisis, the euro is falling again.  It just hit a fresh one-month low, and if I am right it is going to go quite a bit lower as the European financial crisis intensifies.

-In the U.S., orders for durable goods have fallen year over year for four months in a row.  When orders for durable goods start going negative for a few months, it is usually a signal that we are entering a recession.

-After rebounding a little bit, the price of crude oil is falling again.  It just hit a new one-month low, and the number of oil rigs in operation has declined for 24 weeks in a row.  Once again, this is highly reminiscent of what happened back in 2008.

-Unfortunately, it isn’t just oil that is declining.  A whole host of other commodity prices are going down right now as well.  This happened just prior to the financial crisis of 2008, and it is a sign that we are heading into a deflationary economic slowdown.

The reason why I talk so much about what happened the last time around is that we should be able to learn from it.

Looking back, there were so many warning signs leading up to the financial crisis of 2008 but most people totally missed them.  Now, so many of those exact same signs are appearing once again, but they are being ignored.

Only this time the global financial system is in far worse shape than it was back in 2008.  Debt levels all over the planet have absolutely exploded over the past seven years, and the debt to GDP ratio for the entire world is now up to a mind blowing 286 percent.  In the United States, our national debt has approximately doubled since just prior to the last recession, and at this point it is mathematically impossible to pay it off.  We are in the midst of the greatest stock market bubble of all time, the greatest bond bubble of all time (76 trillion dollars) and the greatest derivatives bubble of all time.  Anyone that cannot see the trouble that is approaching is willingly blind.

In the western world, we have extremely short attention spans and we suffer deeply from something called “normalcy bias”.  The following is how “normalcy bias” is defined by Wikipedia

The normalcy bias, or normality bias, is a mental state people enter when facing a disaster. It causes people to underestimate both the possibility of a disaster and its possible effects. This may result in situations where people fail to adequately prepare for a disaster, and on a larger scale, the failure of governments to include the populace in its disaster preparations.

The assumption that is made in the case of the normalcy bias is that since a disaster never has occurred then it never will occur. It can result in the inability of people to cope with a disaster once it occurs. People with a normalcy bias have difficulties reacting to something they have not experienced before. People also tend to interpret warnings in the most optimistic way possible, seizing on any ambiguities to infer a less serious situation.

That is such a perfect description of what is happening in the western world today.  But just because things have always been a certain way in our past does not mean that they will continue to be that way in the future.  A great economic storm is rapidly approaching, and the signs of the times are all around us.

Hopefully more people will start listening to the warnings, because we have almost run out of time to prepare.

The Stock Market In 2015 Is Starting To Look Remarkably Similar To The Stock Market In 2008

Bubble Mirror - Public DomainAre we watching a replay of the last financial crisis?  Over the past six months, the price of oil has collapsed, the U.S. dollar has soared, and a whole bunch of other patterns that we witnessed just before the stock market crash of 2008 are repeating once again.  But what we have not seen yet is the actual stock market crash.  So will there be one this year?  In this article, I am going to compare the performance of the Dow Jones Industrial Average during the first three months of 2008 to the performance of the Dow Jones Industrial Average during the first three months of 2015.  As you will see, there are some striking similarities.  And without a doubt, we are overdue for a major market downturn.  The S&P 500 has risen for six years in a row, but it has never had seven up years consecutively.  In addition, there has not even been a 10 percent stock market “correction” is almost three and a half years.  So will stocks be able to continue to defy both gravity and the forces of economic reality?  Only time will tell.

Below is a chart that shows how the Dow Jones Industrial Average performed during the first three months of 2008.  It was a time of increased volatility, but the market pretty much went nowhere.  This is typical of what we see in the months leading up to a market crash.  The markets start getting really choppy with large ups and large downs…

Dow First 3 Months Of 2008

This next chart shows how the Dow Jones Industrial Average has performed during the first three months of 2015.  Once again, we are witnessing a time of increased volatility, but the market is not really going anywhere.  In fact, after falling about 200 points on Tuesday (not shown on this chart) it is just barely below where it started the year…

Dow First 3 Months Of 2015

When the market becomes quite restless but it doesn’t really move anywhere, that is a sign that we have reached a turning point.  The following is what a recent CNN article had to say about the rising volatility that we have been witnessing…

The Dow fell nearly 3.7% in January, surged 5.6% in February and is down about 2% this month. The S&P 500 and Nasdaq have gone through similar sentiment swings. The Dow ended the quarter slightly in the red while the S&P 500 and Nasdaq were up a little bit.

Charles Schwab chief investment officer Liz Ann Sonders summed up this volatility the best — with a nod to U2. “Running to Stand Still: Wild Swings Taking Market Nowhere” is the title of her most recent market commentary.

What can investors expect for the rest of 2015? Probably a lot more of the same.

Now let’s look at a chart for the entire year of 2008.  After peaking for the year in early May, the Dow started to slide.  Things started to get really crazy in September, and by the end of the year the U.S. economy was plunged into the greatest crisis since the Great Depression…

Dow Full Year Of 2008

Will the rest of 2015 follow a similar pattern?

A lot of investors are actually betting that this will be the case.

Right now, hundreds of millions of dollars are flowing into VXX – an ETF that makes money when the Chicago Board Options Exchange Volatility Index goes up.  In other words, these investors are betting that we are going to see a lot more stock market volatility in the weeks and months to come.

And as I have said so many times before, stocks tend to rise in calm markets and they tend to fall when the markets become volatile.

So essentially these investors are betting that we are headed for a stock market crash.

The following is more on the massive inflow of money into VXX that we have been seeing from the Crux

Ways to speculate on how noisy the stock market will be have exploded in the last decade with the advent of products tied to the Chicago Board Options Exchange Volatility Index. Strategies include relatively simple hedges against equity losses, such as owning a security that aims to mimic the VIX.

VXX, one of the most popular ways to bet on bigger market swings, has absorbed $715 million in seven consecutive weeks of inflows, its longest streak of inflows since one ending in July 2012. The infusion of fresh cash has continued this week, swelling its market value to $1.5 billion, the highest since September 2013.

At the same time, short-sellers in VXX — people effectively betting the bull market will persist — have dropped out. Short interest has slid 35 percent since October, falling to the lowest in more than seven months last week, data compiled by Markit Ltd. show.

And many of the exact same people that warned us about the financial crisis of 2008 in advance are warning that another crisis is rapidly approaching.  For example, check out the following quote from Ann Pettifor that recently appeared in an article in the Guardian

As Janet Yellen’s Federal Reserve prepares to raise interest rates, boosting the value of the dollar, while the plunging price of crude puts intense pressure on the finances of oil-exporting countries, there are growing fears of a new debt crisis in the making.

Ann Pettifor of Prime Economics, who foreshadowed the credit crunch in her 2003 book The Coming First World Debt Crisis, says: “We’re going to have another financial crisis. Brazil’s already in great trouble with the strength of the dollar; I dread to think what’s happening in South Africa; then there’s Malaysia. We’re back to where we were, and that for me is really frightening.”

Pettifor is right on two counts – another major financial crisis is approaching, and it is going to be global in scope.

Before I end this article, there are two more items that I would like to share with you.

Firstly, it is being reported that the IPO market has really cooled off in 2015.  When the number of companies going public starts to decline, that is a clear sign that a stock market bubble is on borrowed time.  The following comes from Business Insider

The number of US companies going public has really dropped off lately.

“After a record year in 2014, the IPO market slowed dramatically in the first quarter of 2015,” Renaissance Capital analysts said.

The first quarter of 2015, which ended Tuesday, was the slowest quarter for IPOs since the first quarter of 2013. While stock prices have been near all-time highs, market volatility has been escalating, turning companies off from trying to unload shares onto the public markets.

Secondly, the San Francisco housing market has been a pretty reliable indicator of previous economic booms and busts.  The San Francisco housing market started to cool off before the dotcom bubble burst, it started to cool off before the stock market crash of 2008, and now it is cooling off once again.  The following chart comes from Zero Hedge

San Francisco - Zero Hedge

The warning signs are there.

But as with so many other things in life, most people are going to end up believing precisely what they want to believe.

So what do you believe about what the rest of the year will bring?  Please feel free to share your thoughts by posting a comment below…

7 Signs That A Stock Market Peak Is Happening Right Now

Stock Market Crash - Public DomainIs this the end of the last great run for the U.S. stock market?  Are we witnessing classic “peaking behavior” that is similar to what occurred just before other major stock market crashes?  Throughout 2014 and for the early stages of 2015, stocks have been on quite a tear.  Even though the overall U.S. economy continues to be deeply troubled, we have seen the Dow, the S&P 500 and the Nasdaq set record after record.  But no bull market lasts forever – particularly one that has no relation to economic reality whatsoever.  This false bubble of financial prosperity has been enjoyable, and even I wish that it could last much longer.  But there comes a time when we all must face reality, and the cold, hard facts are telling us that this party is about to end.  The following are 7 signs that a stock market peak is happening right now…

#1 Just before a stock market crash, price/earnings ratios tend to spike, and that is precisely what we are witnessing.  The following commentary and chart come from Lance Roberts

The chart below shows Dr. Robert Shiller’s cyclically adjusted P/E ratio. The problem is that current valuations only appear cheap when compared to the peak in 2000. In order to put valuations into perspective, I have capped P/E’s at 30x trailing earnings. The dashed orange line measures 23x earnings which has been the level where secular bull markets have previously ended. I have noted the peak valuations in periods that have exceeded that 30x earnings.

markets are cheap - StreetTalkLive

At 27.85x current earning the markets are currently at valuation levels where previous bull markets have ended rather than continued. Furthermore, the markets have exceeded the pre-financial crisis peak of 27.65x earnings. If earnings continue to deteriorate, market valuations could rise rapidly even if prices remain stagnant.

#2 The average bull market lasts for approximately 3.8 years. The current bull market has already lasted for six years.

#3 The median total gain during a bull market is 101.5 percent.  For this bull market, it has been 213 percent.

#4 Usually before a stock market crash we see a divergence between the relative strength index and the stock market itself.  This happened prior to the bursting of the dotcom bubble, it happened prior to the crash of 2008, and it is happening again right now

The first technical warning sign that we should heed is marked by a significant divergence between the relative strength index (RSI) and the market itself. This is noted by a declining pattern of lower highs in the RSI as stocks continue to make higher highs, a sign that the market is “topping out”. In the late ‘90s this divergence persisted for many years as the tech bubble reached epic valuation levels. In 2007 this divergence lasted over a much shorter period (6 months) before the market finally peaked and succumbed to massive selling. With last month’s strong rally to new records, we now have a confirmed divergence between the long-term relative strength index and the market’s price action.

#5 In the past, peaks in margin debt have been very closely associated with stock market peaks.  The following chart comes from Doug Short, and I included it in a previous article

Margin Debt

#6 As I have discussed previously, we usually witness a spike in 10 year Treasury yields just about the time that the stock market is peaking right before a crash.

Well, according to Business Insider, we just saw the largest 5 week rate rally in two decades…

Lots of guys and gals went home this past weekend thinking about the implications of the recent rise in the 10-year Treasury bond’s yield.

Chris Kimble notes it was the biggest 5-week rate rally in twenty years!

#7 A lot of momentum indicators seem to be telling us that we are rapidly approaching a turning point for stocks.  For example, James Stack, the editor of InvesTech Research, says that the Coppock Guide is warning us of “an impending bear market on the not-too-distant horizon”

A momentum indicator dubbed the Coppock Guide, which serves as “a barometer of the market’s emotional state,” has also peaked, Stack says. The indicator, which, “tracks the ebb and flow of equity markets from one psychological extreme to another,” is also flashing a warning flag.

The Coppock Guide’s chart pattern is flashing a “double top,”  which suggests that “psychological excesses are present” and that “secondary momentum has peaked” in this bull market, according to Stack.

“All of this is just another reason for concern about an impending bear market on the not-too-distant horizon,” Stack writes.

So if we are to see a stock market crash soon, when will it happen?

Well, the truth is that nobody knows for certain.

It could happen this week, or it could be six months from now.

In fact, a whole lot of people are starting to point to the second half of 2015 as a danger zone.  For example, just consider the words of David Morgan

“Momentum is one indicator and the money supply. Also, when I made my forecast, there is a big seasonality, and part of it is strict analytical detail and part of it is being in this market for 40 years. I got a pretty good idea of what is going on out there and the feedback I get. . . . I’m in Europe, I’m in Asia, I’m in South America, I’m in Mexico, I’m in Canada; and so, I get a global feel, if you will, for what people are really thinking and really dealing with. It’s like a barometer reading, and I feel there are more and more tensions all the time and less and less solutions. It’s a fundamental take on how fed up people are on a global basis. Based on that, it seems to me as I said in the January issue of the Morgan Report, September is going to be the point where people have had it.”

Time will tell if Morgan was right.

But without a doubt, lots of economic warning signs are starting to pop up.

One that is particularly troubling is the decline in new orders for consumer goods.  This is something that Charles Hugh-Smith pointed out in one of his recent articles…

The financial news is astonishingly rosy: record trade surpluses in China, positive surprises in Europe, the best run of new jobs added to the U.S. economy since the go-go 1990s, and the gift that keeps on giving to consumers everywhere, low oil prices.

So if everything is so fantastic, why are new orders cratering? New orders are a snapshot of future demand, as opposed to current retail sales or orders that have been delivered.

Posted below is a chart that he included with his recent article.  As you can see, the only time things have been worse in recent decades was during the depths of the last financial crisis…

Charles Hugh-Smith New Orders

To me, it very much appears that time is running out for this bubble of false prosperity that we have been living in.

But what do you think?  Please feel free to contribute to the discussion by posting a comment below…