Now Even Paul Krugman Of The New York Times Is Admitting That The Next Crisis Will Likely Be Worse Than 2008

There is a growing consensus that once the next economic crash finally arrives that it will be significantly worse than what we experienced in 2008.  This is something that I have been saying for a very long time, but now even mainstream economists such as Paul Krugman of the New York Times are admitting the reality of what we are facing.  And without a doubt, the stage is set for a historic collapse.  We are living at a time when everything is in a bubble – the current housing bubble is much larger than the one that collapsed in 2008, student loan debt has now surpassed the 1.5 trillion dollar mark, corporate debt has doubled since the last financial crisis, U.S. consumers are 13 trillion dollars in debt and the federal government is nearly 22 trillion dollars in debt.  And even though stock prices have fallen dramatically in recent weeks, the truth is that stocks are still wildly overpriced.  What goes up must eventually come down, and Paul Krugman insists that we “are poorly prepared to deal with the next shock” and that “there’s good reason to think it will be worse”

We are poorly prepared to deal with the next shock,” Krugman said. “Interest rates are still close to zero in the US and in most of the rest of the advanced world. The fiscal policy we did was badly handled in the aftermath of the 2008 crisis, and there’s no particular reason to think it will be better. In fact, there’s good reason to think it will be worse.”

Hmmm.

Where have I heard talk like that before?

You know that it is very late in the game when even Paul Krugman can see what is coming.

Meanwhile, a stunning new study that was just released came to the conclusion that the globe is heading for “a massive worldwide financial meltdown” that will be unlike anything that we have ever experienced before…

Previous crashes will appear as “minor stumbling blocks” in comparison to what nuclear scientists are predicting as a massive worldwide financial meltdown “such as never before” in the mid-2020s. Analysts from the Institute of Nuclear Physics of the Polish Academy of Sciences in Kraków are forecasting the future of the global economy as “extremely bleak” as “nervousness of the world market is growing all the time”. The academics’ “catastrophic” predictions come from “multi-fractal” analysis of financial markets published in the journal Complexity. The researchers looked at various economic measures, including Standard & Poor’s 500 index – the largest global stock market index including the largest 500 firms, largely of a worldwide nature – from January 1950 to December 2016.

Wow.

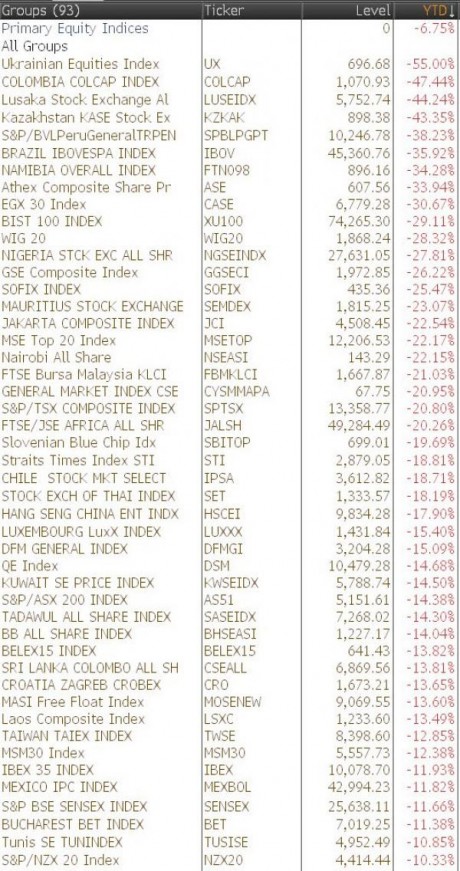
It seems like everyone is in a gloomy mood lately.  Just take a look at the latest GDP forecasts.  Virtually everyone is predicting that U.S. economic growth will be way down this quarter compared to the third quarter.

And we continue to get confirmation after confirmation that economic activity is definitely slowing down.

For example, Apple just reduced factory orders for their new iPhones a second time

Demand for Apple’s latest iPhones may be worse than previously thought.

The tech giant has reportedly issued a second cutback on iPhone orders as a result of weaker-than-expected demand for the high-end devices, according to Taiwan-based news site Digitimes.

It follows earlier reports of production cuts for the iPhone XR and XS.

In addition, housing numbers from all over the nation are deeply troubling.  Just check out what has been happening in Seattle

House prices in the Seattle metro dropped 1.3% in September from prior month, after having dropped 1.6% in August, and 0.5% in July, according to the Case-Shiller Home Price Index. Over those three months, the index dropped 3.5%, the sharpest such decline since December 2011, during Housing Bust 1. So home prices are beginning to unwind a historic spike. The index is now below where it had been in April. This confirms that the inflection point — when the direction changes — was in July and that conditions have deteriorated since.

For more key indicators such as this, please see my previous article entitled “11 Signs That The U.S. Economy Is Starting To Slow Down Dramatically”.

Yes, things are rapidly getting worse for the economy, but did General Motors really have to announce job cuts just before the holidays?  According to the Daily Mail, some workers were seen wiping away tears when the layoffs were announced…

Heart-wrenching photos show General Motors workers wiping tears away after the company laid more than 14,000 people off without warning and just before the holidays.

In a massive restructuring, the auto giant announced Monday that it will cut 15 percent of its workforce to save $6 billion and adapt to ‘changing market conditions’.

‘You’re going right into Christmas. You’re looking for celebration and that’s not there now,’ one GM worker told Today.

If the U.S. economy really was in good shape, this wouldn’t be happening.

For the last few years, America has experienced a time of relative economic stability, and many have been fooled into believing that this time of relative economic stability will last for a very long time.

But the truth is that all of the numbers are telling us that things have now shifted.  For instance, Mike Maloney believes that a decline in corporate tax receipts strongly indicates that another recession is imminent

You might think that tax revenues would fall after a recession starts – but what the data show is that tax revenue in most cases has fallen before a recession.

As Mike shows, in 14 of the last 17 times that corporate tax receipts have begun to roll over and decline, a recession started not long after. In other words…

A drop in corporate tax receipts has frequently predicted a recession.

And guess what? Corporate tax revenue has started to fall.

Unfortunately, it appears that we are even less prepared for the next recession than we were for the last one.

For some reason we are never able to learn important lessons from what has happened in the past, and now even Paul Krugman is convinced that the next recession will be exceedingly painful indeed.

About the author: Michael Snyder is a nationally syndicated writer, media personality and political activist. He is publisher of The Most Important News and the author of four books including The Beginning Of The End and Living A Life That Really Matters.

JP Morgan And Citigroup Agree That The U.S. Economy Is Steamrolling Toward A Recession

Locomotive - Public DomainAs we approach the end of 2015, researchers at both JP Morgan and Citigroup agree that the probability that the U.S. economy will soon plunge into recession is rising.  Just last week, a member of the U.S. House of Representatives asked Janet Yellen about Citigroup’s assessment that there is a 65 percent chance that the United States will experience an economic recession in 2016.  You can read her answer below.  And just a few days ago, JP Morgan economists Michael Feroli, Daniel Silver, Jesse Edgerton, and Robert Mellman released a report in which they declared that “the probability of recession within three years” has risen to “an eye-catching 76%”

“Our longer-run indicators, however, continue to suggest an elevated risk that the expansion is nearing its end, and our preferred model now puts the probability of recession within three years at an eye-catching 76%.”

The good news is that the economists at JP Morgan believe that a recession will probably not hit us within the next six months.  But due to steadily weakening economic conditions, they are convinced that one is almost certain to strike within the next few years

“When we first wrote, only manufacturing sentiment was signaling an above-average probability of imminent recession,” they said. “But recent weakening in the Richmond Fed services survey and the ISM nonmanufacturing index have now pushed the nonmanufacturing sentiment probability up somewhat as well.”

In the short term, the note says that the 6-month likelihood is only 5%, but within a year it stands at 23%, in two years 48%, and in three years the “eye-popping” 76%.

To be honest, I believe that this assessment is far too optimistic, and it appears that researchers at Citigroup agree with me.  According to them, there is a 65 percent chance that the U.S. economy will plunge into recession by the end of next year.  Last week, Janet Yellen was asked about this during testimony before Congress

In testimony before Congress’ Joint Economic Committee, Yellen was asked by Rep. Pat Tiberi about a piece of research released by Citigroup’s rates strategy team Monday.

Specifically, Tiberi, an Ohio Republican, wanted to know what Yellen made of Citi’s conclusion that there is a 65 percent chance of a U.S. recession in 2016.

“The economists said that they would assign about a 65 percent likelihood of a recession in the United States in 2016. Now, 65 percent sounds high to me, but I’m not an economist and I’m not the Fed chair. But zero risk might be too low as well. So what would you assign a risk level of a recession next year?” Tiberi asked.

So how did Yellen respond?

Her answer was about what you would expect

“I absolutely wouldn’t see it as anything approaching 65 percent,” the central banker said.

This reminds me so much of what former Federal Reserve Chairman Ben Bernanke said when he was asked a similar question back in 2008

“The Federal Reserve is not currently forecasting a recession.”

Later on, when the official numbers finally came out and all the revisions were done, we learned that the U.S. economy was already in a recession when he made that statement.

And when it is all said and done this time around, I believe that history will show that a new global recession had already started when Janet Yellen made her statement.

But don’t just take my word for it.  British banking giant HSBC is the largest bank in the western world, and they recently announced that the global economy has already entered a “dollar recession“.  According to HSBC, total global trade has fallen 8.4 percent so far this year, and global GDP expressed in U.S. dollars is down 3.4 percent.

If their figures are correct, a new global recession has definitely begun.

And without a doubt, we have already seen a tremendous amount of global financial turmoil.  This is something that I highlighted in my recent article entitled “27 Major Global Stocks Markets That Have Already Crashed By Double Digit Percentages In 2015“.  When Zero Hedge republished my article, several excellent charts were added that really illustrate how bad things have gotten, and I wanted to share a couple of them with you.  Of the 93 largest stock market indexes in the world, an astounding 47 of them (more than half) are down at least 10 percent year to date.  This first chart shows which ones fall into that category…

47 Out Of 93

Another chart that was added to the article by Zero Hedge shows how decoupled U.S. stocks have become from global stocks overall.  As you can see, U.S. stocks are not too far from recent highs at the moment, but global stocks overall are solidly in bear market territory…

US Stocks And World Stocks

Since mid-2015, trillions of dollars of stock market wealth has been wiped out globally.

Let that sink in for a moment.

The debate is over.  The “major financial collapse” that so many warned was imminent has actually happened.

It is just that U.S. stocks have not gotten the memo yet.  Up to this point they have defied gravity, but at some point U.S. stocks and world stocks will converge once again.

And if you want to see many of the reasons why U.S. stocks will soon take a big tumble, just check out this article.  There is no way that U.S. stocks will be able to defy the underlying economic fundamentals that are pummeling other global markets for much longer.  Just like in 2008, a global stock market slide that starts elsewhere will eventually hit the United States.  It is just a matter of time.

But once again, even though U.S. stocks are doing okay for the moment, that doesn’t negate the fact that more than half of all major global stock indexes are down by double digit percentages year to date.

We have not seen numbers like this since the great stock market crash of 2008, and it seems abundantly clear to me that the great financial shaking that so many warned was coming in 2015 is already happening.

And if JP Morgan and Citigroup are correct, what we have seen so far is just a preview of some very troubling times ahead.

Nearly At ‘Full Employment’? 10 Reasons Why The Unemployment Numbers Are A Massive Lie

What - Public DomainOn Friday, we learned that the official “unemployment rate” has fallen to 5.5 percent. Since an unemployment rate of 5 percent is considered to be “full employment” by many economists, many in the mainstream media took this as a sign that the U.S. economy has almost fully “recovered” since the last recession.  In fact, according to the Wall Street Journal, some Federal Reserve officials believe that “the U.S. economy is already at full employment“.  But how can this possibly be?  It certainly does not square with reality.  Personally, I know people that have been struggling with unemployment for years and that still cannot find a decent job.  And I get emails from readers all the time that are heartbroken because they are suffering through extended periods of unemployment.  So what in the world is going on?  How can the government be telling us that we are nearly at “full employment” when so many people can’t find work?  Could it be possible that the government numbers are misleading?

It is my contention that the official “unemployment rate” has become so politicized and so manipulated that it is essentially meaningless at this point.  The following are 10 reasons why…

#1 Since February 2008, the size of the U.S. population has grown by 16.8 million people, but the number of full-time jobs has actually decreased by 140,000.

#2 The percentage of working age Americans that have a job right now is still about the same as it was during the depths of the last recession.  Posted below is a chart that shows how the employment-population ratio has changed since the beginning of the decade.  Does this look like a full-blown “employment recovery” to you?…

Employment Population Ratio 2015

#3 The primary reason for the decline in the official “unemployment rate” is the fact that the government now considers millions upon millions of long-term unemployed workers to “no longer be in the labor force”.  Just check out the following numbers

The number of Americans participating in the labor force has been on a decline for the past few years. Nearly 33 percent of the Americans above age 16 are not part of the workforce, the highest number since 1978. The Bureau of Labor Statistics (BLS) report issued recently has found 92,898,000 Americans above age 16 not a part of the labor force of the country as on February 2015.

When President Obama took over the office in January 2009, nearly 80,529,000 Americans were not a part of the labor force. The number has increase by nearly 12 million over the last few years.

#4 Over the past couple of years, the labor force participation rate in this country has been hovering near mutli-decade lows

The labor force participation rate hovered between 62.9 percent and 62.7 percent in the eleven months from April 2014 through February, and has been 62.9 percent or lower in 13 of the 17 months since October 2013.

Prior to that, the last time the rate was below 63 percent was 37 years ago, in March 1978 when it was 62.8 percent, the same rate it was in February.

#5 When you add the number of “officially unemployed” Americans (8.7 million) to the number of Americans “not in the labor force” (92.9 million), you get a grand total of 101.6 million working age Americans that do not have a job right now.  Does that sound like “full employment” to you?

#6 The quality of our jobs continues to decline.  Right now, only 44 percent of U.S. adults are employed for 30 or more hours each week.

#7 Millions upon millions of Americans have been forced to take part-time jobs because that is all they can find, and wages for American workers are at depressingly low levels.  The following numbers come directly from the Social Security Administration

-39 percent of American workers make less than $20,000 a year.

-52 percent of American workers make less than $30,000 a year.

-63 percent of American workers make less than $40,000 a year.

-72 percent of American workers make less than $50,000 a year.

#8 The average duration of unemployment for an unemployed worker is still about twice as long as it was just prior to the last recession.

#9 Most Americans feel as though the Obama administration has done little to nothing to help the middle class.  Just consider the following poll numbers

According to a new poll by the Pew Research Center, Americans see government policies under the Obama administration as having mostly benefited wealthy people, large corporations and financial institutions.

Seventy-two percent of respondents said government policies have done little or nothing to help the middle class, and 65 percent said they have done nothing to help the poor. Sixty-eight percent said the policies have done nothing to help small businesses.

Meanwhile, 45 percent said the policies have done a “great deal” to help large banks and financial institutions, 38 percent say they have helped large corporations, and 36 percent say they have helped the wealthy.

#10 If the unemployment rate was calculated honestly, we would all be talking about the horrific “unemployment crisis” that we were currently enduring.  According to John Williams of shadowstats.com, the real unemployment rate in the United States right now is above 23 percent.

Our politicians and the mainstream media are attempting to convince us that everything is just fine.

But what they are telling us simply does not match the cold, hard reality on the streets.

And since the talking heads on television are proclaiming that we are nearly at “full employment”, that just makes millions upon millions of Americans that can’t seem to find work no matter how hard they try feel even worse than they already do.

If jobs are “easy to get”, then those that are chronically unemployment must have “something wrong” with them.  That is the message that we are being given.  If the mainstream media says that unemployment has gone way down, then anyone that is still unemployed must be really “lazy”, right?

When you are unemployed for an extended period of time, it can really suck the life right out of you.  It can be really tempting to believe that you are viewed as a failure by your family and friends.  And for the government to lie to us like this just makes things even harder.

If you are unemployed and can’t find a job right now, I want you to understand that you are caught in the midst of a long-term downward economic spiral which is going to get a lot worse.

When the government tells you that we are in a “recovery”, they are lying to you.

And when the government tells you that things are about to get a lot better, they are lying to you.

Everyone has times in their lives when they get knocked down.

The key is to always get back up and to never, ever stop fighting.

Yes, we are facing some really hard economic times.  But that does not mean that your life is over.  Never give up, and never give in to fear.  Just do what you can with what you have today, and tomorrow get up and fight with everything that you have got.

The truth is that the best chapters of your life could be just around the corner.

Just don’t sit back and wait for the government to save you.  If you are waiting for the government to save you, then you are going to be deeply disappointed.

Economists: The U.S. Economy Shrank In Q1, But Better Days Are Just Around The Corner

Smiley Face - Photo by FlyingtigersiteDuring the first three months of this year, the U.S. economy contracted at a 1 percent annual rate.  Despite this, mainstream economists flooded the mainstream media with assurances that much better days are just around the corner on Thursday.  In fact, many of them boldly predicted that U.S. GDP would grow at a 3 or 4 percent annual rate in the second quarter.  None of them seem the least bit concerned that another major recession is rapidly approaching.  Instead, they just blamed the bad number for the first quarter on a “severe winter“, and the financial markets responded to the GDP news quite cheerfully.  In fact, the S&P 500 soared to another brand new record high.  No matter how bad the numbers get, almost everyone in the financial world seems quite optimistic.  But is there actually good reason to have such optimism?

As Zero Hedge has pointed out, if it wasn’t for dramatically increased healthcare spending due to the implementation of Obamacare, U.S. GDP would have actually dropped at a 2 percent annual rate during the first quarter of 2014.

That would have been an absolutely disastrous number.

But within a very short time of the revised U.S. GDP number being released, the mainstream media was inundated with positive stories about the news.

For example, CNN published a story entitled “U.S. economy shrinks, but it’s not a big deal” and CNBC released a survey of nine prominent economists that showed that their consensus forecast for the second quarter of 2014 is GDP growth at a 3.74 percent annual rate.

It just seems like almost everyone wants to forget about what happened during the first quarter and wants to look ahead to a great number for quarter two.

Joseph Lavorgna, the chief U.S. economist at Deutsche Bank, is boldly forecasting a 4 percent growth rate for the second quarter.  So is Jim O’Sullivan.  In fact, it is hard to find any “expert” in the mainstream media that does not expect rip-roaring economic growth this quarter.

For example, just check out these quotes…

Stuart Hoffman, the chief economist for PNC Bank: “The first quarter was disappointing, but rather than view that as an omen of a recession or the first of a down leg in the economy, I see the seeds of a big bounce back in spring.”

Paul Ashworth of Capital Economics: “For those worried about a recession, it’s worth remembering that employment increased by nearly 300,000 in April.”

The Bank of Tokyo’s Chris Rupkey: “2Q growth seen at nearly 4%… Weak 1Q is stone cold dead as an indicator of where the economy is headed.”

Jan Hatzius of Goldman Sachs: “Because of weaker inventory investment in Q1, we increased our Q2 GDP tracking estimate by two-tenths to 3.9%.”

Dun & Bradstreet Credibility Corp. CEO Jeffrey Stibel: “Using an alternative model for projecting job growth, we see an entirely different scenario, one in which the U.S. unemployment rate will fall below 5 percent by no later than the middle of next year.”

Hopefully they are right.

Hopefully we are not heading into another recession.

But as I discussed in an article earlier this week, evidence continues to mount that another recession has already begun for much of the country.

And there was another number that was released today that seems to confirm this.  According to CNBC, there was a 6 percent drop in exports in the first quarter of 2014 when compared to the first quarter of 2013…

The U.S. economic reversal was led by a 6 percent drop in exports year over year, until recently hailed as a key driver of the U.S. recovery, and which had risen 9.5 percent in the last three months of 2013.

The slackening of trade has spread to the developing world, where emerging economies are seeing less demand from the U.S., Europe and China for raw materials and other exports.

We saw a similar decline happen in mid-2008 as the U.S. economy plunged into recession.

And Bloomberg’s Consumer Comfort index has fallen to the lowest level that we have seen in six months.  U.S. consumers are increasingly tapped out, and the ongoing “retail apocalypse” is evidence of that fact.

A declining middle class simply cannot support the massive retail infrastructure that America has developed.  As the middle class has fallen to pieces, it was just a matter of time before big trouble started erupting for the retail industry.  This is something that David Stockman recently wrote about…

It does not take much analysis to see that these bell ringers do not represent sustainable prosperity unfolding across the land. For example, around 1990 real median income was $56k per household and now, 25 years later, its just $51k—-meaning that main street living standards have plunged by about 9% during the last quarter century. But what has not dropped is the opportunity for Americans to drop shopping: square footage per capita during the same period more than doubled, rising from 19 square feet per capita at the earlier date to 47 at present.

This complete contradiction—declining real living standards and soaring investment in retail space—did not occur due to some embedded irrational impulse in America to speculate in real estate, or because capitalism has an inherent tendency to go off the deep-end. The fact that in equally “prosperous” Germany today there is only 12 square feet of retail space per capita is an obvious tip-off, and this is not a teutonic aberration. America’s prize-winning number of 47 square feet of retail space per capita is 3-8X higher than anywhere else in the developed world!

Without middle class jobs, you can’t have a middle class.  That is why our employment crisis is at the very heart of our economic problems.  Even using the government’s highly manipulated unemployment figures, there are still quite a few cities out there that have official unemployment rates in the double digits

The unemployment rate in Yuma, Ariz., is 23.8%. In El Centro, Calif., it is 21.6%. El Centro sits in an area of California in which unemployment in many metro areas is double the national average. In Merced the figure is 14.3%, in Yuba City the figure is 14.5%, in Hanford it is 13.1% and in Visalia it is 13.4%. In several metros close to these, the figure is above 10%. Most of them are inland from San Francisco and the area just south of it, which also happens to be among the nation’s most drought-plagued regions. This means jobs recovery is highly unlikely.

But of course the truth is that if the government actually used honest numbers, the unemployment rate for the entire nation would be in double digits.

And as I like to remind people, according to the government’s own numbers approximately 20 percent of the families in the entire nation do not have a single member that is employed.

So how is it possible that the “unemployment rate” is just a little above 6 percent?

It is a giant sham.

But that is what they want.

They want us feeling good and thinking that everything is going to be okay.

Unfortunately, they used the same approach back in 2007 and 2008, and we all remember how that turned out.

The Top 12 Signs That The U.S. Economy Is Heading Toward Another Recession

12 SignsIs the U.S. economy steamrolling toward another recession?  Will 2014 turn out to be a major “turning point” when we look back on it?  Before we get to the evidence, it is important to note that there are many economists that believe that the United States never actually got out of the last recession.  For example, data compiled by John Williams of shadowstats.com show that the U.S. economy has continually been in recession since 2005.  So if anyone out there would like to argue that America is experiencing a recession right now, I certainly would not have a problem with that.  In fact, that would fit with the daily reality of tens of millions of Americans that are deeply suffering in this harsh economic environment.  But no matter whether we are in a “recession” at the moment or not, there are an increasing number of indications that we are rapidly plunging into another major economic slowdown.  The following are the top 12 signs that the U.S. economy is heading toward another recession…

#1 We recently learned that the number of new mortgage applications in the United States had fallen to the lowest level that we have seen in nearly 20 years.

#2 Radio Shack has announced that it is going to close more than 1,000 stores.  This is just another sign that we are in the midst of a “retail apocalypse“.

#3 The ISM Services index just fell to its lowest level in 4 years, and ISM Services Employment just experienced its largest decline since the collapse of Lehman Brothers.

#4 Obamacare is really starting to hammer the U.S. health care industry

The Affordable Care Act is creating significant financial uncertainty to health care organizations,” said a survey respondent from the health care and social assistance industry.

“With little warning, the negative impact on revenue has been unprecedented.”

#5 Trading revenue at the “too big to fail” banks on Wall Street is way down

Citigroup Inc. (C) and JPMorgan Chase & Co. (JPM) are bracing investors for a fourth straight drop in first-quarter trading, a period of the year when the largest investment banks typically earn the most from that business.

Citigroup finance chief John Gerspach said yesterday his firm expects trading revenue to drop by a “high mid-teens” percentage, less than a week after JPMorgan Chief Executive Officer Jamie Dimon said revenue from equities and fixed income was down about 15 percent. If trading at the nine largest firms slumps that much, it would extend the slide from 2010’s first quarter to 36 percent.

#6 One of the “too big to fail” banks, JPMorgan, is planning to fire “thousands” more workers.

#7 Moody’s has downgraded the credit rating of the city of Chicago again.  Now it is just three notches above junk status.

#8 The U.S. economy actually lost 2.87 million jobs during the month of January according to the unadjusted numbers.  Over the past decade, the only time the U.S. economy has lost more jobs during the month of January was in 2009 at the peak of the last recession.

#9 In January, real disposable income in the U.S. experienced the largest year over year decline that we have seen since 1974.

#10 Only 35 percent of all Americans say that they are better off financially than they were a year ago.

#11 Global retail sales for machinery giant Caterpillar have fallen for 14 months in a row.

#12 The economic data show that virtually all of the largest economies on the planet are slowing down right now.  The following is from a recent Zero Hedge article

The last 3 weeks have seen the macro fundamentals of the G-10 major economies collapse at the fastest pace in almost 4 years and almost the biggest slump since Lehman. Despite a plethora of data showing that ‘weather’ is not to blame, US strategists, ‘economists’, and asset-gatherers are sticking to the meme that this is all because of the cold on the east coast of the US (and that means wondrous pent-up demand to come). However, as the New York Times reports, for the earth, it was the 4th warmest January on record.

For much more on how the rest of the global economy is also slowing down, please see my recent article entitled “20 Signs That The Global Economic Crisis Is Starting To Catch Fire“.

Meanwhile, things in Ukraine continue to become even more tense, and the Russian government continues to debate how it will respond if the U.S. does end up deciding to hit Russia with economic sanctions.

According to one Russian news source, the Russian parliament is actually considering the confiscation of the property and assets of U.S. businesses in Russia if the U.S. decides to go ahead with economic sanctions against Russia…

The upper house of Russia’s parliament is mulling measures allowing property and assets of European and US companies to be confiscated in the event of sanctions being adopted against Russia over its threatened military intervention in Ukraine.

We are talking about banks, retail chains, mining operations, etc.

U.S. companies have billions invested in Russia, and all of that could be gone in an instant.

So let us certainly hope that economic war between the United States and Russia is averted.  Our economy is hurting enough as it is.

But no matter how things with this crisis in Ukraine play out, it looks like hard times are ahead for the U.S. economy.

Unfortunately, most Americans never learned the lessons that they should have learned back in 2008.

They just assume that the federal government and the Federal Reserve have fixed our problems and have everything under control, so they are not preparing for the next great crisis.

In the end, tens of millions of Americans will be absolutely devastated when they get absolutely blindsided by what is coming.

Time Is Running Out

40 Stats That Prove The U.S. Economy Has Already Been Collapsing Over The Past Decade

40The “coming economic collapse” has already been happening.  You see, the truth is that the economic collapse is not a single event.  It has already started, it is happening right now, and it will accelerate during the years ahead.  The statistics in this article show very clearly that the U.S. economy has fallen dramatically over the past ten years or so.  Unfortunately, there are lots of mockers out there that love to mock the idea of an economic collapse even though one is happening right in front of our eyes.  They love to say stuff like this (and I am paraphrasing): “An economic collapse is never going to happen.  We can consume far more wealth than we produce forever.  We can pile up gigantic mountains of debt forever.  There is no way that the party is over.  In fact, the party is just getting started.  Woo-hoo!”  That sounds absolutely ridiculous, but “economists” and “journalists” actually write things that reflect these kinds of sentiments every single day.  They do not seem alarmed about the fact that our national debt is nearly 17 times larger than it was 30 years ago.  They do not seem alarmed about the fact that the total amount of debt in our country is more than 28 times larger than it was 40 years ago.  They do not seem alarmed about the fact that our economic infrastructure is being absolutely gutted and we are steadily becoming poorer as a nation.  They just think that the magic formula of print, borrow, spend and consume can go on indefinitely.  Unfortunately, the truth is that a massive economic disaster has already started to unfold.  We inherited the greatest economic machine in the history of the world, but we totally wrecked it.  We have been able to live far, far beyond our means for the last couple of decades thanks to the greatest debt bubble in the history of the planet, but now that debt bubble is getting ready to burst.  Anyone with half a brain should be able to see what is coming.  Just open your eyes and look at the facts.  The following are 40 stats that prove the U.S. economy has already been collapsing over the past decade…

#1 According to the World Bank, U.S. GDP accounted for 31.8 percent of all global economic activity in 2001.  That number dropped to 21.6 percent in 2011.

#2 The United States was once ranked #1 in the world in GDP per capita.  Today we have slipped to #14.

#3 The United States has fallen in the global economic competitiveness rankings compiled by the World Economic Forum for four years in a row.

#4 Since the year 2000, the size of the U.S. national debt has grown by more than 11 trillion dollars.

#5 Back in the year 2000, our trade deficit with China was 83 billion dollars.  Last year, it was 315 billion dollars.

#6 In the year 2000, about 17 million Americans were employed in manufacturing.  Today, only about 12 million Americans are employed in manufacturing.

#7 The United States has lost more than 56,000 manufacturing facilities since 2001.

#8 The United States has lost a staggering 32 percent of its manufacturing jobs since the year 2000.

#9 Between December 2000 and December 2010, 38 percent of the manufacturing jobs in Ohio were lost, 42 percent of the manufacturing jobs in North Carolina were lost and 48 percent of the manufacturing jobs in Michigan were lost.

#10 Back in 1998, the United States had 25 percent of the world’s high-tech export market and China had just 10 percent. Today, China’s high-tech exports are more than twice the size of U.S. high-tech exports.

#11 In 2002, the United States had a trade deficit in “advanced technology products” of $16 billion with the rest of the world.  In 2010, that number skyrocketed to $82 billion.

#12 The United States has lost more than a quarter of all of its high-tech manufacturing jobs since the year 2000.

#13 The number of full-time workers in the United States is nearly 6 million below the old record that was set back in 2007.

#14 The average duration of unemployment in the United States is nearly three times as long as it was back in the year 2000.

#15 Throughout the year 2000, more than 64 percent of all working age Americans had a job.  Today, only 58.7 percent of all working age Americans have a job.

#16 The official unemployment rate has been at 7.5 percent or higher for 54 months in a row.  That is the longest stretch in U.S. history.

#17 The U.S. government says that the number of Americans “not in the labor force” rose by 17.9 million between 2000 and 2011.  During the entire decade of the 1980s, the number of Americans “not in the labor force” rose by only 1.7 million.

#18 The average number of hours worked per employed person per year has fallen by about 100 since the year 2000.

#19 The U.S. economy continues to trade good paying jobs for low paying jobs.  60 percent of the jobs lost during the last recession were mid-wage jobs, but 58 percent of the jobs created since then have been low wage jobs.

#20 The U.S. economy lost more than 220,000 small businesses during the recent recession.

#21 The percentage of Americans that are self-employed has steadily declined over the past decade and is now at an all-time low.

#22 According to economist Tim Kane, the following is how the number of startup jobs per 1000 Americans breaks down by presidential administration

Bush Sr.: 11.3

Clinton: 11.2

Bush Jr.: 10.8

Obama: 7.8

#23 In the year 2000, there were only 17 million Americans on food stamps.  Today, there are more than 47 million Americans on food stamps.

#24 In the year 2000, the ratio of social welfare benefits to salaries and wages was approximately 21 percent.  Today, the ratio of social welfare benefits to salaries and wages is approximately 35 percent.

#25 Since Barack Obama entered the White House, the average price of a gallon of gasoline in the United States has risen from $1.85 to $3.64.

#26 More than twice as many new homes were sold in the United States in 2005 as will be sold in 2013.

#27 Right now there are 20.2 million Americans that spend more than half of their incomes on housing.  That represents a 46 percent increase from 2001.

#28 The price of ground beef increased by 61 percent between 2002 and 2012.

#29 According to USA Today, water bills have actually tripled over the past 12 years in some areas of the country.

#30 In 1999, 64.1 percent of all Americans were covered by employment-based health insurance.  Today, only 55.1 percent are covered by employment-based health insurance.

#31 Median household income in the United States has fallen for four years in a row.

#32 As I mentioned recently, the homeownership rate in America is now at its lowest level in nearly 18 years.

#33 Back in the year 2000, the mortgage delinquency rate was about 2 percent.  Today, it is nearly 10 percent.

#34 Median household income for families with children dropped by a whopping $6,300 between 2001 and 2011.

#35 Back in 2007, about 28 percent of all working families were considered to be among “the working poor”.  Today, that number is up to 32 percent even though our politicians tell us that the economy is supposedly recovering.

#36 According to the Federal Reserve, the median net worth of families in the United States declined “from $126,400 in 2007 to $77,300 in 2010“.

#37 According to the New York Times, the average debt burden for U.S. households that earn $20,000 a year or less “more than doubled to $26,000 between 2001 and 2010“.

#38 Medicare spending increased by 138 percent between 1999 and 2010.

#39 During Obama’s first term, the federal government accumulated more debt than it did under the first 42 U.S presidents combined.

#40 Today, more than a million public school students in the United States are homeless.  This is the first time that has ever happened in our history.  That number has risen by 57 percent since the 2006-2007 school year.

Are there any other items that you would add to this list?  Please feel free to join the discussion by posting a comment below…

Crushed Car By UCFFool

Will It Be Inflation Or Deflation? The Answer May Surprise You

Inflation Or DeflationIs the coming financial collapse going to be inflationary or deflationary?  Are we headed for rampant inflation or crippling deflation?  This is a subject that is hotly debated by economists all over the country.  Some insist that the wild money printing that the Federal Reserve is doing combined with out of control government spending will eventually result in hyperinflation.  Others point to all of the deflationary factors in our economy and argue that we will experience tremendous deflation when the bubble economy that we are currently living in bursts.  So what is the truth?  Well, for the reasons listed below, I believe that we will see both.  The next major financial panic will cause a substantial deflationary wave first, and after that we will see unprecedented inflation as the central bankers and our politicians respond to the financial crisis.  This will happen so quickly that many will get “financial whiplash” as they try to figure out what to do with their money.  We are moving toward a time of extreme financial instability, and different strategies will be called for at different times.

So why will we see deflation first?  The following are some of the major deflationary forces that are affecting our economy right now…

The Velocity Of Money Is At A 50 Year Low

The rate at which money circulates in our economy is the lowest that it has been in more than 50 years.  It has been steadily falling since the late 1990s, and this is a clear sign that economic activity is slowing down.  The shaded areas in the chart represent recessions, and as you can see, the velocity of money always slows down during a recession.  But even though the government is telling us that we are not in a recession right now, the velocity of money continues to drop like a rock.  This is one of the factors that is putting a tremendous amount of deflationary pressure on our economy…

Velocity Of Money

The Trade Deficit

Even single month, far more money leaves this country than comes into it.  In fact, the amount going out exceeds the amount coming in by about half a trillion dollars each year.  This is extremely deflationary.  Our system is constantly bleeding cash, and this is one of the reasons why the federal government has felt a need to run such huge budget deficits and why the Federal Reserve has felt a need to print so much money.  They are trying to pump money back into a system that is constantly bleeding massive amounts of cash.  Since 1975, the amount of money leaving the United States has exceeded the amount of money coming into the country by more than 8 trillion dollars.  The trade deficit is one of our biggest economic problems, and yet most Americans do not even understand what it is.  As you can see below, our trade deficit really started getting bad in the late 1990s…

Trade Deficit

Wages And Salaries As A Percentage Of GDP

One of the primary drivers of inflation is consumer spending.  But consumers cannot spend money if they do not have it.  And right now, wages and salaries as a percentage of GDP are near a record low.  This is a very deflationary state of affairs.  The percentage of low paying jobs in the U.S. economy continues to increase, and we have witnessed an explosion in the ranks of the “working poor” in recent years.  For consumer prices to rise significantly, more money is going to have to get into the hands of average American consumers first…

Wages And Salaries As A Percentage Of GDP

When The Debt Bubble Bursts

Right now, we are living in the greatest debt bubble in the history of the world.  When a debt bubble bursts, fear and panic typically cause the flow of money and the flow of credit to really tighten up.  We saw that happen at the beginning of the Great Depression of the 1930s, we saw that happen back in 2008, and we will see it happen again.  Deleveraging is deflationary by nature, and it can cause economic activity to grind to a standstill very rapidly.

During the next major wave of the economic collapse, there will be times when it will seem like hardly anyone has any money.  The “easy credit” of the past will be long gone, and large numbers of individuals and small businesses will find it very difficult to get loans.

When the debt bubble bursts, cash will be king – at least for a short period of time.  Those that do not have any savings at all will really be hurting.

And some of the financial elite seem to be positioning themselves for what is coming.  For example, even though he has been making public statements about how great stocks are right now, the truth is that Warren Buffett is currently sitting on $49 billion in cash.  That is the most that he has ever had sitting in cash.

Does he know something?

Of course there will be a tremendous amount of pressure on the U.S. government and the Federal Reserve to do something once a financial crash happens.  The response by the federal government and the Federal Reserve will likely be extremely inflationary as they try to resuscitate the system.  It will probably be far more dramatic than anything we have seen so far.

So cash will not be king for long.  In fact, eventually cash will be trash.  The actions of the U.S. government and the Federal Reserve in response to the coming financial crisis will greatly upset much of the rest of the world and cause the death of the U.S. dollar.

That is why gold, silver and other hard assets are going to be so good to have in the long-term.  In the short-term they will experience wild swings in price, but if you can handle the ride you will be smiling in the end.

In the coming years, we are going to experience both inflation and deflation, and neither one will be pleasant at all.

Get prepared while you still can, because time is running out.

The Price Of Copper And 11 Other Recession Indicators That Are Flashing Red

Red LightThere are a dozen significant economic indicators that are warning that the U.S. economy is heading into a recession.  The Dow may have soared past the 15,000 mark, but the economic fundamentals are telling an entirely different story.  If historical patterns hold up, the economy is heading for a very rocky stretch.  For example, the price of copper is called “Dr. Copper” by many economists because it so accurately forecasts the future direction of the U.S. economy.  And so far this year the price of copper is way down.  But that is not the only indicator that is worrying economists.  Home renovation spending has fallen dramatically, retail spending is crashing in a way not seen since the last recession, manufacturing activity and consumer confidence are both declining, and troubling economic data continues to come pouring out of Asia and Europe.  So why do U.S. stocks continue to skyrocket?  Will U.S. financial markets be able to continue to be divorced from reality?  Unfortunately, as we have seen so many times in the past, when stocks do catch up with reality they tend to do so very rapidly.  So you better put on your seatbelts because a crash is coming at some point.

But most average Americans are not that concerned with the performance of the stock market.  They just want to be able to go to work, pay the bills and provide for their families.  During the last recession, millions of Americans lost their jobs and millions of Americans lost their homes.  If we have another major recession, that will happen again.  Sadly, it appears that another major recession is quickly approaching.

The following are 12 recession indicators that are flashing red…

#1 The price of copper has traditionally been one of the very best indicators of the future performance of the U.S. economy.  The fact that it is down nearly 20 percent so far this year has many analysts extremely concerned

Copper’s downward trend foreshadows a stock market collapse, according to Societe Generale’s famously bearish strategist Albert Edwards, who said equity markets will riot “Japan-style.”

“Copper is acting exactly as it did when I wrote about the impotence of liquidity in the face of the (then imminent) 2007 recession. Once again it is giving us an early warning that liquidity will not save risk assets: time to get out of equities,” Edwards wrote in his latest research note, on Thursday.

#2 Home renovation spending has fallen back to depressingly-low 2010 levels.

#3 As Zero Hedge recently pointed out, U.S. retail spending is repeating a pattern that we have not seen since the last recession…

Retail sales of clothing is growing at the slowest pace since 2010; but while major store sales are about to drop negative YoY for the first time in over 3 years, the utter collapse in general merchandise sales is worse that at the peak of the last recession at -5%. It seems tough to see how a nation with an economy built on 70% consumption is not in a recessionary environment. And while this alone is a dismal signal for the discretionary upside of the US economy/consumer; as Gluskin Sheff’s David Rosenberg points out real personal income net of transfer receipts plunged at a stunning 5.8% annual rate in Q1. The other seven times we have seen such a collapse, the economy was either in recession of just coming out of one.

#4 Manufacturing activity all over the country is showing signs of slowing down.  In fact, Chicago PMI has dipped below 50 (indicating contraction) for the first time since the last recession.

#5 In April, consumer confidence unexpectedly fell to a nine-month low

The Thomson Reuters/University of Michigan preliminary index of consumer sentiment declined to 72.3 in April from 78.6 a month earlier. This month’s reading was lower than all 69 estimates in a Bloomberg survey that called for no change from the March number.

#6 NYSE margin debt peaked right before the recession that began in 2002, it peaked right before the financial crisis of 2008, and it is peaking again.

#7 The S&P 500 usually mirrors the performance of Chinese stocks very closely.  That is why it is so alarming that Chinese stocks peaked months ago.  Will the S&P 500 soon follow?

#8 The economic data coming out of the Chinese economy lately has been mostly terrible

For starters, China’s recent economic data, as massaged as it is to the upside, is downright awful. China’s PMI numbers were the worst in two years. Staffing levels in the Chinese service sector decreased for the first time since January 2009 (remember that year).

China’s LEI also shows no sign of recovery. If anything, it indicates China is heading towards an economic slowdown on par with that of 2008. And if you account for the rampant debt fueling China’s economy you could easily argue that China is posting 0% GDP growth today.

#9 Things just continue to get even worse over in Europe.  Unemployment in both Greece and Spain is now about 27 percent, and the unemployment rate in the eurozone as a whole has just set a brand new all-time record high.

#10 Crude inventories have soared to a record high as demand for energy continues to decline.  As I have written about previously, this is a clear sign that economic activity is slowing down.

#11 Casino spending is usually a strong indicator of the overall health of the U.S. economy.  That is why it is so noteworthy that casino spending is now back to levels that we have not seen since the last recession.

#12 The impact of the sequester cuts is starting to kick in.  According to the Congressional Budget Office, the sequester cuts will cost the U.S. economy about 750,000 jobs this year.

Do you have any other recession indicators that you would add to this list?

I invite you to share your thoughts by posting a comment below…

A Recession Is Coming - Photo by Angie from Sawara, Chiba-ken, Japan