U.S. Job Cut Announcements Rise 117 Percent To The Highest Level That We Have Seen In More Than 3 Years

We have not seen anything like this since the last recession.  Layoff announcements are coming fast and furious now, and the speed at which workers are being laid off is shocking a lot of people.  In this day and age, big companies have absolutely no loyalty to their workers.  The moment it becomes financially advantageous for them to start laying off employees, most of them will do it in a heartbeat.  I personally know someone that was an extremely hard worker and that put in extra time and effort for his company for many, many years, but he was just laid off because that is what the number crunchers determined was the right move.  It is a cold, cruel world, and as we witnessed back in 2008, job losses can occur at a pace that is absolutely breathtaking when a recession strikes.

Over the past couple of weeks, I have been documenting the numbers that indicate that a major economic slowdown has begun, and we may have gotten the biggest one so far on Thursday.

According to Challenger, Gray & Christmas, the number of job cut announcements in February was up 117 percent compared to the same period last year.  The following comes from Fox Business

While many experts and investors are eagerly awaiting data on status of the labor market Opens a New Window. to be released by the government on Friday, a new report shows U.S. employers cut more jobs Opens a New Window. last month than they have in the past 3.5 years.

Even though it is the shortest month of the year, U.S. employers announced plans to cut 76,835 jobs last month, according to a report from Challenger, Gray & Christmas. That’s a 117 percent year-over-year increase, and a 45 percent increase over January’s numbers.

You have to go all the way back to 2015 to find a month that was as bad as February.

Are you starting to see that the momentum for the economy has clearly shifted?

The economic news just keeps getting worse and worse as we roll through 2019, and the retail sector is being hit harder than just about anyone else.

In fact, retailers announced more job cuts in February than any other sector did

The retail sector had the most planned job cuts, with 41,201 so far this year – the highest January-February total since 2009. The industrial goods sector – including some manufacturers – followed with nearly 32,000 cuts announced during the same time period.

The primary reasons employers cited for eliminating positions were restructuring and bankruptcy.

This is being called a “retail apocalypse”, and we are on pace to absolutely shatter the all-time record for store closings in a single year.

At this point, retailers have already announced the closure of more than 5,300 stores.  The following list of retailers that have announced that they are shutting down at least 10 locations comes from Business Insider

Payless ShoeSource: 2,500 stores
Gymboree: 805 stores
Family Dollar: 390 stores
Shopko: 251 stores
Chico’s: 250 stores
Gap: 230 stores
Performance Bicycle: 102 stores
Charlotte Russe: 520 stores
Sears: 70 stores
Destination Maternity: 42-67 stores
Victoria’s Secret: 53 stores
Kmart: 50 stores
Abercrombie & Fitch: 40 stores
Christopher & Banks: 30-40 stores
JCPenney: 27 stores
Beauty Brands: 25 stores
Henri Bendel: 23 stores
Lowe’s: 20 stores

And that list doesn’t even include the fact that Amazon is closing all 87 of its pop-up stores.

I have repeatedly warned that we will be facing a future of boarded up windows, empty retail stores and abandoned malls, and it is happening right in front of our eyes.

Of course it isn’t just the retail industry that is rapidly laying off workers.  Here are just a few of the highlights from the workforce reduction announcements that we have seen in recent days…

-Tesla continues to struggle, and they have already laid off 8 percent of their entire workforce.

-Microsoft is cutting approximately 200 jobs in their commercial sales business.

-JP Morgan is steadily shutting down bank branches in lower income neighborhoods.

-We Work has announced that they have let 300 employees go.

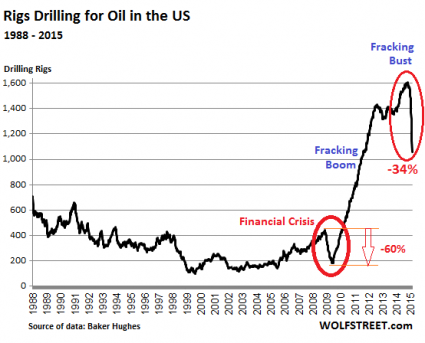
-Devon Energy is eliminating about 200 workers.

-Whole Foods is cutting back worker hours.

-Encana has announced that it is laying off 274 workers in the Houston area.

-In North Carolina, Duke Energy has eliminated 1,900 positions.

-Ocwen Financial is planning to lay off approximately 2,000 workers over the course of 2019.

And in my article yesterday, I noted that General Motors is shutting down four major production plants this year.

It’s really happening.

The bubble of debt-fueled false prosperity that we have been enjoying is disappearing, and the road ahead is going to be really rough.

On Thursday we also learned that U.S. household wealth has been plummeting.  In fact, the fourth quarter of 2018 was the worst quarter for household balance sheets since the last financial crisis

Americans’ net worth fell at the highest level since the financial crisis in the fourth quarter of 2018 as sliding stock market prices ate into the household balance sheet.

Net worth dropped to $104.3 trillion as the year came to an end, a decrease of $3.73 trillion from the third quarter, according to figures released Thursday by the Federal Reserve. The fall amounted to a drop of 3.4 percent.

An increasing number of families are feeling financially squeezed these days, and many of them are accumulating large amounts of debt as they attempt to keep things going.

But for a lot of Americans that are currently drowning in debt, the end of the road has already been reached.

In an article that I posted yesterday, I noted that an all-time record 7 million Americans are behind on their vehicle payments, 37 million credit card accounts are considered to be “seriously delinquent”, and 166 billion dollars worth of student loans are now in the “seriously delinquent” category.

This is a consumer debt crisis that already surpasses the numbers that we witnessed during the last recession.

Nobody is quite sure what is going to happen next.  This is very much a developing story, and I will share new numbers with you as I get them in.

We haven’t experienced anything quite like this since 2008, and most Americans are completely unprepared for a new economic downturn.

About the author: Michael Snyder is a nationally-syndicated writer, media personality and political activist. He is the author of four books including Get Prepared Now, The Beginning Of The End and Living A Life That Really Matters. His articles are originally published on The Economic Collapse Blog, End Of The American Dream and The Most Important News. From there, his articles are republished on dozens of other prominent websites. If you would like to republish his articles, please feel free to do so. The more people that see this information the better, and we need to wake more people up while there is still time.

The Debt To GDP Ratio For The Entire World: 286 Percent

Global Debt - Public DomainDid you know that there is more than $28,000 of debt for every man, woman and child on the entire planet?  And since close to 3 billion of those people survive on less than 2 dollars a day, your share of that debt is going to be much larger than that.  If we took everything that the global economy produced this year and everything that the global economy produced next year and used it to pay all of this debt, it still would not be enough.  According to a recent report put out by the McKinsey Global Institute entitled “Debt and (not much) deleveraging“, the total amount of debt on our planet has grown from 142 trillion dollars at the end of 2007 to 199 trillion dollars today.  This is the largest mountain of debt in the history of the world, and those numbers mean that we are in substantially worse condition than we were just prior to the last financial crisis.

When it comes to debt, a lot of fingers get pointed at the United States, and rightly so.  Just prior to the last recession, the U.S. national debt was sitting at about 9 trillion dollars.  Today, it has crossed the 18 trillion dollar mark.  But of course the U.S. is not the only one that is guilty.  In fact, the McKinsey Global Institute says that debt levels have grown in all major economies since 2007.  The following is an excerpt from the report

Seven years after the bursting of a global credit bubble resulted in the worst financial crisis since the Great Depression, debt continues to grow. In fact, rather than reducing indebtedness, or deleveraging, all major economies today have higher levels of borrowing relative to GDP than they did in 2007. Global debt in these years has grown by $57 trillion, raising the ratio of debt to GDP by 17 percentage points (Exhibit 1). That poses new risks to financial stability and may undermine global economic growth.

What is surprising is that debt has actually grown the most in China.  If you can believe it, total Chinese debt has grown from 7 trillion dollars in 2007 to 28 trillion dollars today.  Needless to say, that is absolutely insane…

China’s debt has quadrupled since 2007. Fueled by real estate and shadow banking, China’s total debt has nearly quadrupled, rising to $28 trillion by mid-2014, from $7 trillion in 2007. At 282 percent of GDP, China’s debt as a share of GDP, while manageable, is larger than that of the United States or Germany. Three developments are potentially worrisome: half of all loans are linked, directly or indirectly, to China’s overheated real-estate market; unregulated shadow banking accounts for nearly half of new lending; and the debt of many local governments is probably unsustainable. However, MGI calculates that China’s government has the capacity to bail out the financial sector should a property-related debt crisis develop. The challenge will be to contain future debt increases and reduce the risks of such a crisis, without putting the brakes on economic growth.

What all of this means is that our long-term global economic problems have gotten much, much worse.  This short-lived period of relative stability that we have been enjoying has been fueled by unprecedented amounts of debt and voracious money printing.  Anyone with half a brain should be able to see that this is a giant financial bubble, and in the end it is going to unwind very, very painfully.  The following comes from a Canadian news source

At the beginning of 2008, government accounted for a smaller portion of the debt pie than corporate, household or financial debt. It now exceeds each of those other categories.

The current situation is much worse than in 2000 or 2007, and with interest rates near or at zero, the central banks have already used up their ammunition. Plus, the total indebtedness, especially the indebtedness of governments, is much higher than ever before,” said Claus Vogt, a Berlin-based analyst and co-author of a 2011 book titled The Global Debt Trap.

“Every speculative bubble rests on some kind of a fairy tale, a story the bubble participants believe in and use as rationalization to buy extremely overvalued stocks or bonds or real estate,” Mr. Vogt argued. “And now it is the faith in the central-planning capabilities of global central bankers. When the loss of confidence in the Fed, the ECB etc. begins, the stampede out of stocks and bonds will start. I think we are very close to this pivotal moment in financial history.”

But for the moment, the ridiculous stock market bubble continues.

Internet companies that didn’t even exist a decade ago are now supposedly worth billions upon billions of dollars even though some of them don’t make any money at all.  There is even a name for this phenomenon.  Internet companies that have gigantic valuations without gigantic revenue streams are being called “unicorns”

A dizzying mix of bold ideas and lavish investments has catapulted dozens of privately held start-ups to unicorn status, defined as having market valuations of at least $1 billion often without soaring revenues to match. Social-sharing site Pinterest has soared to $11 billion. Ride-hailing company Uber is now worth a staggering $50 billion.

How long can the party last?

And these days, Wall Street even rewards companies that lose huge amounts of money quarter after quarter.  For example, just check out what happened when JC Penney announced that it only lost 167 million dollars during the first quarter of 2015…

Yippee!!! JC Penney ONLY lost $167 million in the first quarter. The Wall Street shysters are ecstatic because they BEAT expectations. Buy Buy Buy.

This loss now brings JC Penney’s cumulative loss since 2011 to, drum roll please, $3.5 BILLION. They haven’t had a profitable quarter in over four years. But, they are always on the verge of that turnaround just over the horizon.

Wall Street has told you to buy this stock from $42 in 2012 to it’s current pitiful level of $9. They tout the wonderful 3.4% increase in comparable sales. They fail to mention that first quarter 2016 sales are only 30% below first quarter sales in 2011.

They fail to mention that JC Penney burned through another $274 million of cash in the first quarter. Their equity has dropped by $1 billion in the last year, while their long term debt has gone up by $500 million.

This is how irrational Wall Street has become.  JC Penney is ultimately going to zero, and yet there are still people out there that are pouring huge amounts of money into that financial black hole.

Sadly, the truth is that Wall Street is headed for a very painful awakening.

What we are experiencing right now is the greatest financial bubble of all time.

What comes after that is going to be the greatest financial crash of all time.

199,000,000,000,000 dollars of debt is about to come crashing down, and the pain of this disaster will be felt by every man, woman and child on the entire planet.


Why The Price Of Oil Is More Likely To Fall To 20 Rather Than Rise To 80

Oil - Public DomainThis is just the beginning of the oil crisis.  Over the past couple of weeks, the price of U.S. oil has rallied back above 50 dollars a barrel.  In fact, as I write this, it is sitting at $52.93.  But this rally will not last.  In fact, analysts at the big banks are warning that we could soon see U.S. oil hit the $20 mark.  The reason for this is that the production of oil globally is still way above the current level of demand.  Things have gotten so bad that millions of barrels of oil are being stored at sea as companies wait for the price of oil to go back up.  But the price is not going to go back up any time soon.  Even though rigs are being shut down in the United States at the fastest pace since the last financial crisis, oil production continues to go up.  In fact, last week more oil was produced in the U.S. than at any time since the 1970s.  This is really bad news for the economy, because the price of oil is already at a catastrophically low level for the global financial system.  If the price of oil stays at this level for the rest of the year, we are going to see a whole bunch of energy companies fail, billions of dollars of debt issued by energy companies could go bad, and trillions of dollars of derivatives related to the energy industry could implode.  In other words, this is a recipe for a financial meltdown, and the longer the price of oil stays at this level (or lower), the more damage it is going to do.

The way things stand, there is simply just way too much oil sitting out there.  And anyone that has taken Economics 101 knows that when supply far exceeds demand, prices go down

Oil prices have gotten crushed for the last six months. The extent to which that was caused by an excess of supply or by a slowdown in demand has big implications for where prices will head next. People wishing for a big rebound may not want to read farther.

Goldman Sachs released an intriguing analysis on Wednesday that shows what many already suspected: The big culprit in the oil crash has been an abundance of oil flooding the market. A massive supply shock in the second half of last year accounted for most of the decline. In December and January, slowing demand contributed to the continued sell-off.

At this point so much oil has already been stored up that companies are running out of places to put in all.  Just consider the words of Goldman Sachs executive Gary Cohn

“I think the oil market is trying to figure out an equilibrium price. The danger here, as we try and find an equilibrium price, at some point we may end up in a situation where storage capacity gets very, very limited. We may have too much physical oil for the available storage in certain locations. And it may be a locational issue.”

“And you may just see lots of oil in certain locations around the world where oil will have to price to such a cheap discount vis-a-vis the forward price that you make second tier, and third tier and fourth tier storage available.”

[…] “You could see the price fall relatively quickly to make that storage work in the market.”

The market for oil has fundamentally changed, and that means that the price of oil is not going to go back to where it used to be.  In fact, Goldman Sachs economist Sven Jari Stehn says that we are probably heading for permanently lower prices

The big take-away: “[T]he decline in oil has been driven by an oversupplied global oil market,” wrote Goldman economist Sven Jari Stehn. As a result, “the new equilibrium price of oil will likely be much lower than over the past decade.”

So how low could prices ultimately go?

As I mentioned above, some analysts are throwing around $20 as a target number

The recent surge in oil prices is just a “head-fake,” and oil as cheap as $20 a barrel may soon be on the way, Citigroup said in a report on Monday as it lowered its forecast for crude.

Despite global declines in spending that have driven up oil prices in recent weeks, oil production in the U.S. is still rising, wrote Edward Morse, Citigroup’s global head of commodity research. Brazil and Russia are pumping oil at record levels, and Saudi Arabia, Iraq and Iran have been fighting to maintain their market share by cutting prices to Asia. The market is oversupplied, and storage tanks are topping out.

A pullback in production isn’t likely until the third quarter, Morse said. In the meantime, West Texas Intermediate Crude, which currently trades at around $52 a barrel, could fall to the $20 range “for a while,” according to the report.

Keep in mind that the price of oil is already low enough to be a total nightmare for the global financial system if it stays here for the rest of 2015.

If we go down to $20 and stay there, a global financial meltdown is virtually guaranteed.

Meanwhile, the “fracking boom” in the United States that generated so many jobs, so much investment and so much economic activity is now turning into a “fracking bust”

The fracking-for-oil boom started in 2005, collapsed by 60% during the Financial Crisis when money ran out, but got going in earnest after the Fed had begun spreading its newly created money around the land. From the trough in May 2009 to its peak in October 2014, rigs drilling for oil soared from 180 to 1,609: multiplied by a factor of 9 in five years! And oil production soared, to reach 9.2 million barrels a day in January.

It was a great run, but now it is over.

In the months ahead, the trickle of good paying oil industry jobs that are being lost right now is going to turn into a flood.

And this boom was funded with lots and lots of really cheap money from Wall Street.  I like how Wolf Richter described this in a recent article

That’s what real booms look like. They’re fed by limitless low-cost money – exuberant investors that buy the riskiest IPOs, junk bonds, leveraged loans, and CLOs usually indirectly without knowing it via their bond funds, stock funds, leveraged-loan funds, by being part of a public pension system that invests in private equity firms that invest in the boom…. You get the idea.

As all of this bad paper unwinds, a lot of people are going to lose an extraordinary amount of money.

Don’t get caught with your pants down.  You will want your money to be well away from the energy industry long before this thing collapses.

And of course in so many ways what we are facing right now if very reminiscent of 2008.  So many of the same patterns that have played out just prior to previous financial crashes are happening once again.  Right now, oil rigs are shutting down at a pace that is almost unprecedented.  The only time in recent memory that we have seen anything like this was just before the financial crisis in the fall of 2008.  Here is more from Wolf Richter

In the latest reporting week, drillers idled another 84 rigs, the second biggest weekly cut ever, after idling 83 and 94 rigs in the two prior weeks. Only 1056 rigs are still drilling for oil, down 443 for the seven reporting weeks so far this year and down 553 – or 34%! – from the peak in October.

Never before has the rig count plunged this fast this far:

Fracking Bust

What if the fracking bust, on a percentage basis, does what it did during the Financial Crisis when the oil rig count collapsed by 60% from peak to trough? It would take the rig count down to 642!

But even though rigs are shutting down like crazy, U.S. production of oil has continued to rise

Rig counts have long been used to help predict future oil and gas production. In the past week drillers idled 98 rigs, marking the 10th consecutive decline. The total U.S. rig count is down 30 percent since October, an unprecedented retreat. The theory goes that when oil rigs decline, fewer wells are drilled, less new oil is discovered, and oil production slows.

But production isn’t slowing yet. In fact, last week the U.S. pumped more crude than at any time since the 1970s. “The headline U.S. oil rig count offers little insight into the outlook for U.S. oil production growth,” Goldman Sachs analyst Damien Courvalin wrote in a Feb. 10 report.

Look, it should be obvious to anyone with even a basic knowledge of economics that the stage is being set for a massive financial meltdown.

This is just the kind of thing that can plunge us into a deflationary depression.  And when you combine this with the ongoing problems in Europe and in Asia, it is easy to see that a “perfect storm” is brewing on the horizon.

Sadly, a lot of people out there will choose not to believe until the day the crisis arrives.

By then, it will be too late to do anything about it.


12 Numbers About The Global Financial Ponzi Scheme That Should Be Burned Into Your Brain

Brain - Public DomainThe numbers that you are about to see are likely to shock you.  They prove that the global financial Ponzi scheme is far more extensive than most people would ever dare to imagine.  As you will see below, the total amount of debt in the world is now more than three times greater than global GDP.  In other words, you could take every single good and service produced on the entire planet this year, next year and the year after that and it still would not be enough to pay off all the debt.  But even that number pales in comparison to the exposure that big global banks have to derivatives contracts.  It is hard to put into words how reckless they have been.  At the low end of the estimates, the total exposure that global banks have to derivatives contracts is 710 trillion dollars.  That is an amount of money that is almost unimaginable.  And the reality of the matter is that there is really not all that much actual “money” in circulation today.  In fact, as you will read about below, there is only a little bit more than a trillion dollars of U.S. currency that you can actually hold in your hands in existence.  If we all went out and tried to close our bank accounts and investment portfolios all at once, that would create a major league crisis.  The truth is that our financial system is little more than a giant pyramid scheme that is based on debt and paper promises.  It is literally a miracle that it has survived for so long without collapsing already.

When Americans think about the financial crisis that we are facing, the largest number that they usually can think of is the size of the U.S. national debt.  And at over 17 trillion dollars, it truly is massive.  But it is actually the 2nd-smallest number on the list below.  The following are 12 numbers about the global financial Ponzi scheme that should be burned into your brain…

$1,280,000,000,000 – Most people are really surprised when they hear this number.  Right now, there is only 1.28 trillion dollars worth of U.S. currency floating around out there.

$17,555,165,805,212.27 – This is the size of the U.S. national debt.  It has grown by more than 10 trillion dollars over the past ten years.

$32,000,000,000,000 – This is the total amount of money that the global elite have stashed in offshore banks (that we know about).

$48,611,684,000,000 – This is the total exposure that Goldman Sachs has to derivatives contracts.

$59,398,590,000,000 – This is the total amount of debt (government, corporate, consumer, etc.) in the U.S. financial system.  40 years ago, this number was just a little bit above 2 trillion dollars.

$70,088,625,000,000 – This is the total exposure that JPMorgan Chase has to derivatives contracts.

$71,830,000,000,000 – This is the approximate size of the GDP of the entire world.

$75,000,000,000,000 – This is approximately the total exposure that German banking giant Deutsche Bank has to derivatives contracts.

$100,000,000,000,000 – This is the total amount of government debt in the entire world.  This amount has grown by $30 trillion just since mid-2007.

$223,300,000,000,000 – This is the approximate size of the total amount of debt in the entire world.

$236,637,271,000,000 – According to the U.S. government, this is the total exposure that the top 25 banks in the United States have to derivatives contracts.  But those banks only have total assets of about 9.4 trillion dollars combined.  In other words, the exposure of our largest banks to derivatives outweighs their total assets by a ratio of about 25 to 1.

$710,000,000,000,000 to $1,500,000,000,000,000 – The estimates of the total notional value of all global derivatives contracts generally fall within this range.  At the high end of the range, the ratio of derivatives exposure to global GDP is about 21 to 1.

Most people tend to assume that the “authorities” have fixed whatever caused the financial world to almost end back in 2008, but that is not the case at all.

In fact, the total amount of government debt around the globe has grown by about 40 percent since then, and the “too big to fail banks” have collectively gotten 37 percent larger since then.

Our “authorities” didn’t fix anything.  All they did was reinflate the bubble and kick the can down the road for a little while.

I don’t know how anyone can take an honest look at the numbers and not come to the conclusion that this is completely and totally unsustainable.

How much debt can the global financial system take before it utterly collapses?

How recklessly can the big banks behave before the house of cards that they have constructed implodes underneath them?

For the moment, everything seems fine.  Stock markets around the world have been setting record highs and credit is flowing like wine.

But at some point a day of reckoning is coming, and when it arrives it is going to be the most painful financial crisis the world has ever seen.

If you plan on getting ready before it strikes, now is the time to do so.

A Quadrillion Yen And Counting – The Japanese Debt Bomb Could Set Off Global Panic At Any Moment

Shibuya Crossing in Tokyo, JapanHow much is 1,000,000,000,000,000 yen worth?  Well, a quadrillion yen is worth approximately 10.5 trillion dollars.  It is an amount of money that is larger than the “the economies of Germany, France and the U.K. combined“.  It is such an astounding amount of debt that it is hard to even get your mind around it.  The government debt to GDP ratio in Japan will reach 247 percent this year, and the Japanese currently spend about 50 percent of all central government tax revenue on debt service.  Realistically, there are only two ways out of this overwhelming debt trap for the Japanese.  Either they default or they try to inflate the debt away.  At this point, the Japanese have chosen to try to inflate the debt away.  They have initiated the greatest quantitative easing experiment that a major industrialized nation has attempted since the days of the Weimar Republic.  Over the next two years, the Bank of Japan plans to zap 60 trillion yen into existence out of thin air and use it to buy government bonds.  By the time this program is over, the monetary base in Japan will have approximately doubled.  But authorities in Japan are desperate.  They know that the Japanese debt bomb could set off global panic at any time, and they are trying to find a way out that will not cause too much pain.

Unfortunately, the only way that this bizarre quantitative easing program will work is if investors in Japanese bonds act very, very irrationally.  You see, the only way that Japan has been able to pile up this much debt in the first place is because they have been able to borrow gigantic piles of money at super low interest rates.

Right now, the yield on 10 year Japanese bonds is sitting at an absurdly low 0.76%.  But even with such ridiculously low interest rates, the central government of Japan is still spending about half of all tax revenue on debt service.

If interest rates go up, the game is over.

But now that the Japanese government has announced that it plans to double the monetary base, it would be extremely irrational for investors not to demand higher rates on Japanese government debt.  After all, why would you want to loan money to the Japanese government for less than one percent a year when the purchasing power of your money could potentially be halved over the next two years?

Amazingly, this is exactly what the Japanese government is counting on.  They are counting on being able to wildly print up money and monetize debt, but also keep yields on Japanese bonds at insanely low levels at the same time.

For the moment, it is actually working.  Investors in Japanese bonds are behaving very, very irrationally.

But if that changes at some point, we could potentially be looking at the greatest Asian economic crisis of all time.

And there are some very sharp minds out there that believe that is exactly what is going to happen.

For example, the founder of Hayman Capital Management, Kyle Bass, has been sounding the alarm about Japan for a long time.  He correctly predicted the subprime mortgage meltdown, and in the process he made hundreds of millions of dollars for his clients.  Now he believes that the next major crash is going to be in Japan.

According to Bass, the bond bubble in Japan is so large that once it begins to implode fear is going to start spreading like wildfire…

Remember, Japanese banks in general have 900% of their tangible assets invested in JGBs that are the most negatively convex instrument you can put into a portfolio. Assume for instance that a bank holds a 10 year bond yielding 80 basis points. A 100 basis point move will cost the JGB investor about 10 years of expected interest payments.

Think about the psychology of all the players and financial implications if rates do move 100 basis points. Think about the solvency of a nation which currently spends 50% of its central government tax revenues on debt service, half of which earns the lowest yields of any country in the world.

You can’t look at this as a simple question. You need to think about this as a multivariate equation. You have to think about the incentives and the fears of all the participants. And you need to think about the fiscal sustainability of the government.

If rates even rise by a full percentage point, it could start a stampede toward the exits that nobody in the entire world would be able to control…

I ran a survey of 1,009 Japanese investors where we asked: “If rates were to move up 100 basis points, would that engender more confidence and make you want to buy more JGBs?” or, “Would you take your money elsewhere, even if it were hamstringing your government’s ability to operate?” 8 – 9% of respondents that said that they would buy more bonds and almost 80% said they would run, not walk the other way.

For much more on this, you can watch a video of Kyle Bass discussing why Japan is doomed right here.

And of course Japan is not the only “debt bomb” that could potentially go off over in Asia.  As I mentioned in another article, the major problem over in China is the level of private debt…

In China, the big problem is the absolutely stunning growth of private domestic debt.  According to a recent World Bank report, the total amount of credit in China has risen from 9 trillion dollars in 2008 to 23 trillion dollars today.

That increase is roughly equivalent to the entire U.S. commercial banking system.

There is simply way, way too much debt in our world today.  Never before has there been so much red ink all over the planet at the same time.

Many in the mainstream media insist that this party can go on indefinitely.

But that is what they said about the housing bubble too.

Sadly, the truth is that every financial bubble eventually bursts, and this global debt bubble will be no exception.

I hope that you are getting prepared while you still can.

40 Stats That Prove The U.S. Economy Has Already Been Collapsing Over The Past Decade

40The “coming economic collapse” has already been happening.  You see, the truth is that the economic collapse is not a single event.  It has already started, it is happening right now, and it will accelerate during the years ahead.  The statistics in this article show very clearly that the U.S. economy has fallen dramatically over the past ten years or so.  Unfortunately, there are lots of mockers out there that love to mock the idea of an economic collapse even though one is happening right in front of our eyes.  They love to say stuff like this (and I am paraphrasing): “An economic collapse is never going to happen.  We can consume far more wealth than we produce forever.  We can pile up gigantic mountains of debt forever.  There is no way that the party is over.  In fact, the party is just getting started.  Woo-hoo!”  That sounds absolutely ridiculous, but “economists” and “journalists” actually write things that reflect these kinds of sentiments every single day.  They do not seem alarmed about the fact that our national debt is nearly 17 times larger than it was 30 years ago.  They do not seem alarmed about the fact that the total amount of debt in our country is more than 28 times larger than it was 40 years ago.  They do not seem alarmed about the fact that our economic infrastructure is being absolutely gutted and we are steadily becoming poorer as a nation.  They just think that the magic formula of print, borrow, spend and consume can go on indefinitely.  Unfortunately, the truth is that a massive economic disaster has already started to unfold.  We inherited the greatest economic machine in the history of the world, but we totally wrecked it.  We have been able to live far, far beyond our means for the last couple of decades thanks to the greatest debt bubble in the history of the planet, but now that debt bubble is getting ready to burst.  Anyone with half a brain should be able to see what is coming.  Just open your eyes and look at the facts.  The following are 40 stats that prove the U.S. economy has already been collapsing over the past decade…

#1 According to the World Bank, U.S. GDP accounted for 31.8 percent of all global economic activity in 2001.  That number dropped to 21.6 percent in 2011.

#2 The United States was once ranked #1 in the world in GDP per capita.  Today we have slipped to #14.

#3 The United States has fallen in the global economic competitiveness rankings compiled by the World Economic Forum for four years in a row.

#4 Since the year 2000, the size of the U.S. national debt has grown by more than 11 trillion dollars.

#5 Back in the year 2000, our trade deficit with China was 83 billion dollars.  Last year, it was 315 billion dollars.

#6 In the year 2000, about 17 million Americans were employed in manufacturing.  Today, only about 12 million Americans are employed in manufacturing.

#7 The United States has lost more than 56,000 manufacturing facilities since 2001.

#8 The United States has lost a staggering 32 percent of its manufacturing jobs since the year 2000.

#9 Between December 2000 and December 2010, 38 percent of the manufacturing jobs in Ohio were lost, 42 percent of the manufacturing jobs in North Carolina were lost and 48 percent of the manufacturing jobs in Michigan were lost.

#10 Back in 1998, the United States had 25 percent of the world’s high-tech export market and China had just 10 percent. Today, China’s high-tech exports are more than twice the size of U.S. high-tech exports.

#11 In 2002, the United States had a trade deficit in “advanced technology products” of $16 billion with the rest of the world.  In 2010, that number skyrocketed to $82 billion.

#12 The United States has lost more than a quarter of all of its high-tech manufacturing jobs since the year 2000.

#13 The number of full-time workers in the United States is nearly 6 million below the old record that was set back in 2007.

#14 The average duration of unemployment in the United States is nearly three times as long as it was back in the year 2000.

#15 Throughout the year 2000, more than 64 percent of all working age Americans had a job.  Today, only 58.7 percent of all working age Americans have a job.

#16 The official unemployment rate has been at 7.5 percent or higher for 54 months in a row.  That is the longest stretch in U.S. history.

#17 The U.S. government says that the number of Americans “not in the labor force” rose by 17.9 million between 2000 and 2011.  During the entire decade of the 1980s, the number of Americans “not in the labor force” rose by only 1.7 million.

#18 The average number of hours worked per employed person per year has fallen by about 100 since the year 2000.

#19 The U.S. economy continues to trade good paying jobs for low paying jobs.  60 percent of the jobs lost during the last recession were mid-wage jobs, but 58 percent of the jobs created since then have been low wage jobs.

#20 The U.S. economy lost more than 220,000 small businesses during the recent recession.

#21 The percentage of Americans that are self-employed has steadily declined over the past decade and is now at an all-time low.

#22 According to economist Tim Kane, the following is how the number of startup jobs per 1000 Americans breaks down by presidential administration

Bush Sr.: 11.3

Clinton: 11.2

Bush Jr.: 10.8

Obama: 7.8

#23 In the year 2000, there were only 17 million Americans on food stamps.  Today, there are more than 47 million Americans on food stamps.

#24 In the year 2000, the ratio of social welfare benefits to salaries and wages was approximately 21 percent.  Today, the ratio of social welfare benefits to salaries and wages is approximately 35 percent.

#25 Since Barack Obama entered the White House, the average price of a gallon of gasoline in the United States has risen from $1.85 to $3.64.

#26 More than twice as many new homes were sold in the United States in 2005 as will be sold in 2013.

#27 Right now there are 20.2 million Americans that spend more than half of their incomes on housing.  That represents a 46 percent increase from 2001.

#28 The price of ground beef increased by 61 percent between 2002 and 2012.

#29 According to USA Today, water bills have actually tripled over the past 12 years in some areas of the country.

#30 In 1999, 64.1 percent of all Americans were covered by employment-based health insurance.  Today, only 55.1 percent are covered by employment-based health insurance.

#31 Median household income in the United States has fallen for four years in a row.

#32 As I mentioned recently, the homeownership rate in America is now at its lowest level in nearly 18 years.

#33 Back in the year 2000, the mortgage delinquency rate was about 2 percent.  Today, it is nearly 10 percent.

#34 Median household income for families with children dropped by a whopping $6,300 between 2001 and 2011.

#35 Back in 2007, about 28 percent of all working families were considered to be among “the working poor”.  Today, that number is up to 32 percent even though our politicians tell us that the economy is supposedly recovering.

#36 According to the Federal Reserve, the median net worth of families in the United States declined “from $126,400 in 2007 to $77,300 in 2010“.

#37 According to the New York Times, the average debt burden for U.S. households that earn $20,000 a year or less “more than doubled to $26,000 between 2001 and 2010“.

#38 Medicare spending increased by 138 percent between 1999 and 2010.

#39 During Obama’s first term, the federal government accumulated more debt than it did under the first 42 U.S presidents combined.

#40 Today, more than a million public school students in the United States are homeless.  This is the first time that has ever happened in our history.  That number has risen by 57 percent since the 2006-2007 school year.

Are there any other items that you would add to this list?  Please feel free to join the discussion by posting a comment below…

Crushed Car By UCFFool

Farewell Bernanke – Thanks For Inflating The Biggest Bond Bubble The World Has Ever Seen

Barack Obama And Ben BernankeFederal Reserve Chairman Ben Bernanke is on the way out the door, but the consequences of the bond bubble that he has helped to create will stay with us for a very, very long time.  During Bernanke’s tenure, interest rates on U.S. Treasuries have fallen to record lows.  This has enabled the U.S. government to pile up an extraordinary amount of debt.  During his tenure we have also seen mortgage rates fall to record lows.  All of this has helped to spur economic activity in the short-term, but what happens when interest rates start going back to normal?  If the average rate of interest on U.S. government debt rises to just 6 percent, the U.S. government will suddenly be paying out a trillion dollars a year just in interest on the national debt.  And remember, there have been times in the past when the average rate of interest on U.S. government debt has been much higher than that.  In addition, when the U.S. government starts having to pay more to borrow money so will everyone else.  What will that do to home sales and car sales?  And of course we all remember what happened to adjustable rate mortgages when interest rates started to rise just prior to the last recession.  We have gotten ourselves into a position where the U.S. economy simply cannot afford for interest rates to go up.  We have become addicted to the cheap money made available by a grossly distorted financial system, and we have Ben Bernanke to thank for that.  The Federal Reserve is at the very heart of the economic problems that we are facing in America, and this time is certainly no exception.

This week Barack Obama publicly praised Ben Bernanke and stated that Bernanke has “already stayed a lot longer than he wanted” as Chairman of the Federal Reserve.  Bernanke’s term ends on January 31st, but many observers believe that he could leave even sooner than that.  Bernanke appears to be tired of the job and eager to move on.

So who would replace him?  Well, the mainstream media is making it sound like the appointment of Janet Yellen is already a forgone conclusion.  She would be the first woman ever to chair the Federal Reserve, and her philosophy is that a little bit of inflation is good for an economy.  It seems likely that she would continue to take us down the path that Bernanke has taken us.

But is it a fundamentally sound path?  Keeping interest rates pressed to the floor and wildly printing money may be producing some positive results in the short-term, but the crazy bubble that this is creating will burst at some point.  In fact, the director of financial stability for the Bank of England, Andy Haldane, recently admitted that the central bankers have “intentionally blown the biggest government bond bubble in history” and he warned about what might happen once it ends…

“If I were to single out what for me would be biggest risk to global financial stability right now it would be a disorderly reversion in the yields of government bonds globally.” he said. There had been “shades of that” in recent weeks as government bond yields have edged higher amid talk that central banks, particularly the US Federal Reserve, will start to reduce its stimulus.

“Let’s be clear. We’ve intentionally blown the biggest government bond bubble in history,” Haldane said. “We need to be vigilant to the consequences of that bubble deflating more quickly than [we] might otherwise have wanted.”

Posted below is a chart that demonstrates how interest rates on 10-year U.S. Treasury bonds have fallen over the last several decades.  This has helped to fuel the false prosperity that we have been enjoying, but there is no way that the U.S. government should have been able to borrow money so cheaply.  This bubble that we are living in now is setting the stage for a very, very painful adjustment…

Interest Rate On 10 Year U.S. Treasuries

So what will that “adjustment” look like?

The following analysis is from a recent article by Wolf Richter

Ten-year Treasury notes have been kicked down from their historic pedestal last July when some poor souls, blinded by the Fed’s halo of omnipotence and benevolence, bought them at a minuscule yield of 1.3%. For them, it’s been an ice-cold shower ever since. As Treasuries dropped, yields meandered upward in fits and starts. After a five-week jump from 1.88% in early May, they hit 2.29% on Tuesday last week – they’ve retreated to 2.19% since then. Now investors are wondering out loud what would happen if ten-year Treasury yields were to return to more normal levels of 4% or even 5%, dragging other long-term interest rates with them. They know what would happen: carnage!

And according to Richter, there are already signs that the bond bubble is beginning to burst…

Wholesale dumping of Treasuries by exasperated foreigners has already commenced. Private foreigners dumped $30.8 billion in Treasuries in April, an all-time record. Official holders got rid of $23.7 billion in long-term Treasury debt, the highest since November 2008, and $30.1 billion in short-term debt. Sell, sell, sell!

Bond fund redemptions spoke of fear and loathing: in the week ended June 12, investors yanked $14.5 billion out of Treasury bond funds, the second highest ever, beating the prior second-highest-ever outflow of $12.5 billion of the week before. They were inferior only to the October 2008 massacre as chaos descended upon financial markets. $27 billion in two weeks!

In lockstep, average 30-year fixed-rate mortgage rates jumped from 3.59% in early May to 4.15% last week. The mortgage refinancing bubble, by which banks have creamed off billions in fees, is imploding – the index has plunged 36% since early May.

If interest rates start to climb significantly, that will have a dramatic affect on economic activity in the United States.

And we have seen this pattern before.

As Robert Wenzel noted in a recent article on the Economic Policy Journal, we saw interest rates rise suddenly just prior to the October 1987 stock market crash, and we also saw them rise substantially prior to the financial crisis of 2008…

As Federal Reserve chairman Paul Volcker left the Fed chairmanship in August 1987, the interest rate on the 10 year note climbed from 8.2% to 9.2% between June 1987 and September 1987. This was followed, of course by the October 1987 stock market crash.

As Federal Reserve chairman Alan Greenspan left the Fed chairmanship at the end of January 2006, the interest rate on the 10 year note climbed from 4.35% to 4.65%. It then climbed above 5%.

So keep a close eye on interest rates in the months ahead.  If they start to rise significantly, that will be a red flag.

And it makes perfect sense why Bernanke is looking to hand over the reins of the Fed at this point.  He can probably sense the carnage that is coming and he wants to get out of Dodge while he still can.

12 Things That Just Happened That Show The Next Wave Of The Economic Collapse Is Almost Here

12 Things That Just Happened That Show The Next Wave Of The Economic Collapse Is Almost HereAre we running out of time?  For the last several years, we have been living in a false bubble of hope that has been fueled by massive amounts of debt and bailout money.  This illusion of economic stability has convinced most people that the great economic crisis of 2008 was just an “aberration” and that now things are back to normal.  Unfortunately, that is not the case at all.  The truth is that the financial crash of 2008 was just the first wave of our economic troubles.  We have not even come close to recovering from that wave, and the next wave of the economic collapse is rapidly approaching.  Our economy is like a giant sand castle that has been built on a foundation of debt and toilet paper currency.  As each wave of the crisis hits us, the solutions that our leaders will present to us will involve even more debt and even more money printing.  And each time, those “solutions” will only make our problems even worse.  Right now, events are unfolding in Europe and in the United States that are pushing us toward the next major crisis moment.  I sincerely hope that we have some more time before the next crisis overwhelms us, but as you will see, time is rapidly running out.

The following are 12 things that just happened that show the next wave of the economic collapse is almost here…

#1 According to TrimTab’s CEO Charles Biderman, corporate insider purchases of stock have hit an all-time low, and the ratio of corporate insider selling to corporate insider buying has now reached an astounding 50 to 1….

While retail is being told to buy-buy-buy, Biderman exclaims that “insiders at U.S. companies have bought the least amount of shares in any one month,” and that the ratio of insider selling to buying is now 50-to-1 – a monthly record.

#2 On Friday we learned that personal income in the United States experienced its largest one month decline in 20 years

Personal income decreased by $505.5 billion in January, or 3.6%, compared to December (on a seasonally adjusted and annualized basis). That’s the most dramatic decline since January 1993, according to the Commerce Department.

#3 In a stunning move, Michigan Governor Rick Snyder says that he will appoint an emergency financial manager to take care of Detroit’s financial affairs…

Snyder, 54, took a step he avoided a year ago, empowering an emergency financial manager who can sweep aside union contracts, sell municipal assets, restructure services and reorder finances. He announced the move yesterday at a public meeting in Detroit.

If this does not work, Detroit will almost certainly have to declare bankruptcy.  If that happens, it will be the largest municipal bankruptcy in U.S. history.

#4 On Friday it was announced that the unemployment rate in Italy had risen to 11.7 percent.  That was a huge jump from 11.3 percent the previous month, and Italy now has the highest unemployment rate that it has experienced in 21 years.

#5 The youth unemployment rate in Italy has risen to a new all-time record high of 38.7 percent.

#6 On Friday it was announced that the unemployment rate in the eurozone as a whole had just hit a brand new record high of 11.9 percent.

#7 On Friday it was announced that the unemployment rate in Greece has now reached 27 percent, and it is being projected that it will reach 30 percent by the end of the year.

#8 The youth unemployment rate in Greece is now an almost unbelievable 59.4 percent.

#9 On Saturday, hundreds of thousands of protesters filled the streets of Lisbon and other Portuguese cities to protest the austerity measures that are being imposed upon them.  It was reportedly the largest protest in the history of Portugal.

#10 According to Goldman Sachs, bank deposits declined all over Europe during the month of January.

#11 Over the weekend, the deputy governor of China’s central bank declared that China is prepared for a “currency war“…

A top Chinese banker said Beijing is “fully prepared” for a currency war as he urged the world to abide by a consensus reached by the G20 to avert confrontation, state media reported on Saturday.

Yi Gang, deputy governor of China’s central bank, issued the call after G20 finance ministers last month moved to calm fears of a looming war on the currency markets at a meeting in Moscow.

Those fears have largely been fuelled by the recent steep decline in the Japanese yen, which critics have accused Tokyo of manipulating to give its manufacturers a competitive edge in key export markets over Asian rivals.

#12 Italy is an economic basket case at this point, and the political gridlock in Italy is certainly not helping matters.  Former comedian Beppe Grillo’s party could potentially tip the balance of power one way or the other in Italy, and over the weekend he made some comments that are really shaking things up over in Europe.  For one thing, he is suggesting that Italy should hold a referendum on the euro…

“I am a strong advocate of Europe. I am in favor of an online referendum on the euro,” Beppe Grillo told Bild am Sonntag.

Such a vote would not be legally binding in Italy, where referendums can only be used to repeal laws or parts of laws, but would carry political weight. Grillo has said in the past that membership of the euro should be up to the Italian people.

In addition, Grillo is also suggesting that Italy’s debt has gotten so large that renegotiation is the only option…

In an interview with a German magazine published on Saturday, Mr Grillo said that “if conditions do not change” Italy “will want” to leave the euro and return to its former national currency.

The 64-year-old comic-turned-political activist also said Italy needs to renegotiate its €2 trillion debt.

At 127 per cent of gross domestic product (GDP), it is the highest in the euro zone after Greece.

“Right now we are being crushed, not by the euro, but by our debt. When the interest payments reach €100 billion a year, we’re dead. There’s no alternative,” he told Focus, a weekly news magazine.

He said Italy was in such dire economic straits that “in six months, we will no longer be able to pay pensions and the wages of public employees.”

And of course government debt has taken center stage in the United States as well.

The sequester cuts have now gone into effect, and they will definitely have an effect on the U.S. economy.  Of course that effect will not be nearly as dramatic as many Democrats are suggesting, but without a doubt those cuts will cause the U.S. economy to slow down a bit.

And of course the U.S. economy has already been showing plenty of signs of slowing down lately.  If you doubt this, please see my previous article entitled “Consumer Spending Drought: 16 Signs That The Middle Class Is Running Out Of Money“.

So what comes next?

Well, everyone should keep watching Europe very closely, and it will also be important to keep an eye on Wall Street.  There are a whole bunch of indications that the stock market is at or near a peak.  For example, just check out what one prominent stock market analyst recently had to say

“Every reliable technical tool is warning of major peaking action,” said Walter Zimmerman, the senior technical analyst at United-ICAP. “This includes sentiment, momentum, classical chart patterns, and Elliott wave analysis.

“Most of the rally in the stock market since 2009 can be chalked up to the Federal Reserve’s attempt to create a ‘wealth effect’ through higher stock market prices. This only exacerbates the downside risk. Why? The stock market no is longer a lead indicator for the economy. It is instead reflecting  Fed manipulation. Pushing the stock market higher while the real economy languishes has resulted in another bubble.

“The next leg down will not be a partial correction of the advance since the 2009 lows. It will be another major financial crisis. The worst is yet to come.”

Sadly, most people will continue to deny that anything is wrong until it is far too late.

Many areas of Europe are already experiencing economic depression, and it is only a matter of time before the U.S. follows suit.

Time is running out, and I hope that you are getting ready.

So what do you think?

How much time do you believe that we have left before the next wave of the economic collapse strikes?

Please feel free to post a comment with your thoughts below…

Jeff Rowley Big Wave Surfer wipeout Photo Jaws Peahi by Xvolution Media