We Might As Well Face It – America Is Addicted To Debt

Debt Tree - Public Domain
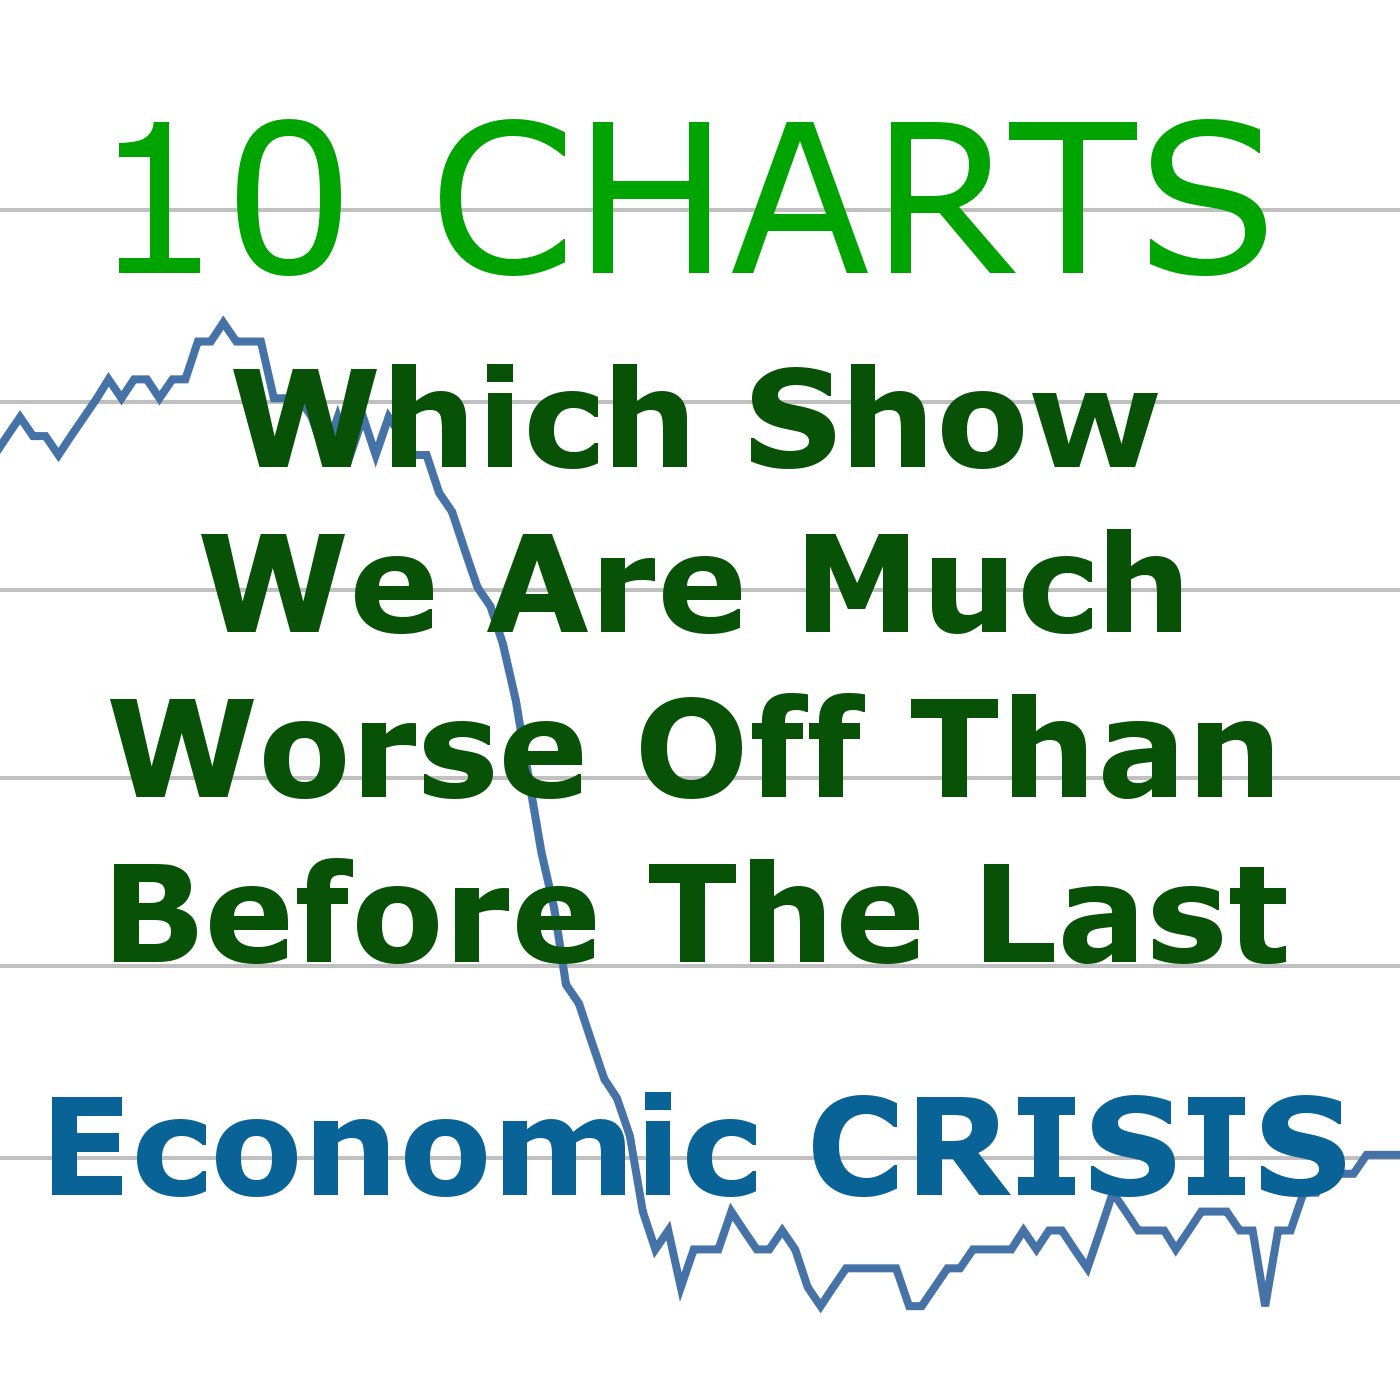
Corporations, individuals and the federal government continue to rack up debt at a rate that is far faster than the overall rate of economic growth.  We are literally drowning in red ink from sea to shining sea, and yet we just can’t help ourselves.  Consumer credit has doubled since the year 2000.  Student loan debt has doubled over the course of the past decade.  Business debt has doubled since 2006.  And of course the debt of the federal government has doubled since 2007.  Anyone that believes that this is “sustainable” in any way, shape or form is crazy.  We have accumulated the greatest mountain of debt that the world has ever seen, and yet despite all of the warnings we just continue to race forward into financial oblivion.  There is no possible way that this is going to end well.

Just the other day, a financial story that USA Today posted really got my attention.  It contained charts and graphs that showed that business debt in the U.S. had doubled since 2006.  I knew that things were bad, but I didn’t know that they were this bad.  Back in 2006, just prior to the last major economic downturn, U.S. nonfinancial companies had a total of about 2.6 trillion dollars of debt.  Now, that total has skyrocketed to 5.8 trillion

Companies are sitting on a record $1.82 trillion in cash. That might sound impressive until you hear companies owe three times more – $5.8 trillion, according to a new report from Standard & Poor’s Ratings Services.

Debt levels are soaring at U.S. non-financial companies so quickly – total debt outstanding rose $650 billion in 2014, which is six times faster than the $100 billion in added cash.

So are we in better condition to handle an economic crisis than we were the last time, or are we in worse shape?

Let’s look at another category of debt.  According to new data that just came out, the total amount of student loan debt in the U.S. is up to a staggering 1.2 trillion dollars.  That total has more than doubled over the past decade…

New data released by The Associated Press shows student loan debt is over $1.2 trillion, which is more than double the amount of a decade ago.

Students are facing an average of $35,000 in debt, that’s the highest of any graduating class in U.S. history. A senior at University of Colorado, Colorado Springs, Jon Cheek, knows the struggle first hand.

“It’s been a pretty big concern, I work while I go to school. I applied for a bunch of scholarships and done everything I can to try and keep it low,” said Cheek.

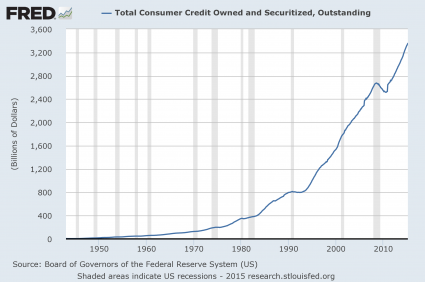
And of course it isn’t just student loan debt.  American consumers have had a love affair with debt that stretches back for decades.  As the chart below demonstrates, overall consumer credit has more than doubled since the year 2000…

consumer credit outstanding

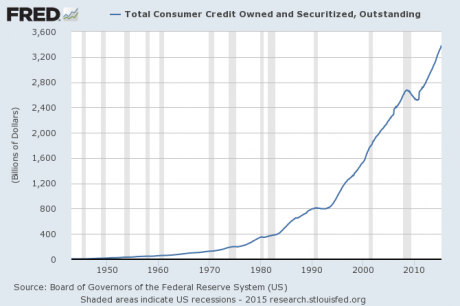
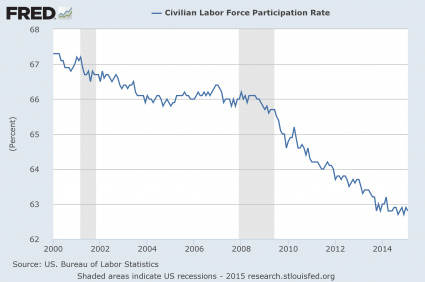
If our paychecks were increasing at this same pace, that would be one thing.  But they aren’t.  In fact, real median household income is actually lower today than it was just prior to the last economic crisis.

So American households should actually be cutting back on debt.  But instead, they are just piling on more debt, and the financial predators are becoming even more creative.  In a previous article,  I discussed how many auto loans are now being stretched out for seven years.  At this point, the number of auto loans that exceed 72 months is at an all-time high

The average new car loan has reached a record 67 months, reports Experian, the Ireland-based information-services company. The percentage of loans with terms of 73 to 84 months also reached a new high of 29.5% in the first quarter of 2015, up from 24.9% a year earlier.

Long-term used-vehicle loans also broke records with loan terms of 73 to 84 months reaching 16% in the first quarter 2015, up from 12.94% — also the highest on record.

When will we learn?

The crash of 2008 should have been a wake up call.

We should have acknowledged our mistakes and we should have started doing things very differently.

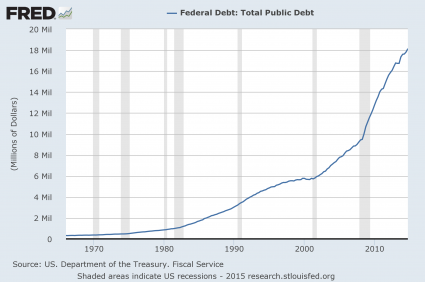
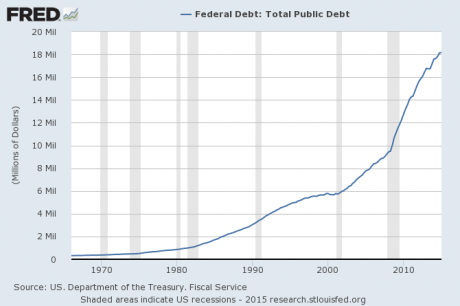
But instead, we just kept on making the exact same mistakes.  In fact, our long-term financial problems have continued to accelerate since the last recession.  Just look at what has happened to our national debt.  Just prior to the last recession, the U.S. national debt was sitting at approximately 9 trillion dollars.  Today, it is over 18 trillion dollars…

National Debt

Our debt has grown so large that we will never be able to get out from under it.  This is something that I covered in my recent article entitled “It Is Mathematically Impossible To Pay Off All Of Our Debt“.  Because of our recklessness, our children, our grandchildren and all future generations of Americans are consigned to a lifetime of debt slavery.  What we have done to them is beyond criminal.  If we lived in a just society, a whole bunch of people would be going to prison for the rest of their lives over this.

During fiscal year 2014, the debt of the federal government increased by more than a trillion dollars.  But in addition to that, the federal government has more than seven trillion dollars of debt that must be “rolled over” every year.  In other words, the government must issue more than seven trillion dollars of new debt just to pay off old debts that are coming due.

As long as the rest of the world continues to lend us enormous mountains of money at ridiculously low interest rates, we can continue to keep our heads above the water.  But this can change at any time.  And once it does, interest rates will rise.  If the average rate of interest on U.S. government debt was to return to the long-term average, we would very quickly find ourselves spending more than a trillion dollars a year just on interest on the national debt.

The debt-fueled prosperity that we are enjoying now is not real.  It is a false prosperity that has been purchased by selling future generations into debt slavery.  We have mortgaged the future to make our own lives better.

We are addicts.  We are addicted to debt, and no matter how many warnings we receive, we just can’t help ourselves.

Shame on you America.

It Is Mathematically Impossible To Pay Off All Of Our Debt

Money - Public DomainDid you know that if you took every single penny away from everyone in the United States that it still would not be enough to pay off the national debt?  Today, the debt of the federal government exceeds $145,000 per household, and it is getting worse with each passing year.  Many believe that if we paid it off a little bit at a time that we could eventually pay it all off, but as you will see below that isn’t going to work either.  It has been projected that “mandatory” federal spending on programs such as Social Security, Medicaid and Medicare plus interest on the national debt will exceed total federal revenue by the year 2025.  That is before a single dollar is spent on the U.S. military, homeland security, paying federal workers or building any roads and bridges.  So no, we aren’t going to be “paying down” our debt any time in the foreseeable future.  And of course it isn’t just our 18 trillion dollar national debt that we need to be concerned about.  Overall, Americans are a total of 58 trillion dollars in debt.  35 years ago, that number was sitting at just 4.3 trillion dollars.  There is no way in the world that all of that debt can ever be repaid.  The only thing that we can hope for now is for this debt bubble to last for as long as possible before it finally explodes.

It shocks many people to learn that our debt is far larger than the total amount of money in existence.  So let’s take a few moments and go through some of the numbers.

When most people think of “money”, they think of coins, paper money and checking accounts.  All of those are contained in one of the most basic measures of money known as M1.  The following definition of M1 comes from Investopedia

A measure of the money supply that includes all physical money, such as coins and currency, as well as demand deposits, checking accounts and Negotiable Order of Withdrawal (NOW) accounts. M1 measures the most liquid components of the money supply, as it contains cash and assets that can quickly be converted to currency.

As you can see from the chart below, M1 has really grown in recent years thanks to rampant quantitative easing by the Federal Reserve.  At the moment it is sitting just shy of 3 trillion dollars…

M1 Money Supply 2015

So if you gathered up all coins, all paper currency and all money in everyone’s checking accounts, would that even make much of a dent in our debt?

Nope.

We’ll have to find more “money” to grab.

M2 is a broader definition of money than M1 is, because it includes more things.  The following definition of M2 comes from Investopedia

A measure of money supply that includes cash and checking deposits (M1) as well as near money. “Near money” in M2 includes savings deposits, money market mutual funds and other time deposits, which are less liquid and not as suitable as exchange mediums but can be quickly converted into cash or checking deposits.

As you can see from the chart below, M2 is sitting just short of 12 trillion dollars right now…

M2 Money Supply 2015

That is a lot more “money”, but it still wouldn’t pay off our national debt, much less our total debt of 58 trillion dollars.

So is there anything else that we could grab?

Well, the broadest definition of “money” that is commonly used is M3.  The following definition of M3 comes from Investopedia

A measure of money supply that includes M2 as well as large time deposits, institutional money market funds, short-term repurchase agreements and other larger liquid assets. The M3 measurement includes assets that are less liquid than other components of the money supply, and are more closely related to the finances of larger financial institutions and corporations than to those of businesses and individuals. These types of assets are referred to as “near, near money.”

The Federal Reserve no longer provides charts for M3, but according to John Williams of shadowstats.com, M3 is currently sitting somewhere in the neighborhood of 17 trillion dollars.

So even with the broadest possible definition of “money”, we simply cannot come up with enough to pay off the debt of the federal government, much less the rest of our debts.

That is not good news at all.

Alternatively, could we just start spending less than we bring in and start paying down the national debt a little bit at a time?

Perhaps that may have been true at one time, but now we are really up against a wall.  Our rapidly aging population is going to put an enormous amount of stress on our national finances in the years ahead.

According to U.S. Representative Frank Wolf, interest on the national debt plus “mandatory” spending on programs such as Social Security, Medicare and Medicaid will surpass the total amount of federal revenue by the year 2025.  That is before a single penny is spent on homeland security, national defense, paying federal workers, etc.

But even now things are a giant mess.  We are told that “deficits are under control”, but that is a massive hoax that is based on accounting gimmicks.  During fiscal year 2014, the U.S. national debt increased by more than a trillion dollars.  That is not “under control” – that is a raging national crisis.

Many believe that that we could improve the situation by raising taxes.  And yes, a little bit more could probably be squeezed out of us, but the impact on government finances would be negligible.  Since the end of World War II, the amount of tax revenue taken in by the federal government has fluctuated in a range between 15 and 20 percent of GDP no matter what tax rates have been.  I believe that it is possible to get up into the low twenties, but that would also be very damaging to our economy and the American public would probably throw a huge temper tantrum.

The real problem, of course, is our out of control spending.

During the past two decades, spending by the federal government has grown 63 percent more rapidly than inflation, and “mandatory” spending on programs such as Social Security, Medicare and Medicaid has actually doubled after you adjust for inflation.

We simply cannot afford to keep spending money like this.

And then there is the matter of interest on the national debt.  For the moment, the rest of the world is lending us gigantic mountains of money at ridiculously low interest rates.  However, if the average rate of interest on U.S. government debt was just to return to the long-term average, we would be spending more than a trillion dollars a year just in interest on the national debt.

So the best possible environment for “paying down our debt” that we are ever going to see is happening right now.  The only place that interest rates on U.S. government debt have to go is up, and our population is going to just keep getting older and more dependent on government programs.

Meanwhile, our overall debt continues to spiral out of control as well.  According to CNBC, the total amount of debt that Americans owe has reached a staggering 58.7 trillion dollars…

As the nation entered the 1980s, there was comparatively little debt—just about $4.3 trillion. That was only about 1.5 times the size of gross GDP. Then a funny thing happened.

The gap began to widen during the decade, and then became basically parabolic through the ’90s and into the early part of the 21st century.

Though debt took a brief decline in 2009 as the country limped its way out of the financial crisis, it has climbed again and is now, at $58.7 trillion, 3.3 times the size of GDP and about 13 times what it was in 1980, according to data from the Federal Reserve’s St. Louis branch. (The total debt measure is not to be confused with the $18.2 trillion national debt, which is 102 percent of GDP and is a subset of the total figure.)

As I discussed above, there isn’t enough money in our entire system to even pay off a significant chunk of that debt.

So what happens when the total amount of debt in a society vastly exceeds the total amount of money?

Is there any way out other than collapse?

You can share what you think by posting a comment below…

The Debt To GDP Ratio For The Entire World: 286 Percent

Global Debt - Public DomainDid you know that there is more than $28,000 of debt for every man, woman and child on the entire planet?  And since close to 3 billion of those people survive on less than 2 dollars a day, your share of that debt is going to be much larger than that.  If we took everything that the global economy produced this year and everything that the global economy produced next year and used it to pay all of this debt, it still would not be enough.  According to a recent report put out by the McKinsey Global Institute entitled “Debt and (not much) deleveraging“, the total amount of debt on our planet has grown from 142 trillion dollars at the end of 2007 to 199 trillion dollars today.  This is the largest mountain of debt in the history of the world, and those numbers mean that we are in substantially worse condition than we were just prior to the last financial crisis.

When it comes to debt, a lot of fingers get pointed at the United States, and rightly so.  Just prior to the last recession, the U.S. national debt was sitting at about 9 trillion dollars.  Today, it has crossed the 18 trillion dollar mark.  But of course the U.S. is not the only one that is guilty.  In fact, the McKinsey Global Institute says that debt levels have grown in all major economies since 2007.  The following is an excerpt from the report

Seven years after the bursting of a global credit bubble resulted in the worst financial crisis since the Great Depression, debt continues to grow. In fact, rather than reducing indebtedness, or deleveraging, all major economies today have higher levels of borrowing relative to GDP than they did in 2007. Global debt in these years has grown by $57 trillion, raising the ratio of debt to GDP by 17 percentage points (Exhibit 1). That poses new risks to financial stability and may undermine global economic growth.

What is surprising is that debt has actually grown the most in China.  If you can believe it, total Chinese debt has grown from 7 trillion dollars in 2007 to 28 trillion dollars today.  Needless to say, that is absolutely insane…

China’s debt has quadrupled since 2007. Fueled by real estate and shadow banking, China’s total debt has nearly quadrupled, rising to $28 trillion by mid-2014, from $7 trillion in 2007. At 282 percent of GDP, China’s debt as a share of GDP, while manageable, is larger than that of the United States or Germany. Three developments are potentially worrisome: half of all loans are linked, directly or indirectly, to China’s overheated real-estate market; unregulated shadow banking accounts for nearly half of new lending; and the debt of many local governments is probably unsustainable. However, MGI calculates that China’s government has the capacity to bail out the financial sector should a property-related debt crisis develop. The challenge will be to contain future debt increases and reduce the risks of such a crisis, without putting the brakes on economic growth.

What all of this means is that our long-term global economic problems have gotten much, much worse.  This short-lived period of relative stability that we have been enjoying has been fueled by unprecedented amounts of debt and voracious money printing.  Anyone with half a brain should be able to see that this is a giant financial bubble, and in the end it is going to unwind very, very painfully.  The following comes from a Canadian news source

At the beginning of 2008, government accounted for a smaller portion of the debt pie than corporate, household or financial debt. It now exceeds each of those other categories.

The current situation is much worse than in 2000 or 2007, and with interest rates near or at zero, the central banks have already used up their ammunition. Plus, the total indebtedness, especially the indebtedness of governments, is much higher than ever before,” said Claus Vogt, a Berlin-based analyst and co-author of a 2011 book titled The Global Debt Trap.

“Every speculative bubble rests on some kind of a fairy tale, a story the bubble participants believe in and use as rationalization to buy extremely overvalued stocks or bonds or real estate,” Mr. Vogt argued. “And now it is the faith in the central-planning capabilities of global central bankers. When the loss of confidence in the Fed, the ECB etc. begins, the stampede out of stocks and bonds will start. I think we are very close to this pivotal moment in financial history.”

But for the moment, the ridiculous stock market bubble continues.

Internet companies that didn’t even exist a decade ago are now supposedly worth billions upon billions of dollars even though some of them don’t make any money at all.  There is even a name for this phenomenon.  Internet companies that have gigantic valuations without gigantic revenue streams are being called “unicorns”

A dizzying mix of bold ideas and lavish investments has catapulted dozens of privately held start-ups to unicorn status, defined as having market valuations of at least $1 billion often without soaring revenues to match. Social-sharing site Pinterest has soared to $11 billion. Ride-hailing company Uber is now worth a staggering $50 billion.

How long can the party last?

And these days, Wall Street even rewards companies that lose huge amounts of money quarter after quarter.  For example, just check out what happened when JC Penney announced that it only lost 167 million dollars during the first quarter of 2015…

Yippee!!! JC Penney ONLY lost $167 million in the first quarter. The Wall Street shysters are ecstatic because they BEAT expectations. Buy Buy Buy.

This loss now brings JC Penney’s cumulative loss since 2011 to, drum roll please, $3.5 BILLION. They haven’t had a profitable quarter in over four years. But, they are always on the verge of that turnaround just over the horizon.

Wall Street has told you to buy this stock from $42 in 2012 to it’s current pitiful level of $9. They tout the wonderful 3.4% increase in comparable sales. They fail to mention that first quarter 2016 sales are only 30% below first quarter sales in 2011.

They fail to mention that JC Penney burned through another $274 million of cash in the first quarter. Their equity has dropped by $1 billion in the last year, while their long term debt has gone up by $500 million.

This is how irrational Wall Street has become.  JC Penney is ultimately going to zero, and yet there are still people out there that are pouring huge amounts of money into that financial black hole.

Sadly, the truth is that Wall Street is headed for a very painful awakening.

What we are experiencing right now is the greatest financial bubble of all time.

What comes after that is going to be the greatest financial crash of all time.

199,000,000,000,000 dollars of debt is about to come crashing down, and the pain of this disaster will be felt by every man, woman and child on the entire planet.


The 90,000 Square Foot, 100 Million Dollar Home That Is A Metaphor For America

Versailles House - Public DomainJust like “America’s time-share king”, America just keeps on making the same mistakes over and over again.  Prior to the financial collapse of 2008, time-share mogul David Siegel and his wife Jackie began construction on their “dream home” near Disney World in Orlando, Florida.  This dream home would be approximately 90,000 square feet in size, would be worth $100 million when completed, and would be named “Versailles” after the French palace that inspired it.  In fact, you may remember David and Jackie from an excellent 2012 documentary entitled “The Queen of Versailles”.  That film documented how the Siegels almost lost everything after the financial collapse of 2008 devastated the U.S. economy because they were overleveraged and drowning in debt.  But since that time, David’s time-share company has bounced back, and the Siegels now plan to finally finish construction on their dream home and make it bigger and better than ever before.  But before you pass judgment on the Siegels, it is important to keep in mind that we are behaving exactly the same way as a nation.  Instead of addressing our fundamental problems after the last financial crisis, we have just continued to make the exact same mistakes that we made before.  And ultimately, things are going to end very, very badly for us.

As Americans, we like to think that we are somehow entitled to the biggest and best of everything.  We have been trained to believe that we are the wealthiest and most prosperous nation on the entire planet and that it will always be that way.  This generation was handed the keys to the greatest economic machine in world history, but instead of treating it with great care, we have wrecked it.  Our economic infrastructure is being systematically dismantled, Wall Street has been transformed into the biggest casino in the history of the planet, we have piled up a mountain of debt unlike anything the world has ever seen, and the reckless Federal Reserve is turning our currency into Monopoly money.  All of our decisions have been designed to make things better for ourselves in the short-term without any consideration about what we were doing to the future of this country.

That is why “Versailles” is such a perfect metaphor for America.  The Siegels always had to have the biggest and the best of everything, and they almost lost it all when the financial markets crashed

David Siegel (“They call me the time-share king”) and his wife, Jackie Siegel — titular star of the 2012 documentary “The Queen of Versailles” — began building their dream home near Disney World about a decade ago. Soon it became evident that the sheer size of the mansion was almost unprecedented in America; it’s thought that only Biltmore House and Oheka Castle are bigger and still standing, and both of those are now run as tourist attractions, not true single-family homes.

But when the bottom fell out of the financial markets in 2008, their fortunes were upended too. By the time the documentary ended, their dream home had gone into default and they’d put it on the market. The listing asked for $100 million finished — “based on the royal palace of Louix XIV of the 17th century or to the buyer’s specifications — or $75 million “as is with all exterior finishings in crates in the 20-car garage on site.”

But just like the U.S. economy, the Siegels have seemingly recovered, at least for the moment.

Thanks to a rebound in the time-share business, the Siegels plan to finally complete their dream home and make it bigger and better than ever

The unfinished home sits on 10 acres of lakefront property and when completed will feature 11 kitchens, 30 bathrooms, 20-car garage, two-lane bowling alley, indoor rollerskating rink, three indoor pools, two outdoor pools, video arcade, ballroom, two-story movie theater modeled off the Paris Opera House, fitness center with 10,000-square-foot spa, yoga studios, 20,000-bottle wine cellar and an exotic fish aquarium.

Two tennis courts, a baseball diamond and formal garden will be included on the grounds.

The couple admitted that some of their plans for the house – such as children’s playrooms – will have to be modified now that their kids are older.

However, they are determined to see the project through.

‘I’m not at the ending to my story yet, but so far, it’s a happy ending, and I’m really looking forward to starting the next chapter of my life and moving into my palace, finishing it and throwing lots of parties – anxious for the world to see it,’ Mrs Siegel said.

It is easy to point fingers at the Siegels, but the truth is that they are just behaving like we have been behaving as an entire nation.

When our financial bubbles burst the last time, our leaders did not really do anything to address our fundamental economic problems.  Instead, they were bound and determined to reinflate those bubbles and make them even larger than before.

Now we stand at the precipice of the greatest financial crisis in our history, and we only have ourselves to blame.

Just consider what has happened to our national debt.  Just prior to the last recession, it was sitting at about 9 trillion dollars.  Today, it has just crossed the 18 trillion dollar mark…

Total Public Debt

You may not think that you are to blame for this, but most of the people that will read this article voted for politicians that fully supported all of this borrowing and spending.  And yes, that includes most Democrats and most Republicans.

We have stolen trillions of dollars from future generations of Americans in a desperate attempt to prop up our failing standard of living in the present.  What we have done is a horrific crime, and if we lived in a just society a whole lot of people would be going to prison over this.

A similar pattern emerges when we look at the spending habits of ordinary Americans.  This next chart shows one measure of consumer credit in America.  During the last recession, we actually had a brief period of deleveraging (which was good), but now we are back on the exact same trajectory as before…

Consumer Credit 2015

Even though we had a higher standard of living than all previous generations of Americans, that was never good enough for us.  We always had to have more, and we have borrowed and spent ourselves into oblivion.

We have also shown absolutely no respect for our currency.  Having the primary reserve currency of the world has been an incredible advantage for the U.S. economy, but we are squandering that privilege.  Like I said at the top of the article, the Federal Reserve has been treating the U.S. dollar like Monopoly money in recent years in an attempt to prop up the financial system.  Just look at what “quantitative easing” has done to the Fed balance sheet since the last recession…

Fed Balance Sheet

Most of the new money that the Fed has created has been funneled into the financial markets.  This has created some financial bubbles which are absolutely insane.  For example, just look at how the NASDAQ has performed since the last financial crisis…

NASDAQ

These Fed-created bubbles are inevitably going to implode, because they have no relation to economic reality whatsoever.  And when they implode, millions of Americans are going to be financially wiped out.

Just like David and Jackie Siegel, we simply can’t help ourselves.  We just keep on making the same old mistakes.

And in the end, we will all pay a great, great price for our utter foolishness.

10 Charts Which Show We Are Much Worse Off Than Just Before The Last Economic Crisis

10 Charts Economic CrisisIf you believe that ignorance is bliss, you might not want to read this article.  I am going to dispel the notion that there has been any sort of “economic recovery”, and I am going to show that we are much worse off than we were just prior to the last economic crisis.  If you go back to 2007, people were feeling really good about things.  Houses were being flipped like crazy, the stock market was booming and unemployment was relatively low.  But then the financial crisis of 2008 struck, and for a while it felt like the world was coming to an end.  Of course it didn’t come to an end – it was just the first wave of our problems.  The waves that come next are going to be the ones that really wipe us out.  Unfortunately, because we have experienced a few years of relative stability, many Americans have become convinced that Barack Obama, Janet Yellen and the rest of the folks in Washington D.C. have fixed whatever problems caused the last crisis.  Even though all of the numbers are screaming otherwise, there are millions upon millions of people out there that truly believe that everything is going to be okay somehow.  We never seem to learn from the past, and when this next economic downturn strikes it is going to do an astonishing amount of damage because we are already in a significantly weakened state from the last one.

For each of the charts that I am about to share with you, I want you to focus on the last shaded gray bar on each chart which represents the last recession.  As you will see, our economic problems are significantly worse than they were just before the financial crisis of 2008.  That means that we are far less equipped to handle a major economic crisis than we were the last time.

#1 The National Debt

Just prior to the last recession, the U.S. national debt was a bit above 9 trillion dollars.  Since that time, it has nearly doubled.  So does that make us better off or worse off?  The answer, of course, is obvious.  And even though Barack Obama promises that “deficits are under control”, more than a trillion dollars was added to the national debt in fiscal year 2014.  What we are doing to future generations by burdening them with so much debt is beyond criminal.  And so what does Barack Obama want to do now?  He wants to ramp up government spending and increase the debt even faster.  This is something that I covered in my previous article entitled “Barack Obama Says That What America Really Needs Is Lots More Debt“.

Presentation National Debt

#2 Total Debt

Over the past 40 years, the total amount of debt in the United States has skyrocketed to astronomical heights.  We have become a “buy now, pay later” society with devastating consequences.  Back in 1975, our total debt level was sitting at about 2.5 trillion dollars.  Just prior to the last recession, it was sitting at about 50 trillion dollars, and today we are rapidly closing in on 60 trillion dollars.

Presentation Credit Market Instruments

#3 The Velocity Of Money

When an economy is healthy, money tends to change hands and circulate through the system quite rapidly.  So it makes sense that the velocity of money fell dramatically during the last recession.  But why has it kept going down since then?

Presentation Velocity Of M2

#4 The Homeownership Rate

Were you aware that the rate of homeownership in the United States has fallen to a 20 year low?  Traditionally, owning a home has been a sign that you belong to the middle class.  And the last recession was really rough on the middle class, so it makes sense that the rate of homeownership declined during that time frame.  But why has it continued to steadily decline ever since?

Presentation Homeownership Rate

#5 The Employment Rate

Barack Obama loves to tell us how the unemployment rate is “going down”.  But as I will explain later in this article, this decline is primarily based on accounting tricks.  Posted below is a chart of the civilian employment-population ratio.  Just prior to the last recession, approximately 63 percent of the working age population of the United States was employed.  During the recession, this ratio fell to below 59 percent and it stayed there for several years.  Just recently it has peeked back above 59 percent, but we are still very, very far from where we used to be, and now the next economic downturn is rapidly approaching.

Presentation Employment Population Ratio

#6 The Labor Force Participation Rate

So how can Obama get away with saying that the unemployment rate has gone down dramatically?  Well, each month the government takes thousands upon thousands of long-term unemployed workers and decides that they have been unemployed for so long that they no longer qualify as “part of the labor force”.  As a result, the “labor force participation rate” has fallen substantially since the end of the last recession…

Presentation Labor Force Participation Rate

#7 The Inactivity Rate For Men In Their Prime Working Years

If things are “getting better”, then why are so many men in their prime working years doing nothing at all?  Just prior to the last recession, the inactivity rate for men in their prime working years was about 9 percent.  Today it is just about 12 percent.

Presentation Inactivity Rate

#8 Real Median Household Income

Not only is a smaller percentage of Americans employed today than compared to just prior to the last recession, the quality of our jobs has gone down as well.  This is one of the factors which has resulted in a stunning decline of real median household income.

Presentation Real Median Household Income

I have shared these next numbers before, but they bear repeating.  In America today, most Americans do not make enough to support a middle class lifestyle on a single salary.  The following figures come directly from the Social Security Administration

-39 percent of American workers make less than $20,000 a year.

-52 percent of American workers make less than $30,000 a year.

-63 percent of American workers make less than $40,000 a year.

-72 percent of American workers make less than $50,000 a year.

We all know people that are working part-time jobs because that is all that they can find in this economy.  As the quality of our jobs continues to deteriorate, the numbers above are going to become even more dismal.

#9 Inflation

Even as our incomes have stagnated, the cost of living just continues to rise steadily.  For example, the cost of food and beverages has gone up nearly 50 percent just since the year 2000.

Presentation Food Inflation

#10 Government Dependence

As the middle class shrinks and the number of Americans that cannot independently take care of themselves soars, dependence on the government is reaching unprecedented heights.  For instance, the federal government is now spending about twice as much on food stamps as it was just prior to the last recession.  How in the world can anyone dare to call this an “economic recovery”?

Presentation Government Spending On Food Stamps

So you tell me – are things “getting better” or are they getting worse?

To me, it is crystal clear that we are in much worse condition than we were just prior to the last economic crisis.

And now things are setting up in textbook fashion for the next great economic crisis.  Unfortunately, most Americans are totally clueless about what is going on and the vast majority are completely and totally unprepared for what is coming.

Or could it be possible that I am wrong?  Whether you agree or disagree with me, please feel free to add to the discussion by posting a comment below…

Why Does Maryland Have The Most Millionaires Per Capita? The Answer Might Make You Angry

Raining MoneyThe fat cats in Washington D.C. are living the high life, and they are doing it at your expense.  Over the past decade, there has been one area of the country which has experienced a massive economic boom.  Thanks to wildly out of control government spending, the Washington D.C. region is absolutely swimming in cash.  In fact, at this point the state of Maryland has the most millionaires per capita in the entire nation and it isn’t even close.  If you have never lived there, it is hard to describe what the D.C. area is like.  Every weekday morning, hordes of lawyers, lobbyists and government bureaucrats descend upon D.C. from the surrounding suburbs.  And at the end of the day, the process goes in reverse.  Everyone is just trying to get their piece of the pie, and it is a pie that just keeps on growing as government salaries, government contracts and government giveaways just get larger and larger.  Of course our founders never intended for this to happen.  They wanted a very small and simple federal government.  Sadly, today we have the most bloated central government in the history of the planet and it gets worse with each passing year.

If you were to ask most Americans, they would tell you that the wealthiest Americans probably live in cities such as New York or San Francisco.  But thanks to the Obama administration (and before that the Bush and Clinton administrations), the state of Maryland is packed with millionaires.  In particular, the Maryland suburbs immediately surrounding D.C. are absolutely overflowing with government fat cats that make a living at our expense.  Every weekday morning, huge numbers of them leave their mini-mansions in places such as Potomac and Rockville and drive their luxury vehicles to work in the city.  As the Washington Post has detailed, at this point approximately 8 percent of all households in the entire state of Maryland contain millionaires, and the rest of the area is not doing too shabby either…

In Maryland, nearly 8 out of every 100 households in 2014 had assets topping $1 million, giving the state more millionaires per capita than any other in the country, according to a new report from Phoenix Marketing International.

The rest of the Beltway isn’t lacking in millionaires either: The District and Virginia ranked in the top 10 among those with the highest number of millionaire households per capita in 2014. In Virginia, which was No. 6 on the list, 6.76 percent of the state’s 3.17 million households are millionaires. And in the District, which rounds out the top 10, 6.25 percent of its more than 292,000 households are millionaires.

And while not too many of them are millionaires, your average federal workers that toil in D.C. are doing quite well too.

Once upon a time, it was considered to be a “sacrifice” to go into “government service”.

Not anymore.

If you can believe it, approximately 17,000 federal employees made more than $200,000 last year.

Overall, compensation for federal employees comes to a grand total of close to half a trillion dollars every 12 months.

In fact, there are tens of thousands of federal employees that make more than the governors of their own states do.

Does that seem right to you?

If you want to live “the American Dream” these days, the Washington area is the place to go.  Just check out the following description of the region from the Washington Post

Washingtonians now enjoy the highest median household income of any metropolitan area in the country, and five of the top 10 jurisdictions in America — Loudoun, Howard and Fairfax counties, and Falls Church and Fairfax City — are here, census data shows.

The signs of that wealth are on display all over, from the string of luxury boutiques such as Gucci and Tory Burch opening at Tysons Galleria to the $15 cocktails served over artisanal ice at the W Hotel in the District to the ever-larger houses rising off River Road in Potomac.

And of course let us not forget the fat cats in Congress.

According to CNN, our Congress critters are now wealthier than every before…

The typical American family is still struggling to recover from the Great Recession, but Congress is getting wealthier every year.

The median net worth of lawmakers was just over $1 million in 2013, or 18 times the wealth of the typical American household, according to new research released Monday by the Center for Responsive Politics.

And while Americans’ median wealth is down 43% since 2007, Congress members’ net worth has jumped 28%.

Not only that, there are nearly 200 members of Congress that are actually multimillionaires

Nearly 200 are multimillionaires. One hundred are worth more than $5 million; the top-10 deal in nine digits. The annual congressional salary alone—$174,000 a year—qualifies every member as the top 6 percent of earners. None of them are close to experiencing the poverty-reduction programs—affordable housing, food assistance, Medicaid—that they help control. Though some came from poverty, a recent analysis by Nicholas Carnes, in his book White Collar Government: The Hidden Role of Class in Economic Policymaking, found that only 13 out of 783 members of Congress from 1999 to 2008 came from a “blue-collar” upbringing.

Incredible.

But even though almost all of them are quite wealthy, they don’t hesitate to spend massive amounts of taxpayer money on their own personal needs.

For example, according to the Weekly Standard, more than five million dollars was spent on the hair care needs of U.S. Senators alone over one recent 15 year period…

Senate Hair Care Services has cost taxpayers about $5.25 million over 15 years. They foot the bill of more than $40,000 for the shoeshine attendant last fiscal year. Six barbers took in more than $40,000 each, including nearly $80,000 for the head barber.

And in one recent year, an average of $4,005,900 was spent on “personal” and “office” expenses per U.S. Senator.

So the grand total would have been over 400 million dollars for a single year.

That seems excessive, doesn’t it?

And even when they end up leaving Washington, our Congress critters have ensured that they will continue to collect money from U.S. taxpayers for the rest of their lives

In 2011, 280 former lawmakers who retired under a former government pension system received average annual pensions of $70,620, according to a Congressional Research Service report. They averaged around 20 years of service. At the same time, another 215 retirees (elected in 1984 or later with an average of 15 years of service) received average annual checks of roughly $40,000 a year.

If you can believe it, there are quite a few former lawmakers that are collecting federal pensions for life worth at least $100,000 annually.  The list includes Newt Gingrich, Bob Dole, Trent Lott, Dick Gephardt and Dick Cheney.

Of course the biggest windfalls of all are for our ex-presidents.  Most Americans would be shocked to learn that the U.S. government is spending approximately 3.6 million dollars a year to support the lavish lifestyles of former presidents such as George W. Bush and Bill Clinton.

So does this make you angry?

Or are you okay with these fat cats living the high life at our expense?

Please feel free to add to the discussion by posting a comment below…

Barack Obama Says That What America Really Needs Is Lots More Debt

ObamacareWhen it comes to taking a chainsaw to the future of America, nobody seems more eager than Barack Obama.  Despite the fact that the U.S. national debt is on pace to approximately double during his eight years in the White House, he has just proposed a budget that would take government spending to crazy new heights.  When Barack Obama took the oath of office, the U.S. national debt was 10.6 trillion dollars.  Today, it has surpassed the 18 trillion dollar mark.  And even though we are being told that “deficits are going down”, the truth is that the U.S. national debt increased by more than a trillion dollars in fiscal 2014.  But that isn’t good enough for Obama.  He says that we need to come out of this period of “mindless austerity” and steal money from our children and our grandchildren even faster.  In addition, Obama wants to raise taxes again.  His budget calls for 2 trillion dollars in tax increases over the next decade.  He always touts these tax increases as “tax hikes on the rich”, but somehow they almost always seem to end up hitting the middle class too.  But whether or not Congress ever adopts Obama’s new budget is not really the issue.  The reality of the matter is that the “tax and spend Democrats” and the “tax and spend Republicans” are both responsible for getting us into this mess.  Future generations of Americans are already facing the largest mountain of debt in the history of the planet, and both parties want to make this mountain of debt even higher.  The only disagreement is about how fast it should happen.  It is a national disgrace, but most Americans have come to accept this as “normal”.  If our children and our grandchildren get the opportunity, they will curse us for what we have done to them.

All debt destroys.

All debt enslaves.

And when you are talking about an 18 trillion dollar debt, you are talking about an amount of money that is almost unimaginable.

If our national debt was reduced to a stack of one dollar bills, it would circle our planet at the equator 45 times.

How could we have done such a thing?

Thomas Jefferson once said that “the principle of spending money to be paid by posterity, under the name of funding, is but swindling futurity on a large scale.”  He correctly understood that government debt is stealing.  We are financially raping our children, our grandchildren and all future generations of Americans.  It is an incredibly wicked thing to do.

But instead of men like Thomas Jefferson running our country, we have men like Barack Obama running it.

And to Barack Obama, running up a trillion dollars of debt a year is “mindless austerity”

“I want to work with Congress to replace mindless austerity with smart investments that strengthen America,” Obama said in a speech at the Department of Homeland Security. “I’m not going to accept a budget that locks in sequestration going forward. It would be bad for our security, and bad for our growth.”

Yes, if we steal money from future generations it will artificially inflate our current standard of living and make our economy look temporarily better than it should be.

But it is morally wrong to do this, and our current crop of politicians have no intentions of ever bringing the debt party to an end.

Even with the ridiculously optimistic economic assumptions that are used in Obama’s new budget, the federal budget is never projected to balance within the next decade.  Instead, Obama’s budget projects that the national debt will rise from 18.1 trillion dollars right now to 26.2 trillion dollars in 2025.

Of course it would greatly help if the federal government actually spent our money wisely.  But instead, the feds often waste our hard-earned tax dollars in some of the most bizarre ways imaginable.  The following is just one example

The U.S. federal government has prompted controversy after spending over $33,000 on a study to find out whether same-sex couples live closer to tobacco shops than heterosexuals.

The large sum was spent on a study by the National Institutes of Health entitled, ‘Relationship Between Tobacco Retailer Density and Sexual Minority Couples.’

Thanks to this kind of insane spending, our debt is completely and totally out of control.

While Barack Obama has been in the White House, the U.S. national debt has increased by $84,266 per full-time private sector worker.  Anyone that believes that this kind of debt accumulation is sustainable is absolutely delusional.

The only reason why our house of cards has not completely collapsed already is because the rest of the world has been willing to lend us gigantic piles of money at artificially low interest rates.

In December, the average rate of interest on the government’s marketable debt was 2.013 percent.  But in the past, interest rates have been much higher than that.  For example, in January 2000 the average rate of interest on the government’s marketable debt was 6.620 percent.  If we returned to that level today, we would be paying well over a trillion dollars a year just in interest on the national debt.

And the issue isn’t just the more than one trillion dollars in new debt that we are accumulating every 12 months.

As I have discussed previously, the U.S. government has more than seven trillion dollars of debt that must be “rolled over” each year.  In other words, the federal government must issue more than seven trillion dollars of new debt just to pay off old debts that are coming due.

If something were to happen which would cause the rest of the planet to either be unwilling or unable to lend us trillions of dollars at ridiculously low interest rates all of a sudden, the game would be over.

We were handed the keys to the greatest and most prosperous economy in the history of the planet, and our greed has totally wrecked it.

We were wealthy beyond imagination, but that was never good enough for us.  We always had to have more.

And now we are hurtling toward financial oblivion, and we have a man in the White House that wants us to go into debt even faster.


The U.S. Government Is Borrowing About 8 Trillion Dollars A Year

National Debt - Public DomainI know that headline sounds completely outrageous.  But it is actually true.  The U.S. government is borrowing about 8 trillion dollars a year, and you are about to see the hard numbers that prove this.  When discussing the national debt, most people tend to only focus on the amount that it increases each 12 months.  And as I wrote about recently, the U.S. national debt has increased by more than a trillion dollars in fiscal year 2014.  But that does not count the huge amounts of U.S. Treasury securities that the federal government must redeem each year.  When these debt instruments hit their maturity date, the U.S. government must pay them off.  This is done by borrowing more money to pay off the previous debts.  In fiscal year 2013, redemptions of U.S. Treasury securities totaled $7,546,726,000,000 and new debt totaling $8,323,949,000,000 was issued.  The final numbers for fiscal year 2014 are likely to be significantly higher than that.

So why does so much government debt come due each year?

Well, in recent years government officials figured out that they could save a lot of money on interest payments by borrowing over shorter time frames.  For example, it costs the government far more to borrow money for 10 years than it does for 1 year.  So a strategy was hatched to borrow money for very short periods of time and to keep “rolling it over” again and again and again.

This strategy has indeed saved the federal government hundreds of billions of dollars in interest payments, but it has also created a situation where the federal government must borrow about 8 trillion dollars a year just to keep up with the game.

So what happens when the rest of the world decides that it does not want to loan us 8 trillion dollars a year at ultra-low interest rates?

Well, the game will be over and we will be in a massive amount of trouble.

I am about to share with you some numbers that were originally reported by CNS News.  As you can see, far more debt is being redeemed and issued today than back during the middle part of the last decade…

2013

Redeemed: $7,546,726,000,000

Issued: $8,323,949,000,000

Increase: $777,223,000,000

2012

Redeemed: $6,804,956,000,000

Issued: $7,924,651,000,000

Increase: $1,119,695,000,000

2011

Redeemed: $7,026,617,000,000

Issued: $8,078,266,000,000

Increase: $1,051,649,000,000

2010

Redeemed: $7,206,965,000,000

Issued: $8,649,171,000,000

Increase: $1,442,206,000,000

2009

Redeemed: $7,306,512,000,000

Issued: $9,027,399,000,000

Increase: $1,720,887,000,000

2008

Redeemed: $4,898,607,000,000

Issued: $5,580,644,000,000

Increase: $682,037,000,000

2007

Redeemed: $4,402,395,000,000

Issued: $4,532,698,000,000

Increase: $130,303,000,000

2006

Redeemed: $4,297,869,000,000

Issued: $4,459,341,000,000

Increase: $161,472,000,000

The only way that this game can continue is if the U.S. government can continue to borrow gigantic piles of money at ridiculously low interest rates.

And our current standard of living greatly depends on the continuation of this game.

If something comes along and rattles this Ponzi scheme, life in America could change radically almost overnight.

In the United States today, we have a heavily socialized system that hands out checks to nearly half the population.  In fact, 49 percent of all Americans live in a home that gets direct monetary benefits from the federal government each month according to the U.S. Census Bureau.  And it is hard to believe, but Americans received more than 2 trillion dollars in benefits from the federal government last year alone.  At this point, the primary function of the federal government is taking money from some people and giving it to others.  In fact, more than 70 percent of all federal spending goes to “dependence-creating programs”, and the government runs approximately 80 different “means-tested welfare programs” right now.  But the big problem is that the government is giving out far more money than it is taking in, so it has to borrow the difference.  As long as we can continue to borrow at super low interest rates, the status quo can continue.

But a Ponzi scheme like this can only last for so long.

It has been said that when the checks stop coming in, chaos will begin in the streets of America.

The looting that took place when a technical glitch caused the EBT system to go down for a short time in some areas last year and the rioting in the streets of Ferguson, Missouri this year were both small previews of what we will see in the future.

And there is no way that we will be able to “grow” our way out of this problem.

As the Baby Boomers continue to retire, the amount of money that the federal government is handing out each year is projected to absolutely skyrocket.  Just consider the following numbers…

Back in 1965, only one out of every 50 Americans was on Medicaid.  Today, more than 70 million Americans are on Medicaid, and it is being projected that Obamacare will add 16 million more Americans to the Medicaid rolls.

When Medicare was first established, we were told that it would cost about $12 billion a year by the time 1990 rolled around.  Instead, the federal government ended up spending $110 billion on the program in 1990, and the federal government spent approximately $600 billion on the program in 2013.

It is being projected that the number of Americans on Medicare will grow from 50.7 million in 2012 to 73.2 million in 2025.

At this point, Medicare is facing unfunded liabilities of more than 38 trillion dollars over the next 75 years.  That comes to approximately $328,404 for every single household in the United States.

In 1945, there were 42 workers for every retiree receiving Social Security benefits.  Today, that number has fallen to 2.5 workers, and if you eliminate all government workers, that leaves only 1.6 private sector workers for every retiree receiving Social Security benefits.

Right now, there are approximately 63 million Americans collecting Social Security benefits.  By 2035, that number is projected to soar to an astounding 91 million.

Overall, the Social Security system is facing a 134 trillion dollar shortfall over the next 75 years.

The U.S. government is facing a total of 222 trillion dollars in unfunded liabilities during the years ahead.  Social Security and Medicare make up the bulk of that.

Yes, things seem somewhat stable for the moment in America today.

But the same thing could have been said about 2007.  The stock market was soaring, the economy seemed like it was rolling right along and people were generally optimistic about the future.

Then the financial crisis of 2008 erupted and it seemed like the world was going to end.

Well, the truth is that another great crisis is rapidly approaching, and we are in far worse shape financially than we were back in 2008.

Don’t get blindsided by what is ahead.  Evidence of the coming catastrophe is all around you.