12 Signs That The Economy Is Seriously Slowing Down As 2020 Begins

Lost in all of the headlines about Iran and impeachment is the fact that the U.S. economic slowdown which began during the latter stages of last year appears to be accelerating.  The final numbers which will tell us if we are officially in a recession at this moment won’t be released until months from now, but for millions upon millions of Americans it definitely feels like one has already started.  Yes, the stock market has been soaring, but at this point the stock market has become completely divorced from economic reality.  And as you will see later in this article, stock prices are now the most overvalued that they have ever been in all of American history.

But before we get to that, let’s talk about what is happening in the real economy.

The following are 12 signs that the economy is seriously slowing down as 2020 begins…

#1 The U.S. Manufacturing Purchasing Managers Index has been in contraction for 5 months in a row, and it is now at the lowest level we have seen since June 2009.

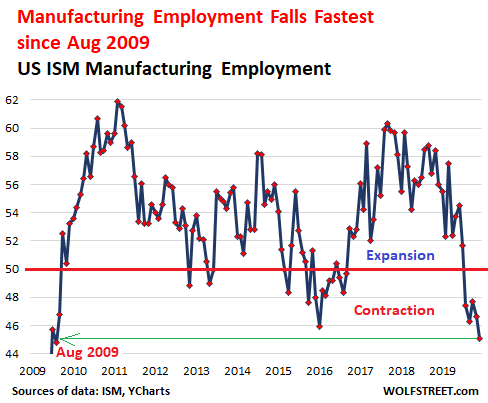
#2 Last month, manufacturing employment fell at the fastest pace we have seen since August 2009.

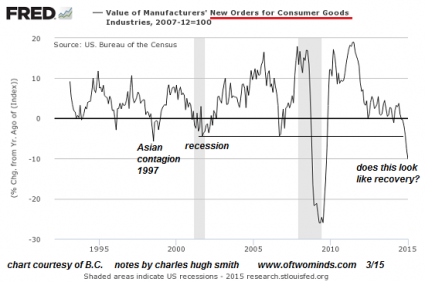
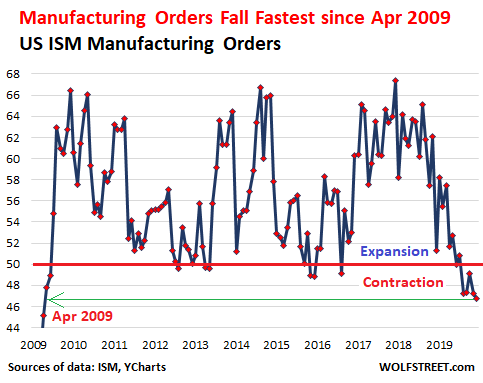
#3 Last month, new manufacturing orders fell at the fastest pace we have seen since April 2009.

#4 Chicago PMI has been contracting for 4 months in a row.

#5 European manufacturing PMI declined again in December.

#6 Borden Dairy, one of the largest dairy companies in the entire world, declared bankruptcy just a few days ago.

#7 Earlier this month, the Baltic Dry Index had its worst day in 6 years.

#8 Overall, the decline in the Baltic Dry Index this month is the largest that we have seen since 2008.

#9 The auto recession just continues to get even worse.  Thanks to the substantial slowdown we witnessed during the second half of 2019, the total number of cars and trucks sold in the United States during all of 2019 was actually below the level that we witnessed back in 2000 when our population was significantly smaller.

#10 Used heavy duty truck prices have fallen “as much as 50%“.

#11 Macy’s just announced that they will be closing 28 stores.

#12 To start the year, AT&T is laying off thousands of workers, and according to Robert Reich those being laid off “will have to train their foreign replacements“.

Of course many of the “experts” continue to assure us that everything will be just fine.

In fact, one panel of “experts” recently came to the conclusion that there is “almost no chance of a recession this year”.

That would be absolutely wonderful news if it was true.

Sadly, the numbers that I just shared with you tell a completely different story.  They tell the story of an economy that is most definitely heading for a recession.

And according to John Williams of shadowstats.com, if the government was using honest numbers they would show that we are actually in a recession right now.

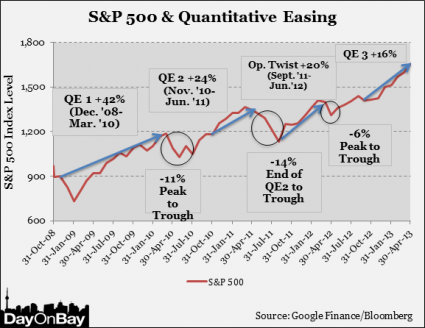
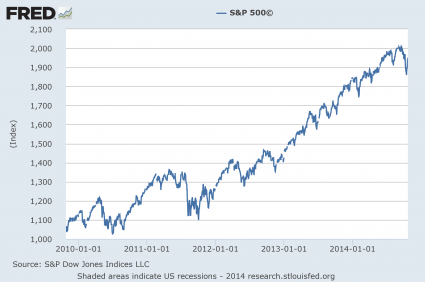
But what about the stock market?

Shouldn’t the fact that stock prices have been soaring be seen as an optimistic sign?

Well, there have been a few other stock bubbles of this nature throughout our history, and all of them have ended very badly.

In 1929, stock prices were at an all-time record high and it seemed like the economic good times would never end.

But then the stock market crashed and we plummeted into the Great Depression of the 1930s.

In 2000, the dotcom bubble pushed stock prices to absolutely absurd heights, but then stock prices quickly collapsed when the bubble burst and the U.S. economy fell into a very painful recession.

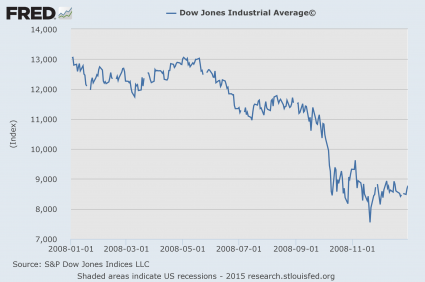
During the years leading up to 2008, stock prices once again rose to dizzying levels and it seemed like the party would last indefinitely.

But then the financial crisis struck, and the Great Recession of 2008 and 2009 was the most excruciating economic downturn our nation has experienced since the 1930s.

Unfortunately, we are even more primed for a stock market crash now than we were in any of the previous examples that I just shared.

So how do I know this?

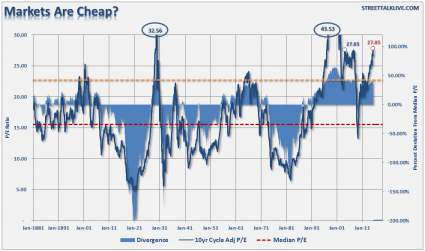
Well, for one thing P/E ratios have become ridiculously inflated.  The following comes from Marketwatch

Indeed stocks are overvalued according to the popular measure of price-to-earnings (P/E) — which compares the price of one share of stock to one year of per-share earnings relative to recent history. The S&P 500 index SPX, -0.29% is trading at 18.6 times forward earnings, according to FactSet data, above the average ratio of 16.7 during the past five years and 14.9 over the past ten.

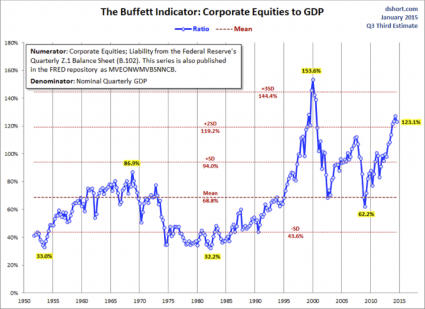
In addition, price-to-sales ratios for the S&P 500 are now at the highest level in all of U.S. history

The above chart, from Ned Davis Research, shows that price relative to sales for the S&P 500 is at a record high, “well in excess of what they were in 2000 or 2007 at those peaks,” wrote Ned Davis in a Wednesday note to clients.

Other measures, like the median price to earnings ratio — which exclude the skewed effects of very profitable and very unprofitable companies — shows the S&P 500 overvalued by nearly 30% versus the typical valuation level seen since 1964.

In other words, in the entire history of the United States stock prices have never been more overvalued than they are at this moment.

And every other time we have seen stock price ratios get this high, an absolutely horrifying stock market crash has followed.

The optimists are insisting that things will somehow turn out differently this time.

They assure us that everything is under control and that very bright days are ahead.

You can believe them if you want, but every indicator is pointing in the opposite direction.

About the Author: I am a voice crying out for change in a society that generally seems content to stay asleep. My name is Michael Snyder and I am the publisher of The Economic Collapse Blog, End Of The American Dream and The Most Important News, and the articles that I publish on those sites are republished on dozens of other prominent websites all over the globe. I have written four books that are available on Amazon.com including The Beginning Of The End, Get Prepared Now, and Living A Life That Really Matters. (#CommissionsEarned) By purchasing those books you help to support my work. I always freely and happily allow others to republish my articles on their own websites, but due to government regulations I need those that republish my articles to include this “About the Author” section with each article. In order to comply with those government regulations, I need to tell you that the controversial opinions in this article are mine alone and do not necessarily reflect the views of the websites where my work is republished. This article may contain opinions on political matters, but it is not intended to promote the candidacy of any particular political candidate. The material contained in this article is for general information purposes only, and readers should consult licensed professionals before making any legal, business, financial or health decisions. Those responding to this article by making comments are solely responsible for their viewpoints, and those viewpoints do not necessarily represent the viewpoints of Michael Snyder or the operators of the websites where my work is republished. I encourage you to follow me on social media on Facebook and Twitter, and any way that you can share these articles with others is a great help.

Corporations Are Defaulting On Their Debts Like It’s 2008 All Over Again

Corporate Debt Defaults - Public DomainThe Dow closed above 18,000 on Monday for the first time since July.  Isn’t that great news?  I truly wish that it was.  If the Dow actually reflected economic reality, I could stop writing about “economic collapse” and start blogging about cats or football.  Unfortunately, the stock market and the economy are moving in two completely different directions right now.  Even as stock prices soar, big corporations are defaulting on their debts at a level that we have not seen since the last financial crisis.  In fact, this wave of debt defaults have become so dramatic that even USA Today is reporting on it

Get ready to step over some landmines, investors. The number of companies defaulting on their debt is hitting levels not seen since the financial crisis, and it’s not just a problem for bondholders.

So far this year, 46 companies have defaulted on their debt, the highest level since 2009, according to S&P Ratings Services. Five companies defaulted this week, based on the latest data available from S&P Ratings Services. That includes New Jersey-based specialty chemical company Vertellus Specialties and Ohio-based iron ore producer Cliffs Natural. Of the world’s defaults this year, 37 are of companies based in the U.S.

Meanwhile, coal producer Peabody Energy (BTU) and surfwear seller Pacific Sunwear (PSUN) this week filed plans for bankruptcy protection. Shares of Peabody have dropped 97% over the past year to $2 a share and Pacific Sunwear stock is off 98% to 4 cents a share.

A lot of big companies in this country have fallen on hard times, and it looks like bankruptcy attorneys are going to be absolutely swamped with work for the foreseeable future.

So why are stock prices soaring right now?  After all, it doesn’t seem to make any sense whatsoever.

And it isn’t just a few bad apples that we are talking about.  All across the spectrum, corporate revenues and corporate earnings are down.  At this point, earnings for companies on the S&P 500 have plunged a total of 18.5 percent from their peak in late 2014, and it is being projected that corporate earnings overall will be down 8.5 percent for the first quarter of 2016 compared to one year ago.

As earnings decline, a lot of big companies are getting into trouble with debt, and we have already seen a very large number of corporate debt downgrades.  In recent interviews, I have been bringing up the fact that the average rating on U.S. corporate debt has now fallen to “BB”, which is already lower than it was at any point during the last financial crisis.

A lot of people don’t seem to believe me when I share that fact, but it is absolutely true.

One of the big reasons why corporate debt is being downgraded is because a lot of these big companies have been going into enormous amounts of debt in order to buy back their own stock.  The following comes from Wolf Richter

Downgrades ascribed to “shareholder compensation,” as Moody’s calls share buybacks and dividends, have been soaring, according to John Lonski, Chief Economist at Moody’s Capital Markets Research. The moving 12-month sum of Moody’s credit rating downgrades of US companies, jumped from 32 in March 2015, to 48 in December 2015, and to 61 in March 2016, nearly doubling within a year.

The last time the number of downgrades attributed to financial engineering reached 61 was in early 2007. It would hit its peak of 79 in mid- 2007, a few months before the beginning of the Great Recession in Q4 2007. At the time, stocks were on the verge of commencing their epic crash.

When corporations go into the market and buy back their own stock, they are slowly cannibalizing themselves.  But we have seen these stock buybacks soar to record levels for a couple of reasons.  Number one, big investors want to see stock prices go up, and so big investors tend to really like these stock buybacks and will generally support corporate executives that wish to engage in doing this.  Number two, if you are a greedy corporate executive that is heavily compensated by stock options, you very much want to see the stock price go up as well.

So the name of the game is greed, and stock buybacks have been fueling much of the rise in U.S. stock prices that we have been seeing recently.

However, the truth is that nothing in the financial world lasts forever, and this irrational bubble will ultimately come to an end as well.

Earlier today, I am across an article that included a comment from Michael Hartnett of Bank of America Merrill Lynch.  He believes that there are a lot of parallels between what is happening today and the period of time that immediately preceded the bursting of the dotcom bubble

Back then, as could be the case today, a bull market & a US-led economic recovery was rudely interrupted by a crisis in Emerging Markets. The crisis threatened to hurt Main Street via Wall Street (the Nasdaq fell 33% between Jul-Oct 1998, when [Long-Term Capital Management] went under). Policy makers panicked and monetary policy was eased (with hindsight unnecessarily). Fresh liquidity combined with apocalyptic investor sentiment very quickly morphed into a violent but narrow equity bull market/bubble in 1998/99, one which ultimately took valuations & interest rates sharply higher to levels that eventually caused a “pop”.

Like Hartnett, I definitely believe that a major “pop” is on the way, although I would like for it to be delayed for as long as possible.

Someday we will look back on these times with utter amazement.  It has been absolutely incredible how the financial markets have been able to defy economic reality for so long.

But they can’t do it forever, and according to a brand new CNN survey Americans are becoming increasingly pessimistic about where the real economy is heading…

In a new CNNMoney/E*Trade survey of Americans who have at least $10,000 in an online trading account, over half (52%) gave the U.S. economy as a “C” grade. Another 15% rated the economy a “D” or “F.”

This gloom persists despite the fact that the stock market is on the upswing again. The Dow topped 18,000 Monday for the first time since July 2015.

If some Americans think that the U.S. economy deserves a “D” or an “F” grade right now, just wait until they see what is in our immediate future.

Personally, I give our economy an “A” for being able to maintain our unsustainable debt-fueled standard of living for as long as it has.  Somehow we have managed to consume far more than we produce for decades, and the largest debt bubble in the history of the planet just keeps getting bigger and bigger and bigger.

Of course we are very much living on borrowed time at this point, but I truly hope that the bubble economy can keep going for at least a little while longer, because nobody should want to see what is coming afterwards.

*About the author: Michael Snyder is the founder and publisher of The Economic Collapse Blog. Michael’s controversial new book about Bible prophecy entitled “The Rapture Verdict” is available in paperback and for the Kindle on Amazon.com.*

If Anyone Doubts That We Are In A Stock Market Bubble, Show Them This Article

Bubble In Hands - Public DomainThe higher financial markets rise, the harder they fall.  By any objective measurement, the stock market is currently well into bubble territory.  Anyone should be able to see this – all you have to do is look at the charts.  Sadly, most of us never seem to learn from history.  Most of us want to believe that somehow “things are different this time”.  Well, about the only thing that is different this time is that our economy is in far worse shape than it was just prior to the last major financial crisis.  That means that we are more vulnerable and will almost certainly endure even more damage this time around.  It would be one thing if stocks were soaring because the U.S. economy as a whole was doing extremely well.  But we all know that isn’t true.  Instead, what we have been experiencing is clearly artificial market behavior that has nothing to do with economic reality.  In other words, we are dealing with an irrational financial bubble, and all irrational financial bubbles eventually burst.  And as I wrote about yesterday, the way that stocks have moved so far this year is eerily reminiscent of the way that stocks moved in early 2008.  The warning signs are there – if you are willing to look at them.

The first chart that I want to share with you today comes from Doug Short.  It is a chart that shows that the ratio of corporate equities (stocks) to GDP is the second highest that it has been since 1950.  The only other time it has been higher was just before the dotcom bubble burst…

The Buffett Indicator from Doug Short

Does that look like a bubble to you?

It sure looks like a bubble to me.

In order for the corporate equities to GDP ratio to get back to the mean (average) level, stock prices would have to fall nearly 50 percent.

If that happens, people will be calling it a crash, but in truth it would just be a return to normalcy.

This next chart comes from Phoenix Capital Research.  The CAPE ratio (cyclically adjusted price-to-earnings ratio) is considered to be an extremely accurate measure of the true value of stocks…

As I’ve noted before, the single best predictor of stock market performance is the cyclically adjusted price-to-earnings ratio or CAPE ratio.

Corporate earnings are heavily influenced by the business cycle. Typically the US experiences a boom and bust once every ten years or so. As such, companies will naturally have higher P/E’s at some points and lower P/E’s at other. This is based solely on the business cycle and nothing else.

CAPE adjusts for this by measuring the price of stocks against the average of ten years’ worth of earnings, adjusted for inflation. By doing this, it presents you with a clearer, more objective picture of a company’s ability to produce cash in any economic environment.

Based on a study completed Vanguard, CAPE was the single best metric for measuring future stock returns.

When the CAPE ratio is too high, that means that stocks are overpriced and are not a good value.  And right now the CAPE ratio is the 3rd highest that it has been since 1890.  That only times it has been higher than this were in 1929 (we all remember what happened then) and just before the dotcom bubble burst…

CAPE - Phoenix Capital Research

The funny thing is that stocks have continued to rise even as corporate revenues have begun to fall.

According to Wolf Richter, in the first quarter of 2015 corporate revenues are projected to decline at the fastest pace that we have seen since the depths of the last recession…

Week after week, corporations and analysts have been whittling down their estimates. By now, revenues of the S&P 500 companies are expected to decline 2.8% in Q1 from a year ago – the worst year-over-year decline since Q3 of crisis year 2009.

This next chart I want to share with you shows how the Nasdaq has performed over the past decade.  Looking at this chart alone, you would think that the U.S. economy must have been absolutely roaring since the end of the last recession.  But what is really going on is rampant speculation.  Some of the tech companies that make up the Nasdaq are not making any profits at all and yet they are supposedly worth billions of dollars.  If you cannot see a bubble in this chart, you need to get your vision checked…

NASDAQ Chart

And this kind of irrational euphoria is not just happening in the United States.

For example, Chinese stocks are up nearly 80 percent over the past nine months.

Meanwhile, the overall Chinese economy is growing at the slowest pace that we have seen in about 20 years.

Right now, we are in the calm before the storm.  We are right at the door of the next great financial crisis, and most of the people that work in the industry know this.

And once in a while they let the cat out of the bag.

For example, consider what Hans-Jörg Vetter, the CEO of Landesbank Baden-Württemberg in Germany, had to say during one recent press conference

“Risk is no longer priced in,” he said. And these investors aren’t paid for the risks they’re taking. This applies to all asset classes, he said. The stock and the bond markets, he said, are now both seeing “the mother of all bubbles.”

This can’t go on forever. Or for very long. But he couldn’t see the future either and pin down a date, which is what everyone wants to know so that they can all get out in time. “I cannot tell you when it will rumble,” he said, “but eventually it will rumble again.”

By “again” he meant the sort of thing that had taken the bank down last time, the Financial Crisis. It had been triggered by horrendous risk-taking, where risks hadn’t been priced into all kinds of securities. When those securities – mortgage-backed securities, for example, that were hiding the inherent risks under a triple-A rating – blew up, banks toppled.

What Vetter is telling us is what I have been warning about for a long time.

Another great stock market crash is coming.

It is just a matter of time.

The Stock Market In 2015 Is Starting To Look Remarkably Similar To The Stock Market In 2008

Bubble Mirror - Public DomainAre we watching a replay of the last financial crisis?  Over the past six months, the price of oil has collapsed, the U.S. dollar has soared, and a whole bunch of other patterns that we witnessed just before the stock market crash of 2008 are repeating once again.  But what we have not seen yet is the actual stock market crash.  So will there be one this year?  In this article, I am going to compare the performance of the Dow Jones Industrial Average during the first three months of 2008 to the performance of the Dow Jones Industrial Average during the first three months of 2015.  As you will see, there are some striking similarities.  And without a doubt, we are overdue for a major market downturn.  The S&P 500 has risen for six years in a row, but it has never had seven up years consecutively.  In addition, there has not even been a 10 percent stock market “correction” is almost three and a half years.  So will stocks be able to continue to defy both gravity and the forces of economic reality?  Only time will tell.

Below is a chart that shows how the Dow Jones Industrial Average performed during the first three months of 2008.  It was a time of increased volatility, but the market pretty much went nowhere.  This is typical of what we see in the months leading up to a market crash.  The markets start getting really choppy with large ups and large downs…

Dow First 3 Months Of 2008

This next chart shows how the Dow Jones Industrial Average has performed during the first three months of 2015.  Once again, we are witnessing a time of increased volatility, but the market is not really going anywhere.  In fact, after falling about 200 points on Tuesday (not shown on this chart) it is just barely below where it started the year…

Dow First 3 Months Of 2015

When the market becomes quite restless but it doesn’t really move anywhere, that is a sign that we have reached a turning point.  The following is what a recent CNN article had to say about the rising volatility that we have been witnessing…

The Dow fell nearly 3.7% in January, surged 5.6% in February and is down about 2% this month. The S&P 500 and Nasdaq have gone through similar sentiment swings. The Dow ended the quarter slightly in the red while the S&P 500 and Nasdaq were up a little bit.

Charles Schwab chief investment officer Liz Ann Sonders summed up this volatility the best — with a nod to U2. “Running to Stand Still: Wild Swings Taking Market Nowhere” is the title of her most recent market commentary.

What can investors expect for the rest of 2015? Probably a lot more of the same.

Now let’s look at a chart for the entire year of 2008.  After peaking for the year in early May, the Dow started to slide.  Things started to get really crazy in September, and by the end of the year the U.S. economy was plunged into the greatest crisis since the Great Depression…

Dow Full Year Of 2008

Will the rest of 2015 follow a similar pattern?

A lot of investors are actually betting that this will be the case.

Right now, hundreds of millions of dollars are flowing into VXX – an ETF that makes money when the Chicago Board Options Exchange Volatility Index goes up.  In other words, these investors are betting that we are going to see a lot more stock market volatility in the weeks and months to come.

And as I have said so many times before, stocks tend to rise in calm markets and they tend to fall when the markets become volatile.

So essentially these investors are betting that we are headed for a stock market crash.

The following is more on the massive inflow of money into VXX that we have been seeing from the Crux

Ways to speculate on how noisy the stock market will be have exploded in the last decade with the advent of products tied to the Chicago Board Options Exchange Volatility Index. Strategies include relatively simple hedges against equity losses, such as owning a security that aims to mimic the VIX.

VXX, one of the most popular ways to bet on bigger market swings, has absorbed $715 million in seven consecutive weeks of inflows, its longest streak of inflows since one ending in July 2012. The infusion of fresh cash has continued this week, swelling its market value to $1.5 billion, the highest since September 2013.

At the same time, short-sellers in VXX — people effectively betting the bull market will persist — have dropped out. Short interest has slid 35 percent since October, falling to the lowest in more than seven months last week, data compiled by Markit Ltd. show.

And many of the exact same people that warned us about the financial crisis of 2008 in advance are warning that another crisis is rapidly approaching.  For example, check out the following quote from Ann Pettifor that recently appeared in an article in the Guardian

As Janet Yellen’s Federal Reserve prepares to raise interest rates, boosting the value of the dollar, while the plunging price of crude puts intense pressure on the finances of oil-exporting countries, there are growing fears of a new debt crisis in the making.

Ann Pettifor of Prime Economics, who foreshadowed the credit crunch in her 2003 book The Coming First World Debt Crisis, says: “We’re going to have another financial crisis. Brazil’s already in great trouble with the strength of the dollar; I dread to think what’s happening in South Africa; then there’s Malaysia. We’re back to where we were, and that for me is really frightening.”

Pettifor is right on two counts – another major financial crisis is approaching, and it is going to be global in scope.

Before I end this article, there are two more items that I would like to share with you.

Firstly, it is being reported that the IPO market has really cooled off in 2015.  When the number of companies going public starts to decline, that is a clear sign that a stock market bubble is on borrowed time.  The following comes from Business Insider

The number of US companies going public has really dropped off lately.

“After a record year in 2014, the IPO market slowed dramatically in the first quarter of 2015,” Renaissance Capital analysts said.

The first quarter of 2015, which ended Tuesday, was the slowest quarter for IPOs since the first quarter of 2013. While stock prices have been near all-time highs, market volatility has been escalating, turning companies off from trying to unload shares onto the public markets.

Secondly, the San Francisco housing market has been a pretty reliable indicator of previous economic booms and busts.  The San Francisco housing market started to cool off before the dotcom bubble burst, it started to cool off before the stock market crash of 2008, and now it is cooling off once again.  The following chart comes from Zero Hedge

San Francisco - Zero Hedge

The warning signs are there.

But as with so many other things in life, most people are going to end up believing precisely what they want to believe.

So what do you believe about what the rest of the year will bring?  Please feel free to share your thoughts by posting a comment below…

7 Signs That A Stock Market Peak Is Happening Right Now

Stock Market Crash - Public DomainIs this the end of the last great run for the U.S. stock market?  Are we witnessing classic “peaking behavior” that is similar to what occurred just before other major stock market crashes?  Throughout 2014 and for the early stages of 2015, stocks have been on quite a tear.  Even though the overall U.S. economy continues to be deeply troubled, we have seen the Dow, the S&P 500 and the Nasdaq set record after record.  But no bull market lasts forever – particularly one that has no relation to economic reality whatsoever.  This false bubble of financial prosperity has been enjoyable, and even I wish that it could last much longer.  But there comes a time when we all must face reality, and the cold, hard facts are telling us that this party is about to end.  The following are 7 signs that a stock market peak is happening right now…

#1 Just before a stock market crash, price/earnings ratios tend to spike, and that is precisely what we are witnessing.  The following commentary and chart come from Lance Roberts

The chart below shows Dr. Robert Shiller’s cyclically adjusted P/E ratio. The problem is that current valuations only appear cheap when compared to the peak in 2000. In order to put valuations into perspective, I have capped P/E’s at 30x trailing earnings. The dashed orange line measures 23x earnings which has been the level where secular bull markets have previously ended. I have noted the peak valuations in periods that have exceeded that 30x earnings.

markets are cheap - StreetTalkLive

At 27.85x current earning the markets are currently at valuation levels where previous bull markets have ended rather than continued. Furthermore, the markets have exceeded the pre-financial crisis peak of 27.65x earnings. If earnings continue to deteriorate, market valuations could rise rapidly even if prices remain stagnant.

#2 The average bull market lasts for approximately 3.8 years. The current bull market has already lasted for six years.

#3 The median total gain during a bull market is 101.5 percent.  For this bull market, it has been 213 percent.

#4 Usually before a stock market crash we see a divergence between the relative strength index and the stock market itself.  This happened prior to the bursting of the dotcom bubble, it happened prior to the crash of 2008, and it is happening again right now

The first technical warning sign that we should heed is marked by a significant divergence between the relative strength index (RSI) and the market itself. This is noted by a declining pattern of lower highs in the RSI as stocks continue to make higher highs, a sign that the market is “topping out”. In the late ‘90s this divergence persisted for many years as the tech bubble reached epic valuation levels. In 2007 this divergence lasted over a much shorter period (6 months) before the market finally peaked and succumbed to massive selling. With last month’s strong rally to new records, we now have a confirmed divergence between the long-term relative strength index and the market’s price action.

#5 In the past, peaks in margin debt have been very closely associated with stock market peaks.  The following chart comes from Doug Short, and I included it in a previous article

Margin Debt

#6 As I have discussed previously, we usually witness a spike in 10 year Treasury yields just about the time that the stock market is peaking right before a crash.

Well, according to Business Insider, we just saw the largest 5 week rate rally in two decades…

Lots of guys and gals went home this past weekend thinking about the implications of the recent rise in the 10-year Treasury bond’s yield.

Chris Kimble notes it was the biggest 5-week rate rally in twenty years!

#7 A lot of momentum indicators seem to be telling us that we are rapidly approaching a turning point for stocks.  For example, James Stack, the editor of InvesTech Research, says that the Coppock Guide is warning us of “an impending bear market on the not-too-distant horizon”

A momentum indicator dubbed the Coppock Guide, which serves as “a barometer of the market’s emotional state,” has also peaked, Stack says. The indicator, which, “tracks the ebb and flow of equity markets from one psychological extreme to another,” is also flashing a warning flag.

The Coppock Guide’s chart pattern is flashing a “double top,”  which suggests that “psychological excesses are present” and that “secondary momentum has peaked” in this bull market, according to Stack.

“All of this is just another reason for concern about an impending bear market on the not-too-distant horizon,” Stack writes.

So if we are to see a stock market crash soon, when will it happen?

Well, the truth is that nobody knows for certain.

It could happen this week, or it could be six months from now.

In fact, a whole lot of people are starting to point to the second half of 2015 as a danger zone.  For example, just consider the words of David Morgan

“Momentum is one indicator and the money supply. Also, when I made my forecast, there is a big seasonality, and part of it is strict analytical detail and part of it is being in this market for 40 years. I got a pretty good idea of what is going on out there and the feedback I get. . . . I’m in Europe, I’m in Asia, I’m in South America, I’m in Mexico, I’m in Canada; and so, I get a global feel, if you will, for what people are really thinking and really dealing with. It’s like a barometer reading, and I feel there are more and more tensions all the time and less and less solutions. It’s a fundamental take on how fed up people are on a global basis. Based on that, it seems to me as I said in the January issue of the Morgan Report, September is going to be the point where people have had it.”

Time will tell if Morgan was right.

But without a doubt, lots of economic warning signs are starting to pop up.

One that is particularly troubling is the decline in new orders for consumer goods.  This is something that Charles Hugh-Smith pointed out in one of his recent articles…

The financial news is astonishingly rosy: record trade surpluses in China, positive surprises in Europe, the best run of new jobs added to the U.S. economy since the go-go 1990s, and the gift that keeps on giving to consumers everywhere, low oil prices.

So if everything is so fantastic, why are new orders cratering? New orders are a snapshot of future demand, as opposed to current retail sales or orders that have been delivered.

Posted below is a chart that he included with his recent article.  As you can see, the only time things have been worse in recent decades was during the depths of the last financial crisis…

Charles Hugh-Smith New Orders

To me, it very much appears that time is running out for this bubble of false prosperity that we have been living in.

But what do you think?  Please feel free to contribute to the discussion by posting a comment below…

How Will The Stock Market React To The End Of Quantitative Easing?

Stock Market Crash - Public DomainIt is widely expected that the Federal Reserve is going to announce the end of quantitative easing this week.  Will this represent a major turning point for the stock market?  As you will see below, since 2008 stocks have risen dramatically throughout every stage of quantitative easing.  But when the various phases of quantitative easing have ended, stocks have always responded by declining substantially.  The only thing that caused stocks to eventually start rising again was a new round of quantitative easing.  So what will happen this time?  That is a very good question.  What we do know is that the the performance of the stock market has become completely divorced from economic reality, and in recent weeks there have been signs of market turmoil that we have not seen in years.  Could the end of quantitative easing be the thing that finally pushes the financial markets over the edge?

After all this time, many Americans still don’t understand what quantitative easing actually is.  Since the end of 2008, the Federal Reserve has injected approximately 3.5 trillion dollars into the financial system.  Of course the Federal Reserve didn’t actually have 3.5 trillion dollars.  The Fed created all of this money out of thin air and used it to buy government bonds and mortgage-backed securities.

If that sounds like “cheating” to you, that is because it is cheating.  If you or I tried to print money, we would be put in prison.  When the Federal Reserve does it, it is called “economic stimulus”.

But the overall economy has not been helped much at all.  If you doubt this, just look at these charts.

Instead, what all of this “easy money” has done is fuel the greatest stock market bubble in history.

As you can see from the chart below, every round of quantitative easing has driven the S&P 500 much higher.  And when each round of quantitative easing has finally ended, stocks have declined substantially

Chart By DayOnBay

And of course the chart above tells only part of the story.  Since April 2013, the S&P 500 has gone much higher…

S&P 500

If someone from another planet looked at that chart, they would be tempted to think that the U.S. economy must be expanding like crazy.

But of course that is not happening.

This market binge has been solely fueled by reckless money printing by the Federal Reserve.  It is not backed up by economic fundamentals in any way, shape or form.

And now that quantitative easing is ending, many are wondering if the party is over.

For example, just check out what CNN is saying about the matter…

Even in this bull market, all good things must come to an end.

The Federal Reserve is expected to close a chapter in history this week and announce the conclusion of its massive stimulus program. Known as quantitative easing, the program is widely credited with driving investors back into stocks in the aftermath of the financial crisis.

“I think to some extent quantitative easing has provided an assurance to investors that (has) kept them optimistic,” said Bruce McCain, Chief Investment Strategist of Key Private Bank in Cleveland, Ohio. “Now we’re going to have to see whether investors can ride without training wheels.”

Everyone knows that quantitative easing was a massive gift to those that own stocks.

So how will the stock market respond now that the monetary heroin is ending?

We shall see.

Meanwhile, deflationary pressures are already starting to take hold around the rest of the globe.  The following is an excerpt from a recent Reuters report

After months of focus on slack in U.S. labor markets, the Federal Reserve faces a new challenge: the possibility that weak inflation may be so firmly entrenched it upends the return to normal monetary policy.

The soft global inflation backdrop, from sliding oil prices to stagnant wages in advanced economies, has triggered debate over whether the Fed and its peers merely need to wait for a slow-motion business cycle to improve, or face a shift in the underlying nature of inflation after the global recession.

That uncertainty has become the Fed’s chief concern in recent weeks, likely to shape upcoming policy statements and delay even further the moment when interest rates, pinned near zero for nearly six years, will start rising again.

If the Federal Reserve and other global central banks were not printing money like mad, the global economy would have almost certainly entered a deflationary depression by now.

But all the Federal Reserve and other global central banks have done is put off the inevitable and make our long-term problems even worse.

Instead of fixing the fundamental problems that caused the great financial crash of 2008, the central bankers decided to try to paper over our problems instead.  They flooded the global financial system with easy money, but today our financial system is shakier than ever.

In fact, we just learned that 10 percent of the biggest banks in Europe have failed their stress tests and must raise more capital…

The European Central Bank says 13 of Europe’s 130 biggest banks have flunked an in-depth review of their finances and must increase their capital buffers against losses by 10 billion euros ($12.5 billion).

The ECB said 25 banks in all were found to need stronger buffers — but that 12 have already made up their shortfall during the months in which the ECB was carrying out its review. The remaining 13 now have two weeks to tell the ECB how they plan to increase their capital buffers.

Most people do not realize how vulnerable our financial system truly is.  It is essentially a pyramid of debt and credit that could fall apart at any time.

Right now, the “too big to fail” banks account for 42 percent of all loans and 67 percent of all banking assets in the United States.

Without those banks, we essentially do not have an economy.

But instead of being careful, those banks have taken recklessness to unprecedented heights.

At this moment, five of the “too big to fail” banks each have more than 40 trillion dollars of exposure to derivatives.

Most Americans don’t even understand what derivatives are, but when the next great financial crisis strikes we are going to be hearing a whole lot about them.

The big banks have transformed Wall Street into the biggest casino in the history of the planet, and there is no way that this is going to end well.

A great collapse is coming.

It is just a matter of time.

Mass Carnage: Stocks, Bonds, Gold, Silver, Europe And Japan All Get Pummeled

Car AccidentCan you smell that?  It is the smell of panic in the air.  As I have noted before, when financial markets catch up to economic reality they tend to do so very rapidly.  Normally we don’t see virtually all asset classes get slammed at the same time, but the bucket of cold water that Federal Reserve Chairman Ben Bernanke threw on global financial markets on Wednesday has set off an epic temper tantrum.  On Thursday, U.S. stocks, European stocks, Asian stocks, gold, silver and government bonds all over the planet all got absolutely shredded.  This is not normal market activity.  Unfortunately, there is nothing “normal” about our financial markets anymore.  Over the past several years they have been grossly twisted and distorted by the Federal Reserve and by the other major central banks around the globe.  Did the central bankers really believe that there wouldn’t be a great price to pay for messing with the markets?  The behavior that we have been watching this week is the kind of behavior that one would expect at the beginning of a financial panic.  Dick Bove, the vice president of equity research at Rafferty Capital Markets, told CNBC that what we are witnessing right now “is not normal. It is not normal for all markets to move in the same direction at the same point in time due to the same development.”  The overriding emotion in the financial world right now is fear.  And fear can cause investors to do some crazy things.  So will global financial markets continue to drop, or will things stabilize for now?  That is a very good question.  But even if there is a respite for a while, it will only be temporary.  More carnage is coming at some point.

What we have witnessed this week very much has the feeling of a turning point.  The euphoria that drove the Dow well over the 15,000 mark is now gone, and investors all over the planet are going into crisis mode.  The following is a summary of the damage that was done on Thursday…

-U.S. stocks had their worst day of the year by a good margin.  The Dow fell 354 points, and that was the biggest one day drop that we have seen since November 2011.  Overall, the Dow has lost more than 550 points over the past two days.

-Thursday was the eighth trading day in a row that we have seen a triple digit move in the Dow either up or down.  That is the longest such streak since October 2011.

-The yield on 10 year U.S. Treasuries went as high as 2.47% before settling back to 2.42%.  That was a level that we have not seen since August 2011, and the 10 year yield is now a full point above the all-time low of 1.4% that we saw back in July 2012.

– The yield on 30 year U.S. Treasuries hit 3.53 percent on Thursday.  That was the first time it had been that high since September 2011.

-The CBOE Volatility Index jumped 28 percent on Thursday.  It hit 20.49, and this was the first time in 2013 that it has risen above 20.  When volatility rises, that means that the markets are getting stressed.

-European stocks got slammed too.  The Bloomberg Europe 500 index fell more than 3 percent on Thursday.  It was the worst day for European stocks in 20 months.

-In London, the FTSE fell about 3 percent.  In Germany, the DAX fell 3.3 percent.  In France, the CAC-40 fell 3.7 percent.

-Things continue to get even worse in Japan.  The Nikkei has fallen close to 17 percent over the past month.

-Brazilian stocks have fallen by about 15 percent over the past month.

-On Thursday the price of gold got absolutely hammered.  Gold was down nearly $100 an ounce.  As I am writing this, it is trading at $1273.60.

-Silver got slammed even more than gold did.  It fell more than 8 percent.  At the moment it is trading at $19.57.  That is ridiculously low.  I have a feeling that anyone that gets into silver now is going to be extremely happy in the long-term if they are able to handle the wild fluctuations in the short-term.

-Manufacturing activity in China is contracting at a rate that we haven’t seen since the middle of the last recession.

-For the week ending June 15th, initial claims for unemployment benefits in the United States rose by about 18,000 from the previous week to 354,000.  This is a number that investors are going to be watching closely in the months ahead.

Needless to say, Thursday was the type of day that investors don’t see too often.  The following is what one stock trader told CNBC

“It’s freaking, crazy now,” said one stock trader during the 3 p.m. ET hour as the Dow sunk more than 350 points. “Even defensive sectors are getting smoked. The super broad-based sell off between commodities, bonds, equities – I wouldn’t say it’s panic, but we’ve seen aggressive selling on the lows.”

Unfortunately, this may just be the beginning.

In fact, Mark J. Grant has suggested that we may see even more panic in the short-term…

Yesterday was the first day of the reversal. There will be more days to come.

What you are seeing, in the first instance, is leverage coming off the table. With short term interest rates right off of Kelvin’s absolute Zero there was been massive leverage utilized in both the bond and equity markets. While it cannot be quantified I can tell you, dealing with so many institutional investors, that the amount of leverage on the books is giant and is now going to get covered. It will not be pretty and it will be a rush through the exit doors as the fire alarm has been pulled by the Fed and the alarms are ringing. There is also an additional problem here.

The Street is not what it was. There is not enough liquidity in the major Wall Street banks, any longer, to deal with the amount of securities that will be thrown at them and I expect the down cycle to get exacerbated by this very real issue. Bernanke is no longer at the gate and the Barbarians are going to be out in force.

If we see global interest rates start to shift in a major way, that is going to be huge.

Why?

Well, it is because there are literally hundreds of trillions of dollars worth of interest rate derivatives contracts sitting out there…

The interest rate derivatives market is the largest derivatives market in the world. The Bank for International Settlements estimates that the notional amount outstanding in June 2009 were US$437 trillion for OTC interest rate contracts, and US$342 trillion for OTC interest rate swaps. According to the International Swaps and Derivatives Association, 80% of the world’s top 500 companies as of April 2003 used interest rate derivatives to control their cashflows. This compares with 75% for foreign exchange options, 25% for commodity options and 10% for stock options.

If interest rates begin to swing wildly, that could burst the derivatives bubble that I keep talking about.

And when that house of cards starts falling, we are going to see panic that is going to absolutely dwarf anything that we have seen this week.

So keep watching interest rates, and keep listening for any mention of a problem with “derivatives” in the mainstream media.

When the next great financial crash comes, global credit markets are going to freeze up just like they did in 2008.  That will cause economic activity to grind to a standstill and a period of deflation will be upon us.  Yes, the way that the Federal Reserve and the federal government respond to such a crisis will ultimately cause tremendous inflation, but as I have written about before, deflation will come first.

It would be wise to build up your emergency fund while you still can.  When the next great financial crisis fully erupts a lot of people are going to lose their jobs and for a while it will seem like hardly anyone has any extra money.  If you have stashed some cash away, you will be in better shape than most people.

Crushed Car By UCFFool

11 Economic Crashes That Are Happening RIGHT NOW

11 Economic Crashes That Are Happening RIGHT NOWThe stock market is not crashing yet, but there are lots of other market crashes happening in the financial world right now.  Just like we saw back in 2008, it is taking stocks a little bit of extra time to catch up with economic reality.  But almost everywhere else you look, there are signs that a financial avalanche has begun.  Bitcoins are crashing, gold and silver are plunging, the price of oil and the overall demand for energy continue to decline, markets all over Europe are collapsing and consumer confidence in the United States just had the biggest miss relative to expectations that has ever been recorded.  In many ways, all of this is extremely reminiscent of 2008.  Other than the Bitcoin collapse, almost everything else that is happening now also happened back then.   So does that mean that a horrible stock market crash is coming as well?  Without a doubt, one is coming at some point.  The only question is whether it will be sooner or later.  Meanwhile, there are a whole lot of other economic crashes that deserve out attention at the moment.

The following are 11 economic crashes that are happening RIGHT NOW…

#1 Bitcoins

As I write this, the price of Bitcoins has fallen more than 70 percent from where it was on Wednesday.  This is one of the reasons why I have never recommended Bitcoins to anyone.  Yes, alternative currencies are a good thing, but there are a lot of big problems with Bitcoins.  Why would anyone want to invest in a currency that could lose 70 percent of its purchasing power in just two days?  Why would anyone want to invest in a currency where a single person can arbitrarily decide to suspend trading in that currency at any time?

An article by Mike Adams of Natural News described some of the things that we have learned about Bitcoins this week…

#1) The bitcoin infrastructure cannot handle a selloff. Once the rush for the exits gains momentum, you will not be able to get out. Only those who sell early will be able to exit the market.

#2) The bitcoin infrastructure is subject to the whims of just one person running MTGox who can arbitrarily decide to shut it down whenever he thinks the market needs a “cooling period.” This is nearly equivalent to a financial dictatorship where one person calls the shots.

#3) Every piece of bad news will be “spun” by exchanges like MTGox into good-sounding news. As bitcoin was crashing yesterday by 60% in value in mere hours, MTGox announced it was a “victim of our own success!” So while bitcoin holders watched $1 billion in market valuation evaporate, MTGox called it a success. Gee, then what would you call it when bitcoin loses 99%? A “raging” success?

#2 Gold

The price of gold was down by about 4 percent on Friday.  Gold has now fallen below $1500 an ounce for the first time since July 2011.  Overall, the price of gold has fallen by about 10 percent since the beginning of the year, and it is about 22 percent below the record high set back in September 2011.

Yes, the price of gold is likely being pushed down by the banksters.  And yes, gold is a fantastic investment for the long-term.  But there will be times when the price of gold does fall dramatically just like we saw back in 2008.

#3 Silver

The price of silver fell by about 5 percent on Friday.  If it falls much more it is going to be at a level that presents a historically good buying opportunity.

Just like gold, there will be times when the price of silver swings dramatically.  But the truth is that silver is probably an even better long-term investment than gold is.

#4 Oil

The price of oil declined by about 3 percent on Friday.  Many will consider this a positive thing, but just remember what happened back in 2008.  Back then, the price of oil dropped like a rock.  If the price of oil gets below $80, that could very well be a clear signal that a major economic crisis is about to happen.

#5 Consumer Confidence

As I mentioned above, consumer confidence in the U.S. just had its biggest miss relative to expectations that has ever been recorded.  The following is from an article posted on Zero Hedge on Friday

Well if this doesn’t send the market into all-time record high territory, nothing ever will: seconds ago the UMich Consumer Confidence plummeted from 78.6 to 72.3, on expectations of an unchanged 78.6 print. This was not only a 9 month low in the index, but more importantly the biggest miss to expectations in recorded history!

#6 Retirement Accounts

According to Wells Fargo, the number of Americans taking loans from their 401(k) accounts has risen by 28 percent over the past year…

Through an analysis of participants enrolled in Wells Fargo-administered defined contribution plans, the bank announced today that in the fourth quarter of 2012, there was a 28 percent increase in the number of people taking loans out from their 401(k) and that the average new loan balances increased to $7,126 from those taken out in the fourth quarter of 2011 – a 7% increase from $6,662.

Of the participants who took out loans, the greatest percentage were to people in their 50s (34.2%), followed by those in their 60s (28.9%) and then by those in their 40s (27.3%). The increase among participants in their 50s was nearly double the increase among those under 30. This is based on an analysis of a subset of 1.9 million eligible participants in retirement plans that Wells Fargo administers.

“The increased loan activity particularly among older participants is concerning because those are the years when workers can start to make ‘catch-up’ contributions and really need to focus on preparing for retirement,” said Laurie Nordquist, director of Wells Fargo Retirement.

#7 Casino Spending

Casino spending is declining again.  Many people (including myself) would consider this to be a good thing, but casino spending is also one of the most reliable indicators about the overall health of the economy.  Remember, casino spending crashed during the last financial crisis as well.  That is why it is so alarming that casino spending is now back to levels that we have not seen since the last recession.

#8 Employment In Greece

Over in Europe, things just continue to get worse.  According to numbers that were just released, the unemployment rate in Greece has soared to 27.2 percent, which was up from 25.7 percent the previous month.  That means that the unemployment rate in Greece rose by 1.5 percent in just a single month.  That is not just a crash – that is an avalanche of unemployment.

#9 European Financial Stocks

European financial stocks have been hit particularly hard lately.  And for good reason actually – most of the major banks in Europe are essentially insolvent at this point.  This week, European financial stocks fell to seven month lows, and this is probably only just the beginning.

#10 Spanish Bankruptcies

According to Reuters, the number of Spanish companies going bankrupt has risen by 45 percent over the past year…

A record number of Spanish companies went bust in the first quarter of 2013 as companies remained under intense pressure from tight credit conditions and meager demand, a study showed on Monday.

The 2,564 firms filing for insolvency proceedings in first three months of the year was a 10 percent rise from the previous quarter and a 45 percent increase on the same period in 2012, the survey by credit rating agency Axesor said.

#11 Demand For Energy

Just like we saw back in 2008, the overall demand for energy in the United States is falling rapidly.  There are some shocking charts that prove this that were recently posted on Zero Hedge that you can find right here.

Yes, it is good for people to use a bit less energy, but it is also a clear indication that economic activity is really starting to slow down.

But despite everything that you have just read, the Dow and the S&P 500 have been setting new record highs.

And if you listen to the mainstream media, you would think that this stock market bubble can continue indefinitely.

Fortunately, there are a few voices of reason out there.  For example, just check out what Marc Faber recently told CNBC

In the near-term, the U.S. stock market is overbought and adding that any more near-term gains portend big trouble for the market, “The Gloom, Boom & Doom Report” publisher Marc Faber told CNBC on Monday.

“If we continue to move up, the probability of a crash becomes higher,” Faber predicted in a “Squawk Box” interview, saying it could happen “sometime in the second half of this year.”

As I have written about previously, a bubble is always the biggest right before it bursts.  I hope that we still have at least a little bit more time before it happens, but I wouldn’t count on it.

The economic fundamentals tell us that the stock market should be plunging, not rising.  At some point the boys over on Wall Street will get the message and the market will catch up to reality very, very rapidly.

But for the moment, the American people are feeling really good.  According to CNN, Americans are now more optimistic than they have been in six years…

As the stock market continues to show record highs, the number of Americans who say things are going well in the country has reached 50% for the first time in more than six years, according to a new national survey.

So what do you think will happen for the rest of the year?

Do you think that the good times will continue to roll, or do you believe that the bubble is about to burst?

Please feel free to share your opinion by posting a comment below…

A Market Crash Is Coming