2015 Was The Worst Year For The Stock Market Since 2008

New Year's Eve - Public DomainIt’s official – 2015 was a horrible year for stocks.  On the last day of the year, the Dow Jones Industrial Average was down another 178 points, and overall it was the worst year for the Dow since 2008.  But of course the Dow was far from alone.  The S&P 500, the Russell 2000 and Dow Transports also all had their worst years since 2008.  Isn’t it funny how these things seem to happen every seven years?  But compared to other investments, stocks had a relatively “good” year.  In 2015, junk bonds, oil and industrial commodities all crashed hard – just like they all did just prior to the great stock market crash of 2008.  According to CNN, almost 70 percent of all investors lost money in 2015, and things are unfolding in textbook fashion for much more financial chaos in 2016.

Globally, over the past 12 months we have seen financial shaking unlike anything that we have experienced since the last great financial crisis.  During the month of August markets all over the world started to go haywire, and at one point approximately 11 trillion dollars of financial wealth had been wiped out globally according to author Jonathan Cahn.

Since that time, U.S. stocks rebounded quite a bit, but they still ended red for the year.  Other global markets were not nearly as fortunate.  Some major indexes finished 2015 down 20 percent or more, and European stocks just had their second worst December ever.

I honestly don’t understand the “nothing is happening” crowd.  The numbers clearly tell us that a global financial crisis began in 2015, and it threatens to accelerate greatly as we head into 2016.

Actually, there are a whole lot of people out there that would be truly thankful if “nothing” had happened over the past 12 months.  For example, there are five very unfortunate corporate CEOs that collectively lost 20 billion dollars in 2015…

Five CEOs of companies in the Russell 1000 index, including Nicholas Woodman of camera maker GoPro (GPRO), Sheldon Adelson of casino operator Las Vegas Sands (LVS) and even the famed investor Warren Buffett of Berkshire Hathaway (BRKA), lost more money on their companies’ shares than any other CEOs this year, according to a USA TODAY analysis of data from S&P Capital IQ.

These five CEOs were handed a whopping collective $20 billion loss on their company stock in 2015. Each and every one of these CEOs lost $1 billion or more – based on the average number of shares they’ve owned this year.

The biggest loser of the group was Warren Buffett.

He lost an astounding 7.8 billion dollars in 2015.

Do you think that he believes that “nothing happened” this past year?

And if “nothing happened”, then why are hedge funds “dropping like flies” right now?  The following comes from Zero Hedge

Two days, ago we noted that hedge funds are now dropping like flies in a year in which generating alpha has become virtually impossible for the majority of the vastly overpaid 2 and 20 “smart money” out there (and where levered beta is no longer the “sure thing” it used to be when the Fed was pumping trillions into stocks) when we reported that Seneca Capital, the $500 million multi-strat hedge fund belonging to Doug Hirsh (of Sohn Investment Conference fame), is shutting down.

And just within the last 24 hours, another very prominent hedge fund has collapsed.  SAB Capital, which once managed more than a billion dollars, is shutting down after huge losses this year.  Here is more from Zero Hedge

It turns out that despite our intention, the question was not rhetorical because just a few hours later Bloomberg answered when it reported that the latest hedge fund shutdown casualty was another iconic, long-term investor: Scott Bommer’s SAB Capital, which as of a year ago managed $1.1 billion, and which after 17 years of managing money and after dropping roughly 11% in the first eight month of 2015, has decided to return all outside client money, and converting the hedge fund into a family office (after all one has to preserve one’s offshore tax benefits).

Overall, 674 hedge funds shut down during the first nine months of this year, and the final number for 2015 will actually be far higher because the rate of closings has accelerated as we have approached the end of this calendar year.  When the final numbers come in, I would not be surprised to hear that 1,000 hedge funds had closed up shop in 2015.

Meanwhile, underlying economic conditions continue to deteriorate.

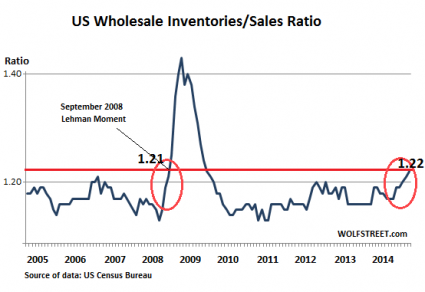
Corporate profits are steadily falling, the bond distress ratio just hit the highest level that we have seen since September 2009, and corporate debt defaults have risen to the highest level that we have seen since the last recession.

And this week we got a couple of new numbers that indicate that the U.S. economy is slowing down much faster than anticipated.

The first big surprise was the Dallas Fed’s general business activity index

The Dallas Fed’s general business activity index plunged to -20.1 in December from -4.9 in November. This was much worse than the -7.0 expected by economists.

Any reading below 0 signals contraction, and this index has been below 0 all year.

The next big surprise was the Chicago purchasing manager index

The Chicago purchasing manager index unexpectedly plunged to 42.9 in December, its lowest reading since July 2009.

Any reading below 50 signals a contraction in business activity.

This was down from 48.7 in November and much worse than the 50.0 expected by economists.

When the final numbers for the fourth quarter are in a few months from now, I believe that they will show that the U.S. economy officially entered recession territory at this time.

And the truth is that deep recessions have already started for some of the other biggest economies on the planet.  For example, I recently wrote about the deep troubles that Canada is now experiencing, and things have already gotten so bad in Brazil that Goldman Sachs is referring to that crisis as “an outright depression“.

Many people seem to assume that since I have a website called “The Economic Collapse Blog” that I must want everything to fall apart.  But that is not true at all.  I love my country, I enjoy my life, and I would be perfectly content to spend 2016 peacefully passing the time here in the mountains with my wonderful wife.  The longer things can stay somewhat “normal”, the better it is for all of us.

Unfortunately, for decades we have been making incredibly foolish decisions as a society, and the consequences of those decisions are now catching up with us in a major way.

Jonathan Cahn likes to say that “a great shaking is coming”, and I very much agree with him.

In fact, I think that it is going to be here a lot sooner than most people think.

So buckle up, because I believe that 2016 is going to be quite a wild ride.

Is The Stock Market Overvalued?

Stock Market Overvalued - Public DomainAre stocks overvalued?  By just about any measure that you could possibly name, stocks are at historically high prices right now.  From a technical standpoint, the stock market is more overvalued today than it was just prior to the last financial crisis.  The only two moments in U.S. history that even compare to our current state of affairs are the run up to the stock market crash of 1929 and the peak of the hysteria just before the dotcom bubble burst.  It is so obvious that stocks are in a bubble that even Janet Yellen has talked about it, but of course she will never admit that the Federal Reserve has played a key role in creating this bubble.  They say that hindsight is 20/20, but what is happening right in front of our eyes in 2015 is so obvious that everyone should be able to see it.  Just like with all other financial bubbles throughout our history, someday people will look back and talk about how stupid we all were.

Why can’t we ever learn from history?  We just keep on making the same mistakes over and over again.  And without a doubt, some of the smartest members of our society are trying to warn us about what is coming.  For example, Yale economics professor Robert Shiller has repeatedly tried to warn us that stocks are overvalued

I think that compared with history, US stocks are overvalued. One way to assess this is by looking at the CAPE (cyclically adjusted P/E) ratio that I created with John Campbell, now at Harvard, 25 years ago. The ratio is defined as the real stock price (using the S&P Composite Stock Price Index deflated by the CPI) divided by the ten-year average of real earnings per share. We have found this ratio to be a good predictor of subsequent stock market returns, especially over the long run. The CAPE ratio has recently been around 27, which is quite high by US historical standards. The only other times it has been that high or higher were in 1929, 2000, and 2007—all moments before market crashes.

But the CAPE ratio is not the only metric I watch. In my book Irrational Exuberance (3rd Ed., Princeton 2015) I discuss several metrics that help judge what’s going on in the market. These include my stock market confidence indices. One of the indicators in that series is based on a single question that I have asked individual and institutional investors over the years along the lines of, “Do you think the stock market is overvalued, undervalued, or about right?” Lately, what I call “valuation confidence” captured by this question has been on a downward trend, and for individual investors recently reached its lowest point since the stock market peak in 2000.

Other analysts prefer to use different valuation indicators than Shiller does.  But no matter which indicators you use, they all show that stocks are tremendously overvalued in mid-2015.  For instance, just consider the following chart.  It comes from Doug Short, and it shows the average of four of his favorite valuation indicators.  As you can see, there is only one other time in all of our history when stocks have been more overvalued than they are today according to the average of these four indicators…

Four Valuation Indicators - Doug Short

Another danger sign that many analysts are pointing to is the dramatic rise in margin debt that we have seen in recent years.  Investors are borrowing tremendous amounts of money to fund purchases of stock.  This is something that we witnessed during the dotcom bubble, it was something that we witnessed just prior to the financial collapse of 2008, and now it is happening again.  In fact, margin debt just surged to a brand new all-time record high.  Once again, the following chart comes from Doug Short

NYSE Margin Debt - Chart by Doug Short

All of this margin debt has helped drive stocks to ridiculous highs, but it can also serve to drive stock prices down very rapidly when the market turns.  This was noted by Henry Blodget of Business Insider in a recent editorial…

What is “margin debt”?

It’s the amount of money stock investors have collectively borrowed via traditional margin accounts to fund stock purchases.

In a bull market, the growth of margin debt serves as a turbocharger that helps drive stock prices higher.

As with a home mortgage, the more investors borrow, the more house or stock they can buy. So as margin debt grows, collective buying power grows. The borrowed money gets used to fund new stock purchases, which helps drives the prices of those stocks higher. The higher prices, in turn, allow traders to borrow more money to fund additional purchases. And so on.

It’s a self-reinforcing cycle.

The trouble is that it’s a self-reinforcing cycle on the way down, too.

If the overall U.S. economy was absolutely booming, these ultra-high stock prices would not be as much of a concern.  But the truth is that the financial markets have become completely divorced from economic reality.  Right now, corporate profits are actually falling and our exports are way down.  U.S. GDP shrunk during the first quarter, and there are a whole host of economic trouble signs on the horizon.  I am calling this a “recession within a recession“, and I believe that we are heading into another major economic downturn.

Unfortunately, our “leaders” are absolutely clueless about what is coming.  They assure us that everything is going to be just fine – just like they did back in 2008 before everything fell apart.  But the truth is that things are already so bad that even the big banks are sounding the alarm.  For instance, just consider the following words from Deutsche Bank

At issue is whether or not the Fed in particular but the market in general has properly understood the nature of the economic problem. The more we dig into this, the more we are afraid that they do not. So aside from a data revision tsunami, we would suggest that the Fed has the outlook not just horribly wrong, but completely misunderstood.

Ultimately, most people believe what they want to believe.

Our politicians want to believe that the economy is going to get better, and so do the bureaucrats over at the Federal Reserve.  The mainstream media wants to put a happy face on things, and they want all of us to continue to have faith in the system.

Unfortunately for them, the system is failing.  I truly do hope that this bubble can last for a few more months, but I don’t see it going on for much longer than that.

The greatest financial crisis in U.S. history is fast approaching, and it is going to be extraordinarily painful.

When it arrives, it is not just going to destroy faith in the system.  In the end, it is going to destroy the system altogether.

Guess What Happened The Last Two Times The S&P 500 Was Up More Than 200% In Six Years?

Question Ball - Public DomainJust a few days ago, the bull market for the S&P 500 turned six years old.  This six year period of time has been great for investors, but what comes next?  On March 9th, 2009 the S&P 500 hit a low of 676.53.  Since that day, it has risen more than 200 percent.  As you will see below, there are only two other times within the last 100 years when the S&P 500 performed this well over a six year time frame.  In both instances, the end result was utter disaster. And as you take in this information, I want you to keep in mind what I said in my previous article entitled “7 Signs That A Stock Market Peak Is Happening Right Now“.  What we are witnessing at this moment is classic “peaking behavior”, and there is a long way to go down from here.  So if historical patterns hold up, those with lots of money in the stock market could soon be in for a whole lot of trouble.

According to Societe Generale analyst Andrew Lapthorne, there was an S&P 500 bull market run of more than 200 percent over a six year time period that ended in 1929.

We all know what happened that year.

And there was another S&P 500 bull market run of more than 200 percent over a six year time period that ended in 1999.  In the end, all of those gains were wiped out when the dotcom bubble burst.

And now we are near the end of another great bull market for the S&P 500.  The following is an excerpt from a recent Business Insider article

“Such a strong six year run up in US equities has only been seen twice since 1900, i.e., back in 1929 and 1999, neither of which ended well,” Lapthorne wrote.

It’s anyone’s guess what happens next. But Lapthorne and his colleagues have slanted bearish.

Best Six Year Performance

So how will this current bull market end?

Needless to say, a lot of people are not very optimistic about that right now.

And there was another very interesting bull market that ended in 1987

On Aug. 12, the S&P 500 dipped to 102.42, setting the stage for the third-biggest bull market in stocks since 1929. Inflation and unemployment fell. In 1984, President Reagan would cruise to reelection with an ad telling voters “It’s morning again in America.” By 1987, the stock market had tripled. Shareholders who were able to see beyond the gloom of the early 1980s reaped a huge return.

Of course a lot of those huge stock market returns were eliminated in a single day.  On October 19th, 1987 the Dow declined by more than 22 percent during a single trading session.  That day is still known as “Black Monday” up to this present time.

Markets tend to go down a lot faster than they go up.  So if your stock portfolio has gone up substantially over the past few years, good for you.  But keep in mind that all of your gains can be wiped out very rapidly.  Millions of people experienced this during the last financial crisis, and millions more will experience this during the next one.

And as I keep reminding people, so many of the exact same patterns that we witnessed just prior to the last great stock market collapse are happening once again.

For example, just yesterday I explained that there has been only one other time over the past decade when we have seen the U.S. dollar surge in value in such a short period of time.

That was in 2008, just prior to the last financial crisis.

Another example is what has happened to the price of oil.  Since the middle of last year, the price of oil has fallen by more than 50 dollars a barrel.

In all of history, that has happened only one other time.

That was in 2008, just prior to the last financial crisis.

I could go on and on.  I could talk about margin debt, price/earnings ratios, industrial commodities, etc.

But you know what?  Despite all of the warning signs there are still people out there that are eagerly pouring money into the stock market.

Back in 2005 and 2006, I knew people that were hurrying to buy homes before they got “priced out of the market”.  So they did everything that they could to scrape together down payments and they took on mortgages that were larger than they could really afford.

And in the end they got burned.

Today, people are doing similar things.  For instance, my friend Bob recently sent me an article that I could hardly believe.  It turns out that an “expert” on CNBC is encouraging people “to take out a 7 year loan with a rapidly amortizing asset as collateral in order to buy stocks.”

Yikes!

Let me be clear.  The really, really, really dumb money is jumping into the stock market right now.  Those that are pouring money into stocks today are really going to get hit hard when the crash comes.

And it isn’t just me saying this.

Just consider the words of billionaire hedge fund manager Crispin Odey

Mr Odey is best known for his big macroeconomic calls, including foreseeing the 2008 global credit crisis; piling into insurers in the wake of September 2001 attacks; and picking the recent oil price rout. He famously paid himself £28 million in 2008 after shorting credit crisis casualties, including British lender Bradford & Bingley. Mr Odey’s fund returned 54.8 per cent that year.

“The market’s reaction to all of this is leave it to the professionals, leave it to those great guys, the central bankers, because they saved the day in 2009,” he said. “These guys are kind of relying on central banks pulling a rabbit out of a hat.”

The risk is that this time, monetary policy may be ineffective: “We need the crisis to reformulate policy. Central banks are not all singing and all dancing, they cannot basically avoid the natural consequences of what we are doing.”

An inadequate supply-side response to the plunge in commodity prices as the resources industry declines to reduce production was in effect stimulating supply into falling demand.

“The trouble is today the players, whether they are the miners or the oil companies or the Saudis or anybody else, they are not doing the right things. This is the first time in my career where economics 101 doesn’t work at all.”

But it was also true that the world has not had a major recession for 25 years and thanks to frequent interventions, “there is a sensation we don’t have a business cycle”. Stocks are enjoying a six-year bull market but he also hinted at liquidity issues bubbling under the surface.

I just think that you and I have got grandstand seats here [to an imminent market shock] and my point is having found myself in the second quarter of last year selling a lot of equities and starting to go short, I found out just how illiquid it all was. You never actually see it until people try and get out of these things.”

It was unclear to Mr Odey what central banks could do to prevent a crash.

The warning signs are clear.

Soon the time for warning will be over and the crisis will be here.

I hope that you are getting ready.

Two More Harbingers Of Financial Doom That Mirror The Crisis Of 2008

Harbingers - Public DomainThe stock market continues to flirt with new record highs, but the signs that we could be on the precipice of the next major financial crisis continue to mount.  A couple of days ago, I discussed the fact that the U.S. dollar is experiencing a tremendous surge in value just like it did in the months prior to the financial crisis of 2008.  And previously, I have detailed how the price of oil has collapsed, prices for industrial commodities are tanking and market behavior is becoming extremely choppy.  All of these are things that we witnessed just before the last market crash as well.  It is also important to note that orders for durable goods are declining and the Baltic Dry Index has dropped to the lowest level on record.  So does all of this mean that the stock market is guaranteed to crash in 2015?  No, of course not.  But what we are looking for are probabilities.  We are looking for patterns.  There are multiple warning signs that have popped up repeatedly just prior to previous financial crashes, and many of those same warning signs are now appearing once again.

One of these warning signs that I have not discussed previously is the wholesale inventories to sales ratio.  When economic activity starts to slow down, inventory tends to get backed up.  And that is precisely what is happening right now.  In fact, as Wolf Richter recently wrote about, the wholesale inventories to sales ratio has now hit a level that we have not seen since the last recession…

In December, the wholesale inventory/sales ratio reached 1.22, after rising consistently since July last year, when it was 1.17. It is now at the highest – and worst – level since September 2009, as the financial crisis was winding down:

Wolf Richter

Rising sales gives merchants the optimism to stock more. But because sales are rising in that rosy scenario, the inventory/sales ratio, depicting rising inventories and rising sales, would not suddenly jump. But in the current scenario, sales are not keeping up with inventory growth.

Another sign that I find extremely interesting is the behavior of the yield on 10 year U.S. Treasury notes.  As Jeff Clark recently explained, we usually see a spike in the 10 year Treasury yield about the time the market is peaking before a crash…

The 10-year Treasury note yield bottomed on January 30 at 1.65%. Today, it’s at 2%. That’s a 35-basis-point spike – a jump of 21% – in less than two weeks.

And it’s the first sign of an impending stock market crash.

10 Year Yield - Stansberry

As I explained last September, the 10-year Treasury note yield has ALWAYS spiked higher prior to an important top in the stock market.

For example, the 10-year yield was just 4.5% in January 1999. One year later, it was 6.75% – a spike of 50%. The dot-com bubble popped two months later.

In 2007, rates bottomed in March at 4.5%. By July, they had risen to 5.5% – a 22% increase. The stock market peaked in September.

Let’s be clear… not every spike in Treasury rates leads to an important top in the stock market. But there has always been a sharp spike in rates a few months before the top.

Once again, just because something has happened in the past does not mean that it will happen in the future.

But the fact that so many red flags are appearing all at once has got to give any rational person reason for concern.

Yes, the Dow gained more than 100 points on Thursday.  But on Thursday we also learned that retail sales dropped again in January.  Overall, this has been the worst two month drop in retail sales since 2009

Following last month’s narrative-crushing drop in retail sales, despite all that low interest rate low gas price stimulus, January was more of the same as hopeful expectations for a modest rebound were denied. Falling 0.8% (against a 0.9% drop in Dec), missing expectations of -0.4%, this is the worst back-to-back drop in retail sales since Oct 2009. Retail sales declined in 6 of the 13 categories.

And economic activity is rapidly slowing down on the other side of the planet as well.

For example, Chinese imports and exports both fell dramatically in January…

Chinese imports collapsed 19.9% YoY in January, missing expectations of a modest 3.2% drop by the most since Lehman. This is the biggest YoY drop since May 2009 and worst January since the peak of the financial crisis. Exports tumbled 3.3% YoY (missing expectations of 5.9% surge) for the worst January since 2009. Combined this led to a $60.03 billion trade surplus in January – the largest ever. But apart from these massive imbalances, everything is awesome in the global economy (oh apart from The Baltic Dry at record lows, Iron Ore near record lows, oil prices crashed, and the other engine of the world economy – USA USA USA – imploding).

In light of so much bad economic data, it boggles my mind that stocks have been doing so well.

But this is typical bubble behavior.  Financial bubbles tend to be very irrational and they tend to go on a lot longer than most people think they will.  When they do finally burst, the consequences are often quite horrifying.

It may not seem like it to most people, but we are right on track for a major financial catastrophe.  It is playing out right in front of our eyes in textbook fashion.  But it is going to take a little while to unfold.

Unfortunately, most people these days do not have the patience to watch long-term trends develop.  Instead, we have been trained by the mainstream media to have the attention spans of toddlers.  We bounce from one 48-hour news cycle to the next, eagerly looking forward to the next “scandal” that is going to break.

And when the next financial crash does strike, the mainstream media is going to talk about what a “surprise” it is.  But for those that are watching the long-term trends, it is not going to be a surprise at all.  We will have seen it coming a mile away.


Why The Damage To The Economy Caused By The Oil Crash Is Going To Get Progressively Worse

Oil Price Crash - Public DomainWe are really starting to see the price of oil weigh very heavily on the economy and on the stock market.  On Tuesday, the Dow was down 291 points, and the primary reason for the decline was disappointing corporate sales numbers.  For example, heavy equipment manufacturer Caterpillar is blaming the “dramatic decline in the price of oil” for much lower than anticipated sales during the fourth quarter of 2014.  Even though Caterpillar is not an “energy company”, the price of oil is critical to their success.  And the same could be said about thousands of other companies.  That is why I have repeatedly stated that anyone who believes that collapsing oil prices are good for the U.S. economy is crazy.  The key to how much damage this oil collapse is going to do to our economy is not how low prices ultimately go.  Rather, the key is how long they stay at these low levels.  If the price of oil went back to $80 a barrel next week, the damage would be fairly minimal.  But if the price of oil stays at this current level for the remainder of 2015, the damage will be absolutely catastrophic.  Just think of the price of oil like a hot iron.  If you touch it for just a fraction of a second, it won’t do too much damage.  But if you press it against your skin for an hour, you will be severely damaged for the rest of your life at the very least.

So the damage that we are witnessing right now is just the very beginning unless the price of oil goes back up substantially.

When the price of oil first started crashing, most analysts focused on the impact that it would have on energy companies.  And without a doubt, quite a few of them are likely to be wiped out if things don’t change soon.

But of even greater importance is the ripple effects that the price of oil will have throughout our entire economy.  The oil price crash is not that many months old at this point, and yet big companies are already blaming it for causing significant problems.  The following is how Caterpillar explained their disappointing sales numbers on Tuesday

The recent dramatic decline in the price of oil is the most significant reason for the year-over-year decline in our sales and revenues outlook.  Current oil prices are a significant headwind for Energy & Transportation and negative for our construction business in the oil producing regions of the world.  In addition, with lower prices for copper, coal and iron ore, we’ve reduced our expectations for sales of mining equipment.  We’ve also lowered our expectations for construction equipment sales in China.  While our market position in China has improved, 2015 expectations for the construction industry in China are lower”

We also learned on Tuesday that orders for durable goods were extremely disappointing.  Many analysts believe that this is another area where the oil price crash is having an impact

Orders for business equipment unexpectedly fell in December for a fourth month, signaling a global growth slowdown is weighing on American companies. Bookings for non-military capital goods excluding aircraft dropped 0.6 percent for a second month, data from the Commerce Department showed. Demand for all durable goods − items meant to last at least three years − declined 3.4 percent, the worst performance since August.

Let’s keep an eye on the durable goods numbers in coming months.  Usually, when the economy is heading into a recession durable goods numbers start declining.

Meanwhile, a bunch of other big companies reported disappointing sales numbers on Tuesday as well.  The following summary comes from the Crux

Microsoft lost 9.9 percent as software-license sales to businesses were below forecasts. Caterpillar plunged 7.3 percent after forecasting 2015 results that trailed estimates as plunging oil prices signal lower demand from energy companies. DuPont Co. dropped 2.8 percent as a stronger dollar cuts into the chemical maker’s profit. Procter & Gamble Co. and United Technologies Corp. declined at least 2 percent after saying the surging greenback will lower full-year earnings.

What the economy could really use right now is a huge rebound in the price of oil.

Unfortunately, as I wrote about the other day, that is not likely to happen any time soon.

In fact, a top executive for Goldman Sachs recently told CNBC that he believes that the price of oil could ultimately go as low as 30 dollars a barrel.

And hedge fund managers are backing up their belief that oil is heading even lower with big money

Hedge funds boosted bearish wagers on oil to a four-year high as US supplies grew the most since 2001.

Money managers increased short positions in West Texas Intermediate crude to the highest level since September 2010 in the week ended January 20, US Commodity Futures Trading Commission data show. Net-long positions slipped for the first time in three weeks.

US crude supplies rose by 10.1 million barrels to 397.9 million in the week ended January 16 and the country will pump the most oil since 1972 this year, the Energy Information Administration says. Saudi Arabia’s King Salman, the new ruler of the world’s biggest oil exporter, said he will maintain the production policy of his predecessor despite a 58 percent drop in prices since June.

Sadly, the truth is that anyone that thought that the stock market would go up forever and that the U.S. economy would be able to avoid a major downturn indefinitely was just being delusional.

Our economy goes through cycles, and every financial bubble eventually bursts.

For example, did you know that the S&P 500 has never had seven up years in a row?  The following comes from a CNBC article that was posted on Tuesday…

Doubleline Capital founder Jeff Gundlach, more known for his bond prowess than as an equity market expert, pointed out that the S&P 500 has never had seven consecutive up years.

Of course, records are made to be broken, and each year is supposed to stand on its own.

But in a market that faces an uncertain future regarding monetary policy, the specter of a global economic slowdown, and an oil price plunge that is dampening capital investment, Gundlach’s little factoid sparked a lot of chatter at ETF.com’s InsideETFs conference in Hollywood, Florida.

Hmm – that reminds me of the seven year cycles that I discussed in my article yesterday.

If the price of oil stays this low for the rest of 2015, there is no way that we are going to avoid a recession.

If the price of oil stays this low for the rest of 2015, there is no way that we are going to avoid a stock market crash.

So let’s hope that the price of oil starts going back up.

If it doesn’t, the damage that is inflicted on our economy is going to get progressively worse.

This Is Exactly How Markets Behave Right Before They Crash

Roller Coaster - Photo by NeukolnWhen the stock market starts to behave like a roller coaster, that is a sign that a major move to the downside is right around the corner.  As I have stated repeatedly, when the market is very calm it tends to go up.  But when the waters start getting really choppy, that is a clear indication that stocks are about to plummet.  In early 2015, volatility has returned to Wall Street in a big way.  At one point on Tuesday, the Dow was up more than 300 points.  But then the bottom dropped out.  From the peak on Tuesday, the Dow plunged nearly 700 points in less than 30 hours before recovering more than 100 points at the end of the day.  The Dow has now experienced the longest losing streak that we have seen in 3 months, but that is not that big of a deal.  Of much greater concern is the huge price swings that we have been seeing. Remember, the three largest single day stock market increases in history were right in the middle of the financial crisis of 2008.  So if stocks go up 400 points tomorrow that is NOT a good sign.  What we really need is a string of days when stocks move less than 100 points in either direction.  If stocks keep making dramatic moves up and dramatic moves down, history tells us that it is only a matter of time before they collapse.  Any student of stock market history knows that what we are witnessing right now is exactly how markets behave right before they crash.

Examine the chart below very carefully.  It is a chart of the CBOE Volatility Index from 2006 to 2008.  As you can see, volatility was very low as stocks soared during 2006.  Then things started to get a bit choppy in 2007, and investors should have recognized this as a warning sign.  Finally, you can see that the VIX absolutely skyrocketed during the financial crisis of 2008…

VIX 2006 to 2008

Looking back, it seems so obvious.

So why aren’t more people alarmed this time around?

As CNN is reporting, the VIX is up almost 20 percent so far in 2015…

Volatility has returned with a vengeance this January. The Dow has been moving up or down by at least 100 points nearly every day this year.

CNNMoney’s Fear & Greed Index is showing signs of Extreme Fear again. And a volatility gauge known as the VIX, which is one of the components in our index, is up nearly 20% so far this year.

Meanwhile, there are lots of other signs of trouble on the horizon as well.

For example, the price of copper got absolutely hammered on Wednesday.  As I write this, it has fallen more than 5 percent and it has not been this low in more than five years.

In financial circles, it is referred to as “Dr. Copper” because it is such a valuable indicator regarding where the global economy is heading next.

For example, in 2008 the price of copper was close to $4.00 before plummeting to below $1.50 by the end of that year as the global financial system fell apart.

Now the price of copper is plunging again, and many analysts are becoming extremely concerned

One growing global worry is the steep decline in copper, which is used in many products and is often viewed as good gauge on how China is doing. The price of copper hit its lowest price since 2009 on Wednesday at $2.46. Copper is down nearly 7% this week alone.

Meanwhile, the recession (some call it a depression) in Europe continues to get even worse, and the euro continues to plunge.

On Wednesday, the euro declined to the lowest level that we have seen in nine years, and Goldman Sachs is now saying that the euro and the U.S. dollar could be at parity by the end of next year.

That is amazing considering the fact that it took $1.60 to get one euro back in July 2008.

Personally, I am fully convinced that Goldman Sachs is right on this one.  I believe that the euro is going to all-time lows that we have never seen before, and this is going to create massive problems for the eurozone.

With all of these signs of trouble out there, the smart money is rapidly pulling their money out of stocks and putting it into government bonds.  This usually happens when a crisis is looming.  It is called a “flight to safety”, and it pushes government bond yields down.

On Wednesday, the yield on 10 year U.S. Treasuries fell beneath the important 1.8 percent barrier.  We will probably see it go even lower in the months ahead.

As the rest of the world economy crumbles, the remainder of the globe is looking to America to be the rock in the storm.  For example, the following quote that I found today comes from a British news source

The global economy is running on a single engine… the American one,’ the World Bank’s chief economist, Kaushik Basu, said. ‘This does not make for a rosy outlook for the world.’

Well, they may not want to rely on us too much, because there are plenty of signs that our economy is slowing down too.  For example, we learned today that December retail sales were down 0.9% from a year ago, and this is being called “an unmitigated disaster“.  Americans were supposed to be taking the money that they were saving on gasoline and spending it, but that apparently is not happening.

Back on October 29th, I wrote an article entitled “From This Day Forward, We Will Watch How The Stock Market Performs Without The Fed’s Monetary Heroin“.  In that article, I warned that the end of quantitative easing could have dire consequences for the financial system as bubbles created by the Fed began to burst.

And that is precisely what is happening.  In fact, many analysts are now pinpointing the end of QE as the exact moment when our current troubles began.  For instance, check out this excerpt from a CNBC article that was published on Wednesday

Stuff happens when QE ends,” said Peter Boockvar, chief market analyst at The Lindsey Group. “It’s no coincidence that the market started going into a higher volatility mode, it’s no coincidence that the decline in commodity prices accelerated, it’s no coincidence that the yield curve started flattening when QE ended.”

Indeed, the increase in volatility and its effect on prices across the capital market spectrum was closely tied to the Fed ending the third round of QE in October.

We are moving into a time of great danger for Wall Street and for the global economy as a whole.

If we continue to see a tremendous amount of volatility, history tells us that it is only a matter of time before the markets implode.

Hopefully you will be ready when that happens.

Oil Falls Below 50 As Global Financial Markets Begin To Unravel

Crisis Silhouette - Public DomainOn Monday, the price of oil fell below $50 for the first time since April 2009, and the Dow dropped 331 points.  Meanwhile, the stock market declines over in Europe were even larger on a percentage basis, and the euro sank to a fresh nine year low on concerns that the anti-austerity Syriza party will be victorious in the upcoming election in Greece.  These are precisely the kinds of things that we would expect to see happen if a global financial crash was coming in 2015.  Just prior to the financial crisis of 2008, the price of oil collapsed, prices for industrial commodities got crushed and the U.S. dollar soared relative to other currencies.  All of those things are happening again.  And yet somehow many analysts are still convinced that things will be different this time.  And I agree that things will indeed be “different” this time.  When this crisis fully erupts, it will make 2008 look like a Sunday picnic.

Another thing that usually happens when financial markets begin to unravel is that they get really choppy.  There are big ups and big downs, and that is exactly what we have witnessed since October.

So don’t expect the markets just to go in one direction.  In fact, it would not be a surprise if the Dow went up by 300 or 400 points tomorrow.  During the initial stages of a financial crash, there are always certain days when the markets absolutely soar.

For example, did you know that the three largest single day stock market advances in history were right in the middle of the financial crash of 2008?  Here are the dates and the amount the Dow rose each of those days…

October 13th, 2008: +936 points

October 28th, 2008: +889 points

November 13th, 2008: +552 points

Just looking at those three days, you would assume that the fall of 2008 was the greatest time ever for stocks.  But instead, it was the worst financial crash that we have seen since the days of the Great Depression.

So don’t get fooled by the volatility.  Choppy markets are almost always a sign of big trouble ahead.  Calm waters usually mean that the markets are going up.

In order to avoid a major financial crisis in the near future, we desperately need the price of oil to rebound in a substantial way.

Unfortunately, it does not look like that is going to happen any time soon.  There is just way too much oil being produced right now.  The following is an excerpt from a recent CNBC article

The Morgan Stanley strategists say there are new reports of unsold West and North African cargoes, with much of the oil moving into storage. They also note that new supply has entered the global market with additional exports coming from Russia and Iraq, which is reportedly seeing production rising to new highs.

Since June, the price of oil has plummeted close to 55 percent.  If the price of oil stays where it is right now, we are going to see large numbers of small producers go out of business, the U.S. economy will lose millions of jobs, billions of dollars of junk bonds will go bad and trillions of dollars of derivatives will be in jeopardy.

And the lower the price of oil goes, the worse our problems are going to get.  That is why it is so alarming that some analysts are now predicting that the price of oil could hit $40 later this month

Some traders appeared certain that U.S. crude will hit the $40 region later in the week if weekly oil inventory numbers for the United States on Wednesday show another supply build.

‘We’re headed for a four-handle,’ said Tariq Zahir, managing member at Tyche Capital Advisors in Laurel Hollow in New York. ‘Maybe not today, but I’m sure when you get the inventory numbers that come out this week, we definitely will.’

Open interest for $40-$50 strike puts in U.S. crude have risen several fold since the start of December, while $20-$30 puts for June 2015 have traded, said Stephen Schork, editor of Pennsylvania-based The Schork Report.

The only way that the price of oil has a chance to move back up significantly is if global production slows down.  But instead, production just continues to increase in the short-term thanks to projects that were already in the works.  As a result, analysts from Morgan Stanley say that the oil glut is only going to intensify

Morgan Stanley analysts said new production will continue to ramp up at a number of fields in Brazil, West Africa, Canada and in the U.S. Gulf of Mexico as well as U.S. shale production. Also, the potential framework agreement with Iran could mean more Iranian oil on the market.

Yes, lower oil prices mean that we get to pay less for gasoline when we fill up our vehicles.

But as I have written about previously, anyone that believes that lower oil prices are good for the U.S. economy or for the global economy as a whole is crazy.  And these sentiments were echoed recently by Jeff Gundlach

Oil is incredibly important right now. If oil falls to around $40 a barrel then I think the yield on ten year treasury note is going to 1%. I hope it does not go to $40 because then something is very, very wrong with the world, not just the economy. The geopolitical consequences could be – to put it bluntly – terrifying.

If the price of oil does not recover, we are going to see massive financial problems all over the planet and the geopolitical stress that this will create will be unbelievable.

To expand on this point, I want to share an excerpt from a recent Zero Hedge article.  As you can see, a rapid rise or fall in the price of oil almost always correlates with a major global crisis of some sort…

Large and rapid rises and falls in the price of crude oil have correlated oddly strongly with major geopolitical and economic crisis across the globe. Whether driven by problems for oil exporters or oil importers, the ‘difference this time’ is that, thanks to central bank largesse, money flows faster than ever and everything is more tightly coupled with that flow.

Oil Crisis Chart - Zero Hedge

So is the 45% YoY drop in oil prices about to ’cause’ contagion risk concerns for the world?

And without a doubt, we are overdue for another stock market crisis.

Between December 31st, 1996 and March 24th, 2000 the S&P 500 rose 106 percent.

Then the dotcom bubble burst and it fell by 49 percent.

Between October 9th, 2002 and October 9th, 2007 the S&P 500 rose 101 percent.

But then that bubble burst and it fell by 57 percent.

Between March 9th, 2009 and December 31st, 2014 the S&P 500 rose an astounding 204 percent.

When this bubble bursts, how far will it fall this time?


Most People Cannot Even Imagine That An Economic Collapse Is Coming

Thinking - Public DomainThe idea that the United States is on the brink of a horrifying economic crash is absolutely inconceivable to most Americans.  After all, the economy has been relatively stable for quite a few years and the stock market continues to surge to new heights.  On Friday, the Dow and the S&P 500 both closed at brand new all-time record highs.  For the year, the S&P 500 is now up 9 percent and the Nasdaq is now up close to 11 percent.  And American consumers are getting ready to spend more than 600 billion dollars this Christmas season.  That is an amount of money that is larger than the entire economy of Sweden.  So how in the world can anyone be talking about economic collapse?  Yes, many will concede, we had a few bumps in the road back in 2008 but things have pretty much gotten back to normal since then.  Why be concerned about economic collapse when there is so much stability all around us?

Unfortunately, this brief period of stability that we have been enjoying is just an illusion.

The fundamental problems that caused the financial crisis of 2008 have not been fixed.  In fact, most of our long-term economic problems have gotten even worse.

But most Americans have such short attention spans these days.  In a world where we are accustomed to getting everything instantly, news cycles only last for 48 hours and 2008 might as well be an eternity ago.

In the United States today, our entire economic system is based on debt.

Without debt, very little economic activity happens.  We need mortgages to buy our homes, we need auto loans to buy our vehicles and we need our credit cards to do our shopping during the holiday season.

So where does all of that debt come from?

It comes from the banks.

In particular, the “too big to fail banks” are the heart of this debt-based system.

Do you have a mortgage, an auto loan or a credit card from one of these “too big to fail” institutions?  A very large percentage of the people that will read this article do.

And a lot of people might not like to hear this, but without those banks we essentially do not have an economy.

When Lehman Brothers collapsed in 2008, it almost resulted in the meltdown of our entire system.  The stock market collapsed and we experienced an absolutely wicked credit crunch.

Unfortunately, that was just a small preview of what is coming.

Even though a few prominent “experts” such as New York Times columnist Paul Krugman have declared that the “too big to fail” problem is “over”, the truth is that it is now a bigger crisis than ever before.

Compared to five years ago, the four largest banks in the country are now almost 40 percent larger.  The following numbers come from a recent article in the Los Angeles Times

Just before the financial crisis hit, Wells Fargo & Co. had $609 billion in assets. Now it has $1.4 trillion. Bank of America Corp. had $1.7 trillion in assets. That’s up to $2.1 trillion.

And the assets of JPMorgan Chase & Co., the nation’s biggest bank, have ballooned to $2.4 trillion from $1.8 trillion.

At the same time that those banks have been getting bigger, 1,400 smaller banks have completely disappeared from the banking industry.

That means that we are now more dependent on these gigantic banks than ever.

At this point, the five largest banks account for 42 percent of all loans in the United States, and the six largest banks account for 67 percent of all assets in our financial system.

If someone came along and zapped those banks out of existence, our economy would totally collapse overnight.

So the health of this handful of immensely powerful banking institutions is absolutely critical to our economy.

Unfortunately, these banks have become deeply addicted to gambling.

Have you ever known people that allowed their lives to be destroyed by addictions that they could never shake?

Well, that is what is happening to these banks.  They have transformed Wall Street into the largest casino in the history of the world.  Most of the time, their bets pay off and they make lots of money.

But as we saw back in 2008, when they miscalculate things can fall apart very rapidly.

The bets that I am most concerned about are known as “derivatives“.  In essence, they are bets about what will or will not happen in the future.  The big banks use very sophisticated algorithms that are supposed to help them be on the winning side of these bets the vast majority of the time, but these algorithms are not perfect.  The reason these algorithms are not perfect is because they are based on assumptions, and those assumptions come from people.  They might be really smart people, but they are still just people.

If things stay fairly stable like they have the past few years, the algorithms tend to work very well.

But if there is a “black swan event” such as a major stock market crash, a collapse of European or Asian banks, a historic shift in interest rates, an Ebola pandemic, a horrific natural disaster or a massive EMP blast is unleashed by the sun, everything can be suddenly thrown out of balance.

Acrobat Nik Wallenda has been making headlines all over the world for crossing vast distances on a high-wire without a safety net.  Well, that is essentially what our “too big to fail” banks are doing every single day.  With each passing year, these banks have become even more reckless, and so far there have not been any serious consequences.

But without a doubt, someday there will be.

What would you say about a bookie that took $200,000 in bets but that only had $10,000 to cover those bets?

You would certainly call that bookie a fool.

But that is what our big banks are doing.

Right now, JPMorgan Chase has more than 67 trillion dollars in exposure to derivatives but it only has 2.5 trillion dollars in assets.

Right now, Citibank has nearly 60 trillion dollars in exposure to derivatives but it only has 1.9 trillion dollars in assets.

Right now, Goldman Sachs has more than 54 trillion dollars in exposure to derivatives but it has less than a trillion dollars in assets.

Right now, Bank of America has more than 54 trillion dollars in exposure to derivatives but it only has 2.2 trillion dollars in assets.

Right now, Morgan Stanley has more than 44 trillion dollars in exposure to derivatives but it has less than a trillion dollars in assets.

Most people have absolutely no idea how incredibly vulnerable our financial system really is.

The truth is that these “too big to fail” banks could collapse at any time.

And when they fail, our economy will fail too.

So let us hope and pray that this brief period of false stability lasts for as long as possible.

Because when it ends, all hell is going to break loose.