The Real Economic Numbers: 21.5 Percent Unemployment, 10 Percent Inflation And Negative Economic Growth

Every time the mainstream media touts some “wonderful new economic numbers” I just want to cringe.  Yes, it is true that the economic numbers have gotten slightly better since Donald Trump entered the White House, but the rosy economic picture that the mainstream media is constantly painting for all of us is completely absurd.  As you are about to see, if honest numbers were being used all of our major economic numbers would be absolutely terrible.  Of course we can hope for a major economic turnaround for America under Donald Trump, but we certainly are not there yet.  Economist John Williams of shadowstats.com has been tracking what our key economic numbers would look like if honest numbers were being used for many years, and he has gained a sterling reputation for being accurate.  And according to him, it looks like the U.S. economy has been in a recession and/or depression for a very long time.

Let’s start by talking about unemployment.  We are being told that the unemployment rate in the United States is currently “3.8 percent”, which would be the lowest that it has been “in nearly 50 years”.

To support this claim, the mainstream media endlessly runs articles declaring how wonderful everything is.  For example, the following is from a recent New York Times article entitled “We Ran Out of Words to Describe How Good the Jobs Numbers Are”

The real question in analyzing the May jobs numbers released Friday is whether there are enough synonyms for “good” in an online thesaurus to describe them adequately.

So, for example, “splendid” and “excellent” fit the bill. Those are the kinds of terms that are appropriate when the United States economy adds 223,000 jobs in a month, despite being nine years into an expansion, and when the unemployment rate falls to 3.8 percent, a new 18-year low.

Doesn’t that sound great?

It would be great, if the numbers that they were using were honest.

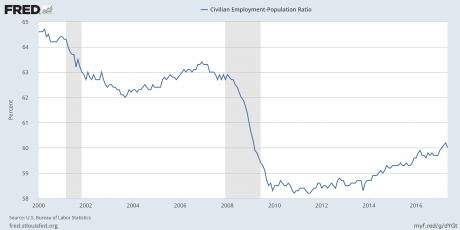
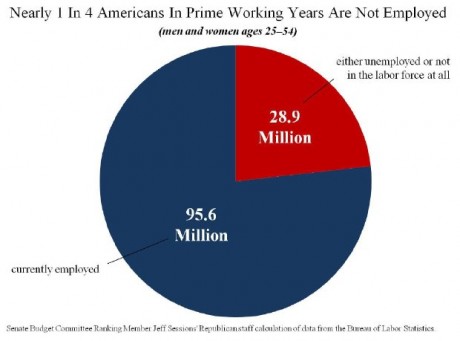
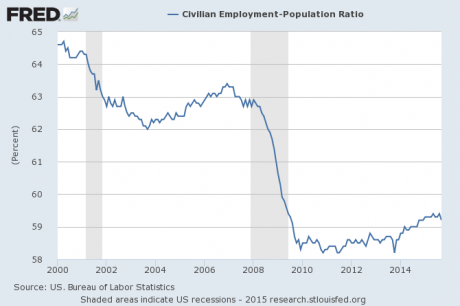
The truth, of course, is that the percentage of the population that is employed has barely budged since the depths of the last recession.  According to John Williams, if honest numbers were being used the unemployment rate would actually be 21.5 percent today.

So what is the reason for the gaping disparity?

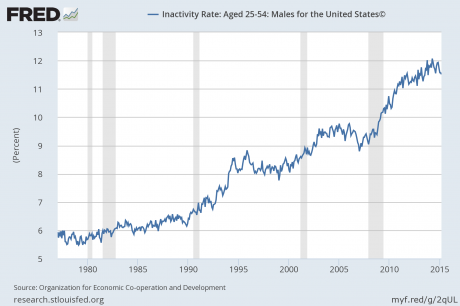
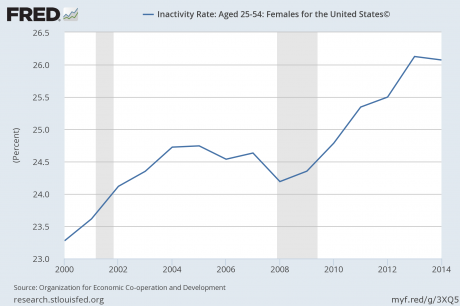
As I have explained repeatedly, the government has simply been moving people from the “officially unemployed” category to the “not in the labor force” category for many, many years.

If we use the government’s own numbers, there are nearly 102 million working age Americans that do not have a job right now.  That is higher than it was at any point during the last recession.

We are being conned.  I have a friend down in south Idaho that is a highly trained software engineer that has been out of work for two years.

If the unemployment rate is really “3.8 percent”, why can’t he find a decent job?

By the way, if you live in the Boise area and you know of an opening for a quality software engineer, please let me know and I will get the information to him.

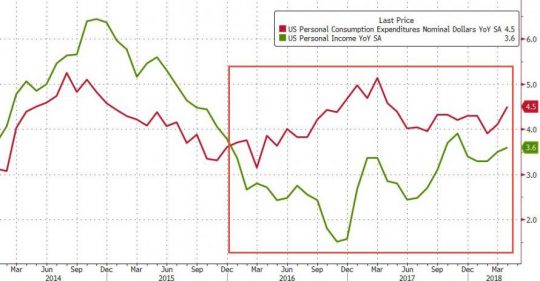
Next, let’s talk about inflation.

According to Williams, the way inflation has been calculated in this country has been repeatedly changed over the decades

Williams argues that U.S. statistical agencies overestimate GDP data by underestimating the inflation deflator they use in the calculation.

Manipulating the inflation rate, Williams argues in Public Comment on Inflation Measurement , also enables the US government to pay out pensioners less than they were promised, by fudging cost of living adjustments.

This manipulation has ironically taken place quite openly over decades, as successive Republican and Democratic administrations made “improvements” in the way they calculated the data.

If inflation was still calculated the way that it was in 1990, the inflation rate would be 6 percent today instead of about 3 percent.

And if inflation was still calculated the way that it was in 1980, the inflation rate would be about 10 percent today.

Doesn’t that “feel” more accurate to you?  We have all seen how prices for housing, food and health care have soared in recent years.  After examining what has happened in your own life, do you believe that the official inflation rates of “2 percent” and “3 percent” that we have been given in recent years are anywhere near accurate?

Because inflation is massively understated, that has a tremendous effect on our GDP numbers as well.

If accurate inflation numbers were being used, we would still be in a recession right now.

In fact, John Williams insists that we would still be in a recession that started back in 2004.

And without a doubt, a whole host of other more independent indicators point in that direction too.  The following comes from an excellent piece by Peter Diekmeyer

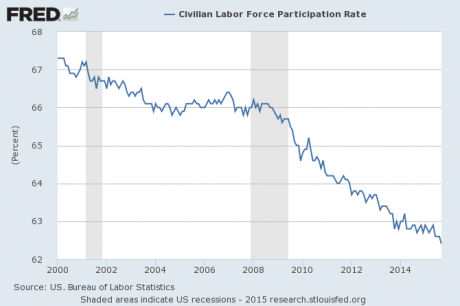
Williams’ findings, while controversial, corroborate a variety of other data points. Median wage gains have been stagnant for decades. The U.S. labour force participation rate remains at multi-decade lows. Even our own light-hearted Big Mac deflator suggests that the U.S. economy is in a depression.

Another clue is to evaluate the U.S. economy just as economists would a third world nation whose data they don’t trust. They do this by resorting to figures that are hard to fudge.

There, too, by a variety of measures—ranging from petroleum consumption to consumer goods production to the Cass Freight Index—the U.S. economy appears to have not grown much, if at all, since the turn of the millennium.

In the end, all that any of us really need to do is to just open our eyes and look at what is happening all around us.  We are on pace for the worst year for retail store closings in American history, and this “retail apocalypse” is hitting rural areas harder than anywhere else

This city’s Target store is gone.

So is Kmart, MC Sports, JCPenney, Vanity and soon Herberger’s, a department store.

“The mall is pretty sad,” says Amanda Cain, a teacher and mother. “Once Herberger’s closes, we’ll have no anchors.”

About two-thirds of Ottumwa’s Quincy Place Mall will be empty with Herberger’s loss.

Of course it isn’t just the U.S. economy that is troubled either.

We are living in the terminal phase of the greatest debt bubble in global history, many nations around the globe are already experiencing a very deep economic downturn, and our planet is literally in the process of dying.

So please don’t believe the hype.

Yes, we definitely hope that things will get better, but the truth is that things have not been “good” for the U.S. economy for a very, very long time.

Michael Snyder is a nationally syndicated writer, media personality and political activist. He is the author of four books including The Beginning Of The End and Living A Life That Really Matters.

The Truth About The Employment Numbers – Nearly 102 Million Working Age Americans Do Not Have A Job Right Now

Don’t get too excited about the “good employment numbers” that you are hearing about from the mainstream media.  The truth is that they actually aren’t very good at all.  For years, the federal government has been taking numbers out of one category and putting them into another category and calling it “progress”, and in this article we will break down exactly what has been happening.  We are being told that the U.S. unemployment rate has fallen to “3.8 percent”, which is supposedly the lowest that it has been “in nearly 50 years”.  If these were honest numbers that would be great news.  But these are not honest numbers…

Let’s take this one step at a time, and we are going to use the Federal Reserve’s own numbers.

According to the Fed, there were 6,065,000 working age Americans unemployed in May.

That would be an excellent number if it was an honest number.  But of course that number does not tell the whole story.

We also have to factor in the other category of working age Americans that are not currently employed.  They are not considered to be “officially unemployed” because they are considered to be “not in the labor force”.

According to the Federal Reserve, 95,915,000 working age Americans were “not in the labor force” in May.

That is an all-time record high, and this is how the federal government has been making the employment numbers look so good.  The number of Americans that are “officially unemployed” keeps going down, and the number of Americans “not in the labor force” keeps going up.

When you add 6,065,000 and 95,915,000 together, you come up with a grand total of 101,980,000 working age Americans that do not have a job right now.

So we essentially have 102 million working age Americans that are not employed, and that is the same level that we had four years ago.

And back during the peak of the last recession, the number of working age Americans without a job never surpassed the 100 million mark.

That means that there are more working age Americans without a job right now than there was at any point during the last recession.

All of those economic optimists out there should chew on that number for a while.

According to John Williams of shadowstats.com, if honest numbers were being used our unemployment rate would be somewhere around 21 percent at the moment.  That is a slight improvement from the 22 percent level that we were at not too long ago, but it is not nearly good enough.

So please don’t try to convince me that the U.S. economy is “doing well” until we can get the number of working age Americans without a job under 100 million.

Meanwhile, Americans continue to spend far more money than they are making. In fact, Americans have now been spending more than they are making for 28 months in a row.  The following comes from Zero Hedge

For the 28th month in a row, YoY growth in spending has outpaced incomes, sending the savings rate back down to just 2.8, the lowest since the debt-funded holiday spending spree of December 2017, and just shy of record lows.

Spending YoY is the highest since April 2017:

Adjusted for inflation, real consumption rose 0.4%, double the median projection of 0.2%. The Commerce Department said spending for gasoline and other energy goods, as well as household utilities, were leading contributors to the monthly increase in real outlays. Real durable goods spending, rose 0.3% after a 1.9% increase in the prior month; nondurable goods advanced 0.4% for a second month. Outlays on services, adjusted for inflation, rose 0.4% after a 0.3% gain in prior month.

Obviously this is not sustainable.

And in the final analysis, there is really nothing sustainable about our current economic situation.  We are in the terminal phase of the greatest debt bubble that humanity has ever seen, and there are an increasing number of indications that the party is about to come to a very abrupt end.

We have never recovered from the last recession, and all of our long-term financial imbalances have continued to get even worse.  For the moment, much of the country is enjoying a debt-fueled standard of living that they do not deserve, and most of them have absolutely no idea that there is no way that this state of affairs can continue for much longer.

As individuals, we simply cannot consume far more than we produce indefinitely, and the same thing is true for our nation as a whole.

Time is running out, but most Americans are completely oblivious to this very simple basic fact.

Michael Snyder is a nationally syndicated writer, media personality and political activist. He is the author of four books including The Beginning Of The End and Living A Life That Really Matters.

The Real Unemployment Number: 102 Million Working Age Americans Do Not Have A Job

Did you know that the number of working age Americans that do not have a job right now is far higher than it was during the worst moments of the last recession?  For example, in January 2009 92.6 million working age Americans did not have a job, but we just found out that in May the number of working age Americans without a job increased to just a shade under 102 million.  We’ll go over those numbers in more detail in a moment, but first I want to talk a bit about the difference between perception and reality.  According to the bureaucrats in the federal government, the “unemployment rate” in May was the lowest that we have seen in 16 years.  At just “4.3 percent”, we are essentially at “full employment”, and so according to them anyone that really wants a job should be able to find one pretty easily.

Of course that is a load of nonsense.  John Williams of shadowstats.com tracks what our economic numbers would look like if honest numbers were being used, and according to his calculations the unemployment rate is currently 22 percent.

So what accounts for the wide disparity between those numbers?

Well, the truth is that the official “unemployment rate” that the mainstream media endlessly hypes is so manipulated that it has essentially lost all meaning at this point.

In May, we were told that the U.S. economy added 138,000 jobs, but that is not even enough to keep up with population growth.

However, when you look deeper into the numbers some major red flags quickly emerge.  You won’t hear it on the news, but in May the U.S. economy actually lost 367,000 full-time jobs.  That is an absolutely nightmarish figure, and it confirms the fact that economic activity is starting to dramatically slow down.

But somehow the “unemployment rate” in May fell from “4.4 percent” to “4.3 percent”.

How in the world can they do that?

Well, for years the government has been taking large numbers of people from the basket known as “officially unemployed” and dumping them into another basket known as “not in the labor force”.  Since those that are “not in the labor force” do not count toward the official unemployment rate, they can make things look better than they actually are by moving people into that category.

In May, the government added a staggering 608,000 Americans into the “not in the labor force” category.  So now the number of working age Americans “not in the labor force” has reached a total of 94.98 million.  When you add that total to the number of Americans that are “officially” unemployed (6.86 million), you get a grand total of 101.84 million.

In other words, when you round up to the nearest million you get a grand total of 102 million Americans that do not have a job right now.

If you go back to January 2009, there were 81.02 million Americans that were “not in the labor force” and 11.61 million Americans that were considered to be “officially unemployed”.  And so that means that according to the federal government there were 92.63 million working age Americans that did not have a job at that point.

So if the number of working age Americans without a job has risen by 9.21 million since January 2009, are we really doing so much better than we were during the depths of the last recession?

Another way to look at this is by examining the civilian employment-population ratio.  Just before the last recession, about 63 percent of the working age population had a job, but then during the recession that number fell to between 58 and 59 percent for quite a while.  We have finally gotten back to the 60 percent mark, but we are still far, far below the level that we were at before the last recession struck.

And of course all of the above assumes that the numbers that the government is giving us accurately reflect reality, and that is highly questionable.

For example, according to one recent analysis the “business birth and death model” has accounted for 93 percent of all “new jobs” reported by the government since 2008…

As our friends at Morningside Hill calculate, a full 93% of the new jobs reported since 2008 – 6.3 million out of 6.7 million – and 40% of the jobs in 2016 alone were added through the business birth and death model – a highly controversial model which is not supported by the data. On the contrary, all data on establishment births and deaths point to an ongoing decrease in entrepreneurship.

In essence, government bureaucrats pull a number out of the air and add jobs to the report based on an estimate of how many new businesses they think are being created in America in a particular month.

Is it possible that there is a chance that they are being overly optimistic when they make this estimate?

Most people have no idea that the “official numbers” that we get from the government are highly speculative, and there is always a temptation to make things look better than they actually are.

There is no way in the world that we are anywhere near “full employment”.  I hear from people all over the country that say that it is exceedingly difficult to find good jobs where they live.  And according to a brand new report that was just released, the number of job cuts in May 2017 was 71 percent higher than it was in May 2016.

We also know that over the past ten years the average rate of economic growth in the United States exactly matches the average rate of economic growth that the U.S. experienced during the 1930s.

I don’t see how anyone can possibly claim that the U.S. economy is doing well.  Just prior to the last recession there were 26 million Americans on food stamps, and now we have 44 million.  We are on pace to absolutely shatter the all-time record for store closings in a single year, and the number of homeless people living in Los Angeles County has risen by 23 percent over the past 12 months.

But once again, it is a battle of perception vs. reality.  Their televisions are endlessly feeding them the message that everything is just fine, and most Americans seem to be buying it, at least for now…

The Percentage Of Working Age Men That Do Not Have A Job Is Similar To The Great Depression

Great DepressionWhy are so many men in their prime working years unemployed?  The Obama administration would have us believe that unemployment is low in this country, but that is not true at all.  In fact, one author quoted by NPR says that “it’s kind of worse than it was in the depression in 1940”.  Most Americans don’t realize this, but more men from ages 25 to 54 are “inactive” right now than was the case during the last recession.  We have millions upon millions of strong young men just sitting around doing nothing.  They aren’t employed and they aren’t considered to be looking for employment either, and so they don’t show up in the official unemployment numbers.  But they don’t have jobs, and nothing the Obama administration does can eliminate that fact.

According to NPR, “nearly 100 percent of men between the ages of 25 and 54 worked” in the 1960s.

In those days, just about any dependable, hard working American man could get hired almost immediately.  The economy was growing and the demand for labor was seemingly insatiable.

But today, one out of every six men in their prime working years does not have a job

In a recent report, President Obama’s Council of Economic Advisers said 83 percent of men in the prime working ages of 25-54 who were not in the labor force had not worked in the previous year. So, essentially, 10 million men are missing from the workforce.

One in six prime-age guys has no job; it’s kind of worse than it was in the depression in 1940,” says Nicholas Eberstadt, an economic and demographic researcher at American Enterprise Institute who wrote the book Men Without Work: America’s Invisible Crisis. He says these men aren’t even counted among the jobless, because they aren’t seeking work.

So why is this happening?

If you look at the inactivity rate for men in the 25 to 54 age bracket, it was sitting at just 8.1 percent in January 2000.

In January 2008, right at the beginning of the last recession, it was sitting at 9.2 percent, and by the end of the recession it had risen to 10.3 percent.

Today, it is sitting at 11.5 percent.

Remember, these are men that don’t even count toward the official unemployment rate.  They are not working, but they are not considered to be “looking for work” either.

So what are these men doing?

You may be tempted to think that many of them have decided to stay home and raise the kids as their wives go off to work.  But according to NPR, that is not what is happening

What the missing men aren’t doing in large numbers is staying home to take care of family. Forty percent of nonworking women are primary caregivers; that’s true of only 5 percent of men out of the workforce.

We do have the largest prison population in the entire world by far, and without a doubt that does play a role in these numbers.  However, a far bigger factor is the millions of men that have become content being dependents of the federal government.  More than 100 million Americans receive money from the government each month, and a lot of people (both men and women) have found that it is just easier to sit back and collect government checks than it is to go out and try to work hard for a living.

But of course the number one factor is the lack of jobs available.  I personally know people that have been looking for work in their fields for years and have not been able to get hired.  We have a major employment crisis in this nation, and it is only going to get worse in the years ahead as we continue to lose jobs to technology and millions more good jobs get shipped overseas.

And a lot of the “jobs” that have been created during the Obama administration have been very low quality jobs.  Since December 2014, we have gained about half a million jobs for waiters and bartenders, but meanwhile we have actually lost good paying manufacturing jobs.  If we continue down this road, the middle class will continue to shrink.

In addition to everything that I have just shared, here are some other facts that are pertinent to this discussion…

-Right at this moment, there are approximately 102 million working age Americans that do not have a job.

-Nearly one out of every five young adults are currently living with their parents.

-The Wall Street Journal recently declared that this is the weakest “economic recovery” since 1949.

-Barack Obama is on track to be the only president in U.S. history to never have a single year when the U.S. economy grew by at least 3 percent.

The economy is far weaker than you are being told, the employment crisis is far worse than you are being told, and as I mentioned yesterday, the stage is clearly set for a new financial crisis of epic proportions.

And if we are going to see markets crash, this time of the year is a good time for it.  In fact, CNBC says that history tells us that this is the “worst period of the year for stocks”…

The worst period of the year for stocks has just begun — at least based on market history.

Over the entire 120-year history of the Dow Jones industrial average, Sept. 6 to Oct. 29 tends to be the worst period for the market. And more specifically, the last few weeks of September have been an especially bad time.

Someday when people look back at this time in history, they will not be surprised by how horrific the coming collapse will be.  The truth is that anyone with a lick of common sense can see that the greatest debt bubble in the history of the world is going to end badly.

No, what is going to amaze them is that the system was able to hold together as long as it did.  It truly is incredible that the debt-based, fiat currency Ponzi scheme that the central banks of the world have been desperately trying to prop up has been able to keep chugging along all the way to the middle of 2016.

How much longer can they keep the magic going?

I don’t know, but history tells us that time is not on their side…

In 1 Out Of Every 5 American Families, Nobody Has A Job

Family Silhouette - Public Domain 2If nobody is working in one out of every five U.S. families, then how in the world can the unemployment rate be close to 5 percent as the Obama administration keeps insisting? The truth, of course, is that the U.S. economy is in far worse condition than we are being told. Last week, I discussed the fact that the Federal Reserve has found that 47 percent of all Americans would not be able to come up with $400 for an unexpected visit to the emergency room without borrowing it or selling something. But Barack Obama and his minions never bring up that number. Nor do they ever bring up the fact that 20 percent of all families in America are completely unemployed. The following comes directly from the Bureau of Labor Statistics

In 2015, the share of families with an employed member was 80.3 percent, up by 0.2 percentage point from 2014. The likelihood of having an employed family member rose in 2015 for Black families (from 76.4 percent to 77.7 percent) and for Hispanic families (from 85.9 percent to 86.4 percent). The likelihood for White and Asian families showed little or no change (80.1 percent and 88.6 percent, respectively).

For purposes of this study, families “are classified either as married-couple families or as families maintained by women or men without spouses present” and they include households without children as well as children under the age of 18.

Digging into the numbers, we find that there were a total of 81,410,000 families in America during the 2015 calendar year.

Of that total, 16,060,000 families did not have a single member employed.

So that means that in 19.7 percent of all families in the United States, nobody has a job.

And of course there are lots more families that are “partially employed”. In other words, maybe the wife has a job but the husband does not.

So based on these numbers, it would appear to me that the true rate of unemployment in this country is vastly higher than 5 percent, and John Williams of shadowstats.com agrees with me. According to his calculations, the broadest measure of unemployment in the U.S. would actually be sitting at 22.9 percent if honest numbers were being used.

But let’s not just focus on where we are.

Let’s take a look at where we are going.

According to Challenger, Gray & Christmas, job cut announcements by big companies in the United States were up 32 percent during the first quarter of 2016 compared to the first quarter of 2015, and it appears that the job losses are going to continue to mount as we roll into the second quarter. For instance, late last week Intel announced that it is going to be laying off 12,000 workers

As it navigates its path into the future, Intel, the 47-year-old corporation best known for making microprocessor chips that power personal computers, has announced significant changes to its business.

On Tuesday, Intel’s CEO Brian Krzanich said in a letter to employees that the company over the next year will cut its 107,300-person global workforce by 12,000 people, or 11 percent.

Those are good middle class jobs, and they are exactly the kind of jobs that we cannot afford to be losing.

Meanwhile, the “retail apocalypse” appears to be accelerating once again.

Bloomberg is reporting that teen clothing chain Aeropostale is preparing to file for bankruptcy.  Aeropostale currently operates more than 800 stores across the nation, and it is unclear if any of them will be able to stay open as this process plays out. But of course it isn’t just Aeropostale that has gone bankrupt lately. Here are a few more examples of major retailers that have recently filed for bankruptcy

April 16, 2016: Vestis Retail Group, the operator of sporting goods retailers Eastern Mountain Sports (camping, hiking, skiing, adventure sports), Bob’s Stores (family clothing and shoes), and Sport Chalet (general sporting goods), filed for Chapter 11 bankruptcy. It will close all 56 stores and stop online sales.

In the filing, it blamed the going-out-of-business sales at “certain Sports Authority locations,” plus the weather, which had been too warm, and trouble with switching to a new software platform. It’s owned by private equity firm Versa Capital Management LLC.

April 7, 2016: Pacific Sunwear of California, clothing retailer with nearly 600 stores and derailed ambitions of skate-and-surf cool, filed for Chapter 11 bankruptcy. PE firm Golden Gate Capital, a lender to the company, agreed to convert over 65% of its loan into equity of the reorganized company and add another $20 million in financing. Wells Fargo agreed to provide $100 million of debtor-in-possession financing.

March 2, 2016: Sports Authority filed for Chapter 11 bankruptcy. It said it would close 140 of its 450 stores, including all stores in Texas.

Just because the stock market has been doing well in recent weeks does not mean that the crisis has passed.

In fact, many experts believe that the crisis of 2016 is just getting started.  Albert Edwards of Societe Generale is one of them

But what I do know is when in the last few weeks I have heard that Janet Yellen sees no bubble in the US, when Ben Bernanke hones and restates his helicopter money speech, and when Mario Draghi says that the ECB’s policy of printing money and negative interest rates was working, I feel utterly depressed (I could also quote similar nonsense from Japan, the UK and China). I have not one scintilla of doubt that these central bankers will destroy the enfeebled world economy with their clumsy interventions and that political chaos will be the ugly result. The only people who will benefit are not investors, but anarchists who will embrace with delight the resulting chaos these policies will bring!

All over the world, the underlying economic fundamentals continue to deteriorate. Here in the U.S., retail sales have been extremely disappointing, total business sales have been steadily falling, corporate revenues and corporate profits continue to plunge, and corporate debt defaults have soared to their highest level since the last financial crisis.

All of these numbers are screaming that a major economic downturn is here, and with each passing week things look even more ominous for the second half of 2016.

*About the author: Michael Snyder is the founder and publisher of The Economic Collapse Blog. Michael’s controversial new book about Bible prophecy entitled “The Rapture Verdict” is available in paperback and for the Kindle on Amazon.com.*

23 Percent Of Americans In Their Prime Working Years Are Unemployed

Unemployment - Public DomainDid you know that when you take the number of working age Americans that are officially unemployed (8.2 million) and add that number to the number of working age Americans that are considered to be “not in the labor force” (94.3 million), that gives us a grand total of 102.5 million working age Americans that do not have a job right now?  I have written about this before, but today I want to focus just on Americans that are in their prime working years.  When you look at only Americans that are from age 25 to age 54, 23.2 percent of them are unemployed right now.  The following analysis and chart come from the Weekly Standard

Here’s a chart showing those in that age group currently employed (95.6 million) and those who aren’t (28.9 million):

Americans In Their Prime Working Years Not Working

“There are 124.5 million Americans in their prime working years (ages 25–54). Nearly one-quarter of this group—28.9 million people, or 23.2 percent of the total—is not currently employed. They either became so discouraged that they left the labor force entirely, or they are in the labor force but unemployed. This group of non-employed individuals is more than 3.5 million larger than before the recession began in 2007,” writes the Republican side of the Senate Budget Committee.

Clearly, we have never recovered from the impact of the last recession.

But let’s try to put these numbers in context.

Below, I would like to share two charts with you.  They show what has happened to the inactivity rates for men and for women in their prime working years in the United States in recent years.

In order to be considered “inactive”, you can’t have a job and you can’t be looking for a job.  So this subset of people is smaller than the group that we were talking about above.  The 23.2 percent of Americans in their prime working years that are unemployed right now includes those that are looking for a job and those that are not looking for a job.

These next two charts do not include anyone that has a job or that is currently looking for a job.  These charts only cover “inactive” people in their prime working years that are not considered to be in the labor force.

As you can see in this first chart, the inactivity rate for men in their prime working years exploded higher during the last recession and then continued to go up even after the recession supposedly ended.  At this point, it is hovering near all-time record highs.  Does this look like an “economic recovery” to you?…

Inactivity Rate Men

For women, we see a similar thing.  In this next chart, you can see that the inactivity rate for women in their prime working years rose during the last recession and then just kept on rising.  At this point, it remains far higher than it was during the last recession…

Inactivity Rate Women

What are we to make of all this?

For both men and women in their prime working years, the inactivity rate is significantly higher than it was during the last recession.

All of these people neither have a job nor are they looking for one.

So what in the world is going on here?

Are they independently wealthy?

Have these people found rich spouses to marry so they don’t have to work?

No, the truth is that the middle class in America is steadily eroding and poverty is absolutely exploding.  Credit card debt has soared to a new record high, and 48 percent of all U.S. adults under the age of 30 believe that “the American Dream is dead”.

The issue isn’t that people don’t want to work.

The issue is that people cannot find enough work.

And even if you have a job, that does not mean that you are on easy street.  According to the Social Security Administration, 51 percent of all American workers make less than $30,000 a year.

Tens of millions of Americans are now among the ranks of “the working poor”.  So many families are watching their expenses soar while their paychecks go down or stagnate.  If you are in this situation right now, then you probably know how exceedingly stressful it can be.

Just look at what is happening to the cost of health insurance.  The following comes from Fox News

Health insurance premiums have increased faster than wages and inflation in recent years, rising an average of 28 percent from 2009 to 2014 despite the enactment of Obamacare, according to a report from Freedom Partners.

And I am not exactly sure where they got those numbers.  Personally, I know that my health insurance rates have gone up far faster than that.

Two years ago, my health insurance company wanted to double the health insurance premiums for my family even though we never get sick.  So I switched to another insurance company that offered a policy that was only about 30 percent higher than my last one.  But then when it came time to renew, that insurance company wanted to raise my rate by another 50 percent.

Thanks to Obamacare, American families are being absolutely crippled by the cost of health care.  And of course we are seeing the rising cost of living so many other places as well.  Our paychecks are being squeezed harder and harder, and this is absolutely killing the middle class.  In fact, the middle class in America is now a minority for the first time ever.

And now for the real bad news – this is about as good as things are ever going to get in this country.  As you can see from what I have shared above, we never really had any sort of meaningful “economic recovery”, and now we have entered the early phases of the next major downturn.

So where do we go from here?  Unfortunately, our debt-fueled prosperity has provided us with a massively inflated standard of living that is not even close to sustainable.  As this bubble bursts, the economic pain is going to be absolutely unprecedented.

But it won’t be just economic pain that we are facing.  In my new book, I detail the things that I believe that are coming to this country, and I explain why the entire planet will soon be facing incredibly challenging times.  It is going to be one of the most controversial Christian books of 2016, because it directly challenges many of the things that are being taught in mainstream churches today.  My book is an ominous message of warning and an inspiring message of hope, and I truly believe that it is the most important thing that I have ever written.

No matter how you may see the future, the key is that we all learn to love one another.  The years ahead are going to be extremely challenging, and those that want to chase everyone else away and survive as lone wolves are going to have a very rough time.  We all need each other, and those that have friends, family and communities around them are going to be in a much better position to weather the coming storms.

So let us hope for the best, but let us also prepare for the worst…

Right Now There Are 102.6 Million Working Age Americans That Do Not Have A Job

Unemployed Man - Public DomainThe federal government uses very carefully manipulated numbers to cover up the crushing economic depression that is going on in this nation.  For the month of September, the federal government told us that 142,000 jobs were added to the economy.  If that was actually true, that would barely be enough to keep up with population growth.  Sadly, the truth is that the real numbers were actually far worse than that.  The unadjusted numbers show that the U.S. economy actually lost 248,000 jobs in September and the government added more than a million Americans to the “not in the labor force” category.  When I first saw that number I truly believed that it was inaccurate.  But you can find the raw figures right here.  According to the Obama administration, there are currently 7.9 million Americans that are “officially unemployed” and another 94.7 million working age Americans that are “not in the labor force”.  That gives us a grand total of 102.6 million working age Americans that do not have a job right now.

That is not an economic recovery – that is an economic depression of an almost unbelievable magnitude.

This is something that my friend Mac Slavo pointed out the other day.  I encourage you to read his analysis right here.  If we measured unemployment the way that we did decades ago, we would all be talking about how similar Obama’s economy is to the Great Depression of the 1930s.

But instead we let the feds get away with feeding us this completely fraudulent “5.1 percent” unemployment number and most of us believe the mainstream media when they tell us that everything is just fine.

Well no, everything is not just fine.  At this point, the labor force participation rate is the lowest that it has been since 1977.  And the labor force participation rate for men is at the lowest level ever recorded.  The only way that the federal government has been able to get the official unemployment rate to go down so much is by pretending that hundreds of thousands of Americans that have been unemployed for a very long time “leave the labor force” each month.

The chart posted below shows how our labor force participation rate has deteriorated since the year 2000.  And in particular, the decline since Obama first entered the White House has been very striking.  Does this look like a “healthy economy” to you?…

Labor Force Participation Rate October 2015

To me, the civilian employment-population ratio is a far more accurate measurement of the employment picture in America than the official unemployment rate is.  Just prior to the last recession, approximately 63 percent of all working age Americans had a job.  During that recession, that figure slipped below 59 percent and it stayed there for several years.  Just recently it slipped back above 59 percent, but as you can see we are now falling once again…

Employment Population Ratio October 2015

The reason this number is falling is because lots of Americans have been losing jobs lately.

In fact, we are seeing layoffs at major firms at a level that we have not witnessed since 2009

The jobs report today has been described as “ugly,” though it certainly didn’t, or shouldn’t have, come out of the blue: Layoffs in the energy, Big Tech, retail, and other sectors have recently mucked up our rosy scenario.

“The third quarter ended with a surge in job cuts,” is how Challenger Gray, which tracks these things, started out its report yesterday. In September, large US-based companies had announced 58,877 layoffs. In the third quarter, they announced 205,759 layoffs, the worst quarter since the 240,233 in the third quarter of 2009!

Year-to-date, we’re at nearly half a million job cut announcements (493,431 to be precise), up 36% from the same period last year.

Some of the companies that have recently announced layoffs include Wal-Mart, RadioShack, Delta, Sprint, ConAgra, Caterpillar, Bank of America, Halliburton, Qualcomm, Microsoft and Hewlett-Packard.

If you need to find a job or you plan to switch jobs in the near future, time is of the essence.  Jobs are going to become much, much harder to find in the months ahead, and so every single day of job searching is absolutely critical at this point.

Right now, there are more than 100 million Americans that get some sort of assistance from the federal government every month.  Government dependence is at a level that we have never seen before in U.S. history, and it is going to get a lot worse.

If we get to a point where the government is either unwilling or unable to take care of all of these people, we are going to have a massive societal problem on our hands.  More than a third of the people living in our nation cannot independently take care of themselves, and more Americans are falling out of the middle class every single day.  When the welfare state starts breaking down, the chaos that will ensue will be far worse than most people would dare to imagine.

So what do you think?

Are job losses and layoffs starting to happen in your area?

Please feel free to add to the discussion by posting a comment below…

Only 44 Percent Of U.S. Adults Are Employed For 30 Or More Hours Per Week

Jobs - Public DomainJim Clifton, the Chairman and CEO of Gallup, says that the percentage of Americans that are employed full-time has been hovering near record lows since the end of the last recession.  But most Americans don’t realize this because the official unemployment numbers are extremely misleading.  In fact, Clifton says that the official 5.6 percent unemployment rate is a “big lie”.  Gallup regularly tracks the percentage of U.S. adults that are employed for 30 or more hours per week, and it is currently at 44.2 percent.  It has been hovering between 42 percent and 45 percent since the end of 2009.  This is extremely low.  As I discussed the other day, there are 8.69 million Americans that are considered to be “officially unemployed” at this point.  But there are another 92.90 million Americans that are considered to be “not in the labor force”.  Millions upon millions of those Americans would work if they could.  Overall, there are 101 million U.S. adults that do not have a job right now.  But you won’t hear that number being discussed by the mainstream media, because it would make Barack Obama look really bad.

Most Americans just assume that the economic numbers that we are being given accurately reflect reality.  That is why it is so refreshing to have men like Jim Clifton step forward and tell the truth.  His recent article entitled “The Big Lie: 5.6% Unemployment” is making headlines all over America.  The following is an extended excerpt from that article…

There’s another reason why the official rate is misleading. Say you’re an out-of-work engineer or healthcare worker or construction worker or retail manager: If you perform a minimum of one hour of work in a week and are paid at least $20 — maybe someone pays you to mow their lawn — you’re not officially counted as unemployed in the much-reported 5.6%. Few Americans know this.

Yet another figure of importance that doesn’t get much press: those working part time but wanting full-time work. If you have a degree in chemistry or math and are working 10 hours part time because it is all you can find — in other words, you are severely underemployed — the government doesn’t count you in the 5.6%. Few Americans know this.

There’s no other way to say this. The official unemployment rate, which cruelly overlooks the suffering of the long-term and often permanently unemployed as well as the depressingly underemployed, amounts to a Big Lie.

And it’s a lie that has consequences, because the great American dream is to have a good job, and in recent years, America has failed to deliver that dream more than it has at any time in recent memory. A good job is an individual’s primary identity, their very self-worth, their dignity — it establishes the relationship they have with their friends, community and country. When we fail to deliver a good job that fits a citizen’s talents, training and experience, we are failing the great American dream.

Gallup defines a good job as 30+ hours per week for an organization that provides a regular paycheck. Right now, the U.S. is delivering at a staggeringly low rate of 44%, which is the number of full-time jobs as a percent of the adult population, 18 years and older.

And Gallup is being extremely generous.

I certainly would not define a 30 hour a week job at minimum wage as a “good job”, but Gallup does.

So the truth is that the percentage of U.S. adults that do have “good jobs” is actually far lower than 44 percent.

In the video that I have posted below, there is much more from Clifton about our current employment crisis…

Pretty strong stuff.

But Clifton also understands that there is danger in speaking out like this.

For example, just check out what he told CNBC during one recent interview…

“I think that the number that comes out of BLS [Bureau of Labor Statistics] and the Department of Labor is very, very accurate. I need to make that very, very clear so that I don’t suddenly disappear. I need to make it home tonight.”

So why are there so few good jobs for Americans?

Well, for one thing, our control freak politicians have absolutely murdered job creation in the United States.

Traditionally, small businesses have been the primary engine of job growth for the U.S. economy.  But for each of the past six years, the number of new businesses being created has been lower than the number of businesses that have died.

Prior to 2008, we had never seen this happen before in all of U.S. history.

Thanks Obama.

Meanwhile, we continue to ship millions of good jobs out of the country, and millions of good jobs are being replaced by technology.

A confluence of factors are coming together to create a perfect storm that is going to be extremely bitter for American workers.

Spending our wealth is not a path to prosperity.  We have got to create wealth in order to be a prosperous nation.

But instead, we continue to buy far, far more from the rest of the world than they buy from us.  We just learned that the trade deficit increased to 46.6 billion dollars in December, and the total trade deficit for the year was more than half a trillion dollars.

This is complete and utter insanity, but at this point the trade deficit is not even a political issue for either major political party anymore.

And the really bad news is that this is about as good as things are going to get for the U.S. economy.  The next major economic downturn is right around the corner, and our employment crisis is going to get much, much worse once that strikes.

Already, layoffs in January were 17.6 percent higher than they were in January a year ago and businesses all over the country are shutting down following a very disappointing holiday season.

In addition, the Baltic Dry Index has dropped to stunningly low levels.  In fact, it is already lower than it was at any point during the last recession.  The following is an excerpt from a recent article by Mac Slavo

The Baltic Dry Index (BDI) is used by economists and stock traders alike as a leading economic indicator because it predicts future economic activity. The index tracks in US dollars and measures global supply and demand for commodity shipments among bulk carriers including raw materials like lumber, coal, metallic ores, and grains. What makes this particular measurement so distinct from others, according to economic Howard Simmons, is that the BDI “is totally devoid of speculative content” because “people don’t book freighters unless they have cargo to move.”

On Thursday, the Baltic Dry Index was sitting at 564, That is not too far above the record low level of 554 that was established in July 1986.

So don’t be fooled by all the happy talk from the mainstream media and from politicians like Barack Obama.

They are lying to you, and their lies will soon be evident for all the world to see.