The Numbers Tell Us That The ‘Economic Recovery’ Is Dead And Businesses Are Failing At A Staggering Pace

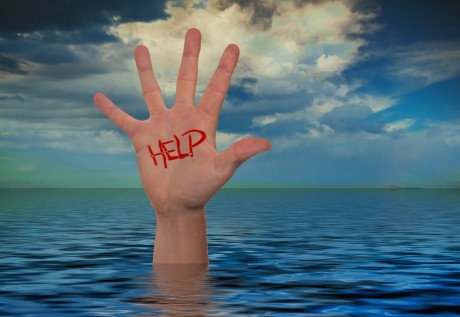
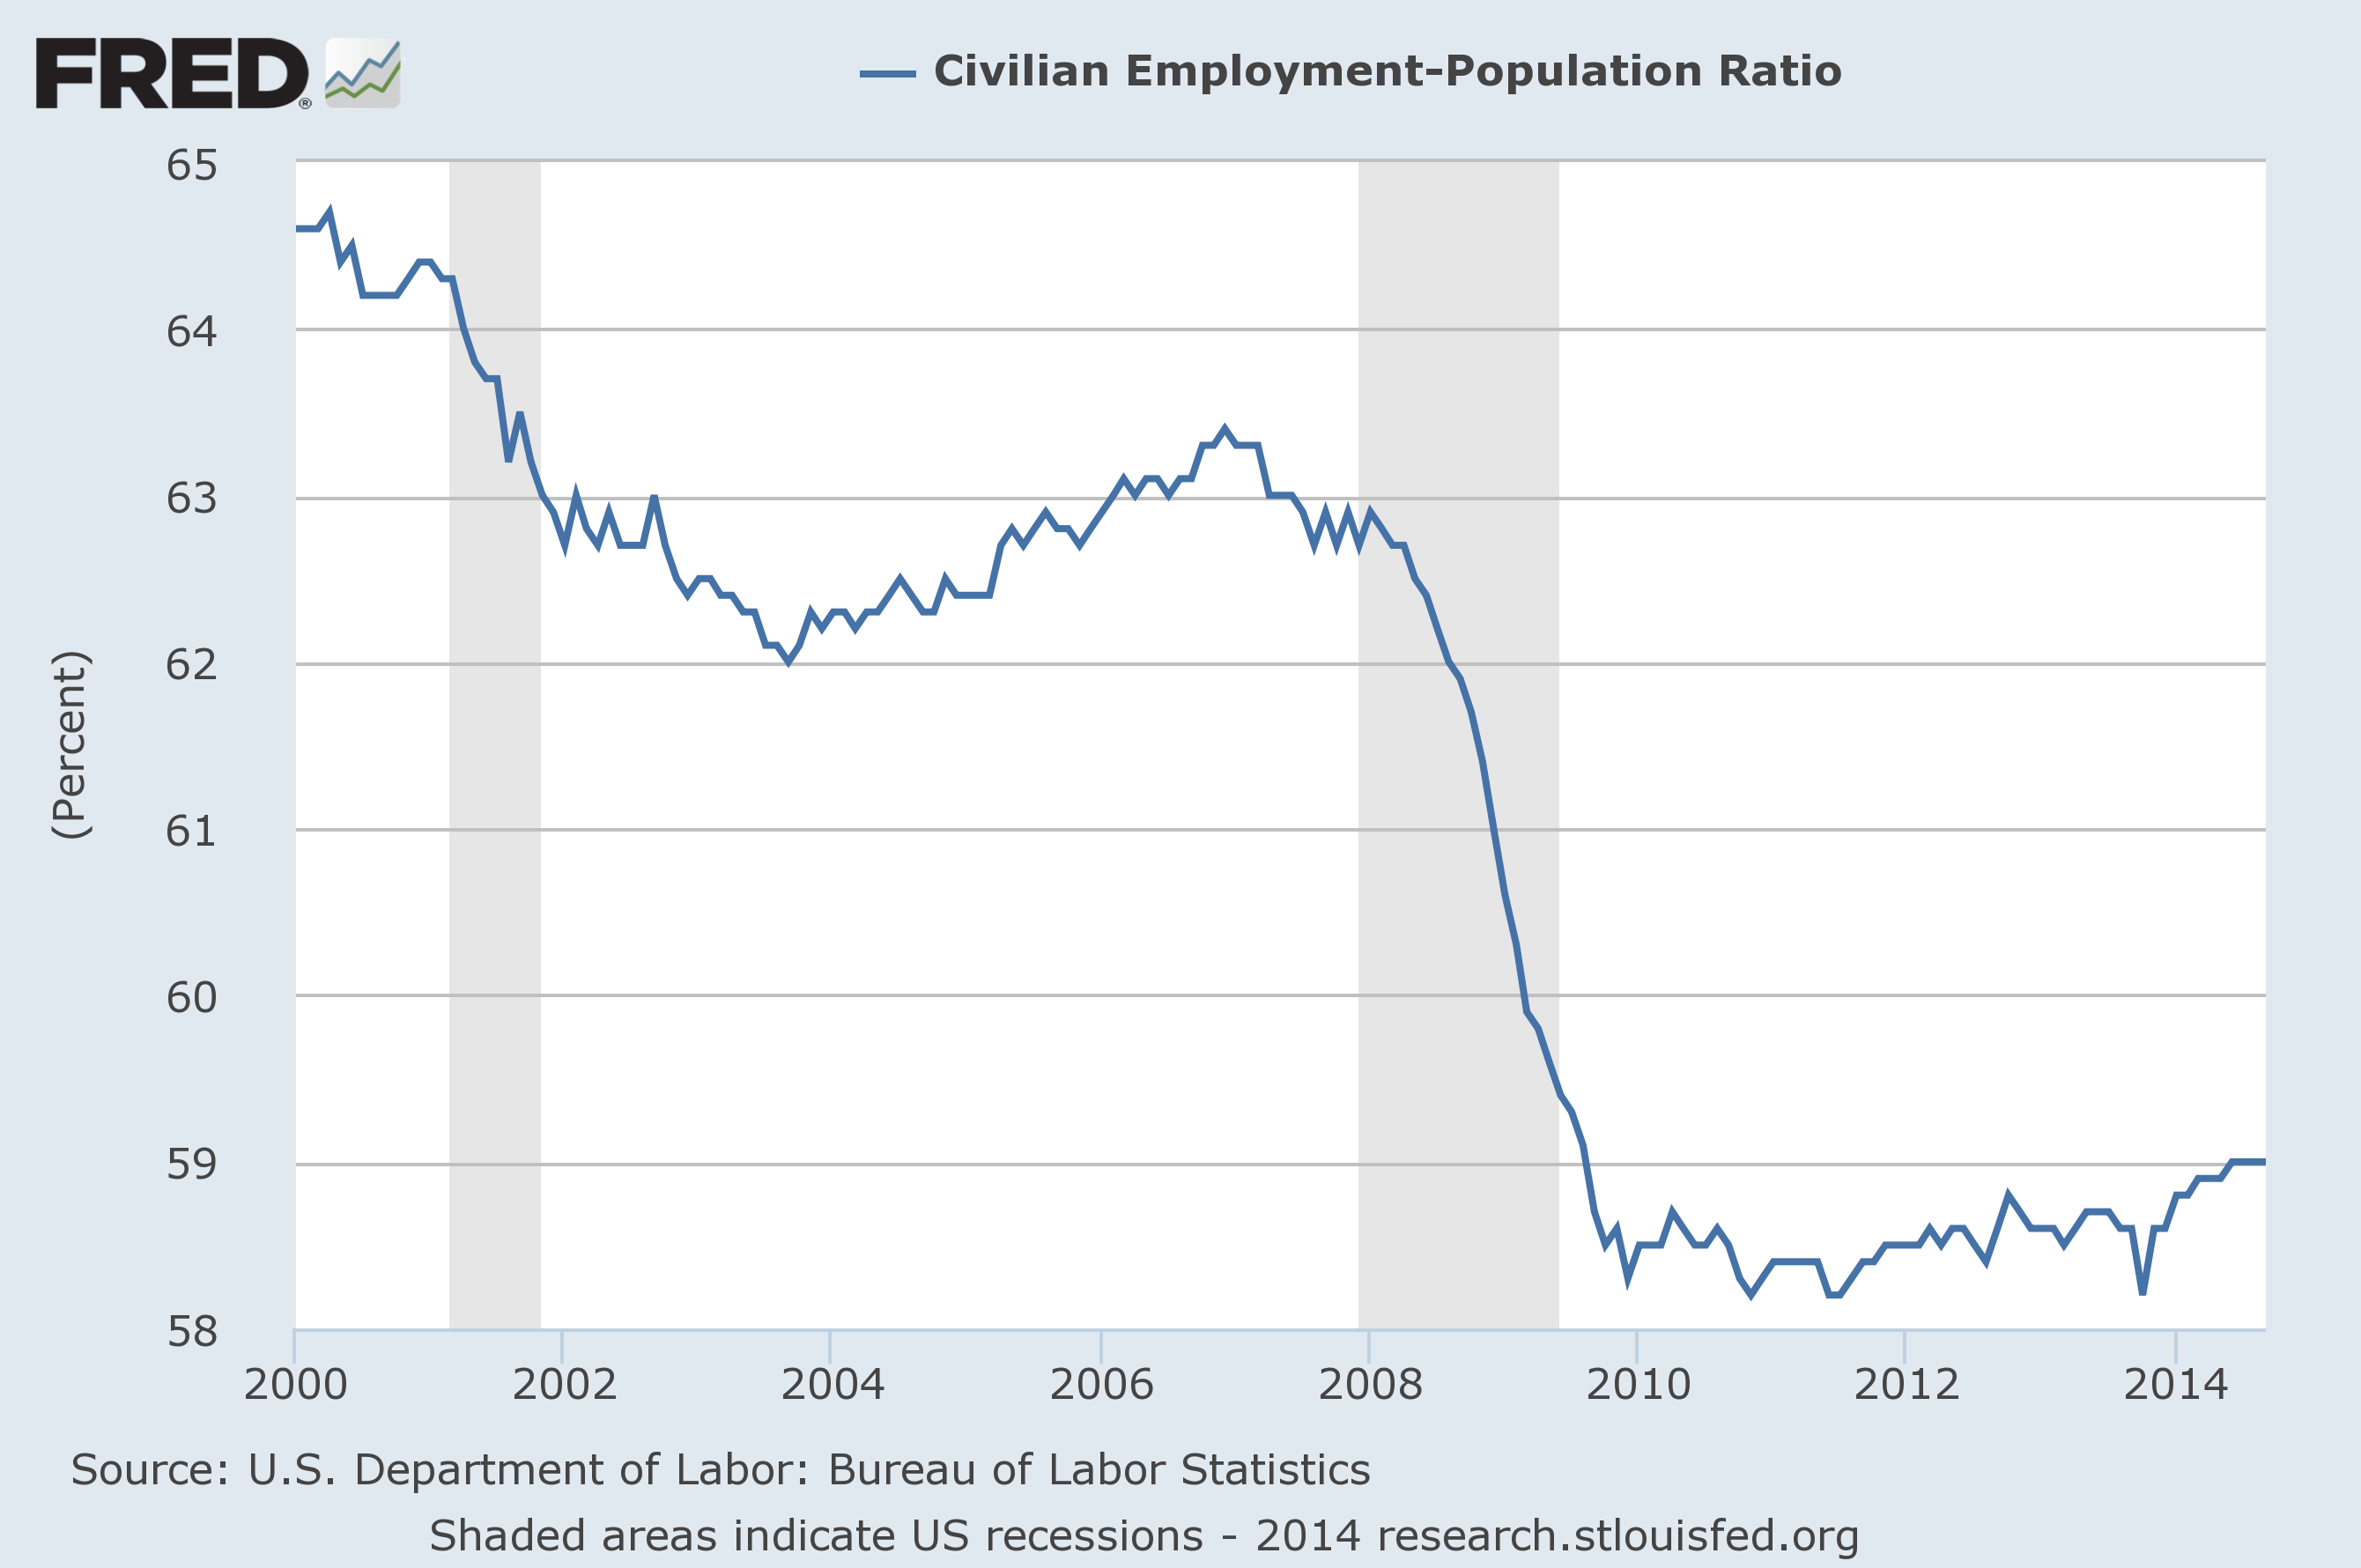
Even though economic conditions were absolutely awful, during the month of June the mainstream media kept insisting that the U.S. economy was “recovering” and the stock market kept surging on every hint of good news.  But now the “economic recovery” narrative is completely dead, because the numbers clearly show that the U.S. economy is rapidly moving in the wrong direction.  On Thursday, the Labor Department announced that another 1.416 million Americans filed new claims for unemployment benefits last week.  Prior to this year, the all-time record for a single week was just 695,000, and so we are talking about a level of unemployment that is absolutely catastrophic.  But what is really alarming many analysts is that the number for last week was quite a bit higher than the number for the week before.  Many states are rolling out new restrictions as the number of confirmed COVID-19 cases continues to surge, and this is having a huge impact on economic activity.  For months I have been warning that fear of COVID-19 would prevent economic activity from returning to normal levels for the foreseeable future, and that is precisely what has happened.

Overall, more than 52 million Americans have filed new claims for unemployment benefits over the past 18 weeks, and that makes this the biggest spike in unemployment in U.S. history by a very wide margin.

In fact, this dwarfs all previous spikes by so much that the others are not even worth mentioning.

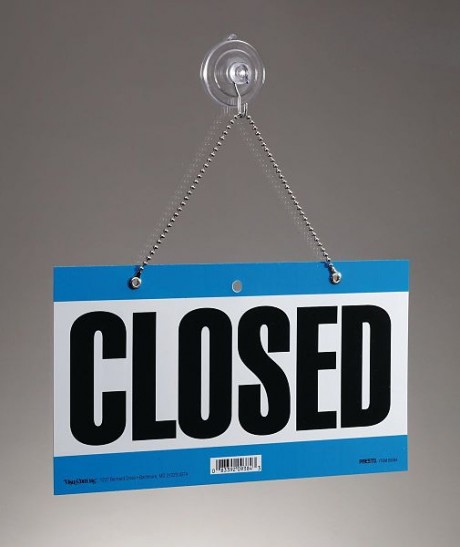
Of course it isn’t just the employment numbers that are depressingly bad.  According to Jefferies, in late June 19 percent of all U.S. small businesses were closed, but now that number has risen to 24.5 percent

As of Sunday, 24.5% of small businesses in the United States were closed, according to Jefferies. That is worse than late June, when only 19% were closed. Jefferies pointed to “particular weakness in COVID hot spots” and noted that small business employment had dropped to levels unseen since the end of May.

Just think about that number for a minute.

Nearly a quarter of all small businesses in the entire country are closed.

And the really bad news is that many of them will never end up reopening.

At the beginning of the pandemic, I received a lot of criticism for stating that many of the small businesses that were shutting down at that time would never open again, but over the long-term the numbers have shown that I was correct.

In fact, Yelp says that a whopping 60 percent of the restaurants that were initially listed as “temporarily closed” on their site are now classified as permanently closed…

It’s tough out there for restaurants and other small businesses.

Yelp’s Economic Average report out Wednesday shows exactly how tough: 60 percent of the 26,160 temporarily closed restaurants on the business review site as of July are now permanently shut. Temporary closures are dropping, and permanent shutdowns are increasing.

Fear of COVID-19 is going to cause a large portion of the population to continue to avoid restaurants for as long as this pandemic persists, and it is becoming clear that it is likely to persist for a long time to come.

We are going to lose so many small and independent places to eat.  Many of the big corporate chains that have very deep pockets will survive, at least for a while, but there is simply no replacing what small and independent restaurants mean to our communities.

Bars and clubs are being hit extremely hard as well.  According to Yelp, 44 percent of the bars and clubs on their site that were initially listed as “temporarily closed” have now been shut down on a permanent basis…

Bars and clubs are also closing forever at high rates: 44 percent (as of July) of 5,454 temporarily shuttered bars and other nightlife establishments are shut for good.

Other sectors of the economy are doing relatively better, but the overall outlook for small businesses in America is exceedingly bleak.

In New York City, it is being projected that one-third of all small businesses will never be able to open again…

As many as 76,000 small businesses in New York City – a third of the 230,000 citywide – may never reopen after forced to close during the COVID-19 lockdown, business leaders have warned.

The Partnership for New York City, a not-for-profit organization that connects business leaders with local government, predicted that 76,000 small businesses will never be able to reopen in a report produced by 14 consulting firms.

I know that number is hard to believe, but this is actually happening.

Our politicians want to encourage people “to go back to work”, but for millions upon millions of Americans the jobs that they once had are gone forever.

Air travel is another industry that is being absolutely devastated by this pandemic.  After a modest bounce in June, the number of air passengers is starting to fall again

The resurgence of coronavirus infections is derailing the travel industry’s modest recovery. The number of air passengers processed through TSA security lines fell during the week ended July 20, compared with the prior week, according to Bank of America. This metric is down more than 70% from a year ago.

United (UAL) CEO Scott Kirby told CNBC on Wednesday that the airline doesn’t “expect to get anywhere close to normal until there’s a vaccine that’s been widely distributed to a large portion of the population.”

All of the numbers that I have shared in this article tell us that we are in an economic depression.

Many had hoped that this economic downturn would be short-lived and that a “V-shaped recovery” would commence once the coronavirus lockdowns were lifted.

But instead a resurgence of cases has caused new restrictions to be implemented, and economic activity is slowing down again.

The bottom line is that all of us need to get prepared to weather a long-term economic storm that is going to be incredibly painful.

The last recession was bad, but it isn’t even worth comparing to the times that we are entering now.  All of our lives are being turned upside down, and a lot of people are not going to be able to handle what comes next.

About the Author: I am a voice crying out for change in a society that generally seems content to stay asleep. My name is Michael Snyder and I am the publisher of The Economic Collapse BlogEnd Of The American Dream and The Most Important News, and the articles that I publish on those sites are republished on dozens of other prominent websites all over the globe. I have written four books that are available on Amazon.com including The Beginning Of The EndGet Prepared Now, and Living A Life That Really Matters. (#CommissionsEarned) By purchasing those books you help to support my work. I always freely and happily allow others to republish my articles on their own websites, but due to government regulations I need those that republish my articles to include this “About the Author” section with each article. In order to comply with those government regulations, I need to tell you that the controversial opinions in this article are mine alone and do not necessarily reflect the views of the websites where my work is republished. The material contained in this article is for general information purposes only, and readers should consult licensed professionals before making any legal, business, financial or health decisions. Those responding to this article by making comments are solely responsible for their viewpoints, and those viewpoints do not necessarily represent the viewpoints of Michael Snyder or the operators of the websites where my work is republished. I encourage you to follow me on social media on Facebook and Twitter, and any way that you can share these articles with others is a great help.  During these very challenging times, people will need hope more than ever before, and it is our goal to share the gospel of Jesus Christ with as many people as we possibly can.

Drowning In Debt: 35 Percent Of All Americans Have Debt That Is At Least 180 Days Past Due

drowning-help-public-domainMore than a third of all Americans can’t pay their debts.  I don’t know about you, but to me that is a shocking figure.  As you will see below, 35 percent of the people living in this country have debt in collections.  When a debt is in  collections, it is at least 180 days past due.  And this is happening during the “economic recovery” that the mainstream media keeps touting, although the truth is that Barack Obama is going to be the only president in United States history to never have a single year when the economy grew by at least 3 percent.  But at least things are fairly stable for the moment, and if this many Americans are having trouble paying their bills right now, what are things going to look like when the economy becomes extremely unstable once again.

The 35 percent figure is a nugget that I discovered in a CNN article about Detroit that I was reading earlier today

And the city’s troubles have left a mark on the financial stability of its residents in a big way, according to a new report from the Urban Institute.

About 66% of residents have debt in collections — meaning more than 180 days past due — at a median amount of $1,847. Across the U.S., 35% of Americans have debt in collections.

It is hard to believe that 66 percent of the residents of one of our largest cities could have debt in collections, but without a doubt the city of Detroit is a complete and utter economic wasteland at this point.

But to me, the 35 percent figure for the nation as a whole is a much greater concern.

And much of the debt that is in collections is credit card debt.

In the immediate aftermath of the last financial crisis, many Americans started getting out of debt, and that was a very good thing.

Unfortunately, that trend has completely reversed itself over the past few years, and now credit card balances are rising at a pace that is quite alarming

Using data from the U.S. Census Bureau and the Federal Reserve, ValuePenguin found that the average credit card debt for households that carry a balance is a shocking $16,048 — a figure that has risen by 10% over the past three years. At the average variable credit card interest rate of 16.1%, this translates to nearly $2,600 in credit card interest alone. And many credit cards have interest rates much higher than the average.

Even scarier, consider that based on the average interest rate and a minimum payment of 1.5% of the balance, it would take nearly 14 years for the typical indebted household to pay off its existing credit card debt, at a staggering cost of more than $40,200. Keep in mind that this assumes no additional credit card debt is added to the tab along the way.

Those that have been there know exactly how it feels to be drowning in credit card debt.

You know, they don’t teach you about credit cards in high school or in college.  At least they didn’t in my day.  So once I got out into the “real world” and discovered the joy of instantly getting whatever I wanted with a credit card, I didn’t understand how painful it would be to pay that money back someday.

If you have credit card balances that are out of control, they can keep you up late into the night.  The worry and the fear can eat away at you like a cancer, and many people play a game of moving balances from one card to another in a desperate attempt to stay afloat.

Fortunately I learned my hard lessons at an early enough age to get things turned around.  Now I warn others about the danger of credit card debt through my writing, and my hope is that the things that I share on my websites are doing some good for others that may be struggling financially.

When you are deep in debt, it is exceedingly difficult to build up any wealth of your own.  This is one of the primary reasons why 69 percent of all Americans have less than $1,000 in savings today.

In essence, more than two-thirds of the country is living paycheck to paycheck, and that is a recipe for disaster when the next major economic downturn in the U.S. strikes.

Overall, household debt in America has now reached a grand total of 12.3 trillion dollars.  When you break that down, it comes to $38,557 for every man, woman and child in the entire nation.

So for a family of five, your share of that total would be $192,785.

And remember, that is just household debt.  That total does not include any form of business debt or any form of government debt.

We truly are a “buy now, pay later” society.  We were the wealthiest and most prosperous nation on the entire planet, and previous generations handed us the keys to the greatest economic machine in world history, but that wasn’t good enough for us.

We always had to have more, more, more – and now we have accumulated more debt than any society in the history of the globe.

It is inevitable that this giant debt bubble is going to burst.  Anyone with an ounce of common sense can see that.

What we experienced in 2008 was just a preview of the hard times that are coming.  The next recession is going to be even worse, and most economists are convinced that it will happen within the next four years no matter who is elected president in November.  The following comes from the Wall Street Journal via the Calculated Risk blog

Economists in The Wall Street Journal’s latest monthly survey of economists put the odds of the next downturn happening within the next four years at nearly 60%.

Just like the last time around, millions of those that are “living on the edge” financially will fall out of the middle class and into poverty when they lose their jobs.

Hopefully most of you that have been reading my work for an extended period of time have already been getting out of debt and have been building up a financial cushion.

Sadly, most of the country continues to act as if they are living in a pre-2008 world, and the economic wake up call that is coming is going to be incredibly painful for those that thought they could get away with being exceedingly reckless financially.

Painful To Watch: This Is The Weakest U.S. Economic ‘Recovery’ Since 1949

Dollar Bending - Public DomainMost of us have never witnessed an economic “recovery” this bad.  As you will see below, the average rate of economic growth since the last recession has been the lowest for any “recovery” in at least 67 years.  And unfortunately, the economy appears to be slowing down even more here in 2016.  On Friday, I talked about how the U.S. economy grew at a painfully slow rate of just 1.2 percent in the second quarter after only growing 0.8 percent during the first quarter.  And last week we also learned that the homeownership rate in the United States has dropped to the lowest level ever.  This is not what a recovery looks like.  Instead, it very much appears that a new economic downturn has already begun.

But don’t just take my word for how painful this economic “recovery” has been.  The following comes from a Wall Street Journal article that was just posted entitled “Seven Years Later, Recovery Remains the Weakest of the Post-World War II Era“…

Even seven years after the recession ended, the current stretch of economic gains has yielded less growth than much shorter business cycles.

In terms of average annual growth, the pace of this expansion has been by far the weakest of any since 1949. (And for which we have quarterly data.) The economy has grown at a 2.1% annual rate since the U.S. recovery began in mid-2009, according to gross-domestic-product data the Commerce Department released Friday.

The prior expansion, from 2001 through 2007, was the only other business cycle of the past 11 when the economy didn’t grow at least 3% a year, on average.

This entire seven year stretch has come while Barack Obama has been in the White House.  After more than seven and a half years, he is solidly on track to be the only president in U.S. history to never have a single year when the U.S. economy grew by at least three percent.

And unlike many presidents, he has had two terms in which to try to accomplish that feat.

One of the industries that had been doing fairly well during this recovery was the auto industry, but now in early 2016 they have found themselves struggling too

Now, the auto sector, which has propped up GDP growth for years, is slowing down. For the first six months, total car and light truck sales, at a seasonally adjusted annual rate (SAAR) of 17.5 million vehicles, are lagging behind last year by 100,000 units. Over the first half, fleet sales to rent-a-car companies and big fleet buyers were up industry wide. But retail sales fell 2%.

All over the corporate world, earnings are down.

In some cases, they are way down.

It is being projected that this will be the fifth quarter in a row when corporate earnings have declined, and even mainstream analysts are now admitting that it is “evident” that we have entered “a global slowdown”

“Earnings season in the U.S. confirms the overall macro picture that we have. We have a global slowdown. It’s evident in all of the major economies,” said Peter Garnry, head of equity strategy at Saxo Bank, on a Bloomberg podcast.

Of course I have been saying this exact thing for the past 12 months, but a lot of people have tuned me out because the stock market in the United States has been doing so well.

But the stock market is not an accurate barometer for the real economy.  It never has been, and it never will be.

If stocks accurately reflected the health of the U.S. economy, they would have already crashed really hard a long time ago.  At this moment, stock prices are completely disconnected from economic reality, and this has many of the most respected names on Wall Street scratching their heads.  One of them is Jeffrey Gundlach, the chief executive of DoubleLine Capital.  Just check out what he told Reuters on Friday

Noting the recent run-up in the benchmark Standard & Poor’s 500 index while economic growth remains weak and corporate earnings are stagnant, Gundlach said stock investors have entered a “world of uber complacency.”

The S&P 500 on Friday touched an all-time high of 2,177.09, while the government reported that U.S. gross domestic product in the second quarter grew at a meager 1.2 percent rate.

“The artist Christopher Wool has a word painting, ‘Sell the house, sell the car, sell the kids.’ That’s exactly how I feel – sell everything. Nothing here looks good,” Gundlach said in a telephone interview. “The stock markets should be down massively but investors seem to have been hypnotized that nothing can go wrong.”

If you follow Gundlach, you probably already know that he has been dead on accurate with regard to the financial markets over the past couple of years.

So when he says that the stock market “should be down massively” and that it is time to “sell everything”, we should all take him very, very seriously.

All throughout history, a huge decline in corporate earnings has almost always resulted in a huge decline in stock prices.  As Jesse Felder has noted, “we have never seen a decline in earnings of this magnitude without at least a 20% fall in stock prices” during the last 50 years.

To any rational observer, it is quite obvious that stock prices should have already started collapsing quite some time ago.

And to a large extent this has already happened around the planet, but here in the United States stocks continue to defy the laws of economics.

But at this point it isn’t going to do much good to warn people about this.  Those that could see the danger coming have already pulled their money out of stocks, and most of those that want to stick their heads in the sand and pretend that things are somehow going to be different this time are not likely to be persuaded this late in the game.

In the end, we should all be grateful that this absurd financial bubble has lasted for as long as it has, because stability is much more pleasant than instability.  The U.S. economy and the U.S. financial system have enjoyed a prolonged period of stability that has defied all the odds, and let us hope that it lasts for at least a little while longer…

Economic Recovery? 13 Of The Biggest Retailers In America Are Closing Down Stores

Closed Sign - Photo by JamesAlan1986Barack Obama recently stated that anyone that is claiming that America’s economy is in decline is “peddling fiction“.  Well, if the economy is in such great shape, why are major retailers shutting down hundreds of stores all over the country?  Last month, I wrote about the “retail apocalypse” that is sweeping the nation, but since then it has gotten even worse.  Closing stores has become the “hot new trend” in the retail world, and “space available” signs are going up in mall windows all over the United States.  Barack Obama can continue huffing and puffing about how well the middle class is doing all he wants, but the truth is that the cold, hard numbers that retailers are reporting tell an entirely different story.

Earlier today, Sears Chairman Eddie Lampert released a letter to shareholders that was filled with all kinds of bad news.  In this letter, he blamed the horrible results that Sears has been experiencing lately on “tectonic shifts” in consumer spending

In a letter to shareholders on Thursday, Lampert said the impact of “tectonic shifts” in consumer spending has spread more broadly in the last year to retailers “that had previously proven to be relatively immune to such shifts.”

“Walmart, Nordstrom, Macy’s, Staples, Whole Foods and many others have felt the impact of disruptive changes from online competition and new business models,” Lampert wrote.

And it is very true – Sears is doing horribly, but they are far from alone.  The following are 13 major retailers that are closing down stores…

#1 Sears lost 580 million dollars in the fourth quarter of 2015 alone, and they are scheduled to close at least 50 more “unprofitable stores” by the end of this year.

#2 It is being reported that Sports Authority will file for bankruptcy in March.  Some news reports have indicated that around 200 stores may close, but at this point it is not known how many of their 450 stores will be able to stay open.

#3 For decades, Kohl’s has been growing aggressively, but now it plans to shutter 18 stores in 2016.

#4 Target has just finished closing 13 stores in the United States.

#5 Best Buy closed 30 stores last year, and it says that more store closings are likely in the months to come.

#6 Office Depot plans to close a total of 400 stores by the end of 2016.

The next seven examples come from one of my previous articles

#7 Wal-Mart is closing 269 stores, including 154 inside the United States.

#8 K-Mart is closing down more than two dozen stores over the next several months.

#9 J.C. Penney will be permanently shutting down 47 more stores after closing a total of 40 stores in 2015.

#10 Macy’s has decided that it needs to shutter 36 stores and lay off approximately 2,500 employees.

#11 The Gap is in the process of closing 175 stores in North America.

#12 Aeropostale is in the process of closing 84 stores all across America.

#13 Finish Line has announced that 150 stores will be shutting down over the next few years.

These store closings can be particularly cruel for small towns.  Just consider the impact that Wal-Mart has had on the little town of Oriental, North Carolina

The Town’n Country grocery in Oriental, North Carolina, a local fixture for 44 years, closed its doors in October after a Wal-Mart store opened for business. Now, three months later — and less than two years after Wal-Mart arrived — the retail giant is pulling up stakes, leaving the community with no grocery store and no pharmacy.

Though mom-and-pop stores have steadily disappeared across the American landscape over the past three decades as the mega chain methodically expanded, there was at least always a Wal-Mart left behind to replace them. Now the Wal-Marts are disappearing, too.

Of course there are many factors involved in this ongoing retail apocalypse.  Competition from online retailers is becoming more intense, and consumer spending patterns are rapidly changing.

But in the end, the truth is that you can’t get blood out of a rock.  The middle class in America is shrinking, and there just isn’t as much discretionary spending going on as there used to be.

And now that we have entered a new economic downturn, many retailers are finding that there are some local communities that can no longer support their stores.  The following comes from CNBC

Though the shift to online shopping is no doubt playing a role in lighter foot traffic at malls, there’s more to their changing economics than the rise of Amazon. Changing demographics in a town are another reason a shopping center could struggle or fail — for example, if massive layoffs in a particular industry cause people to move away to find employment.

“A lot of people want to try and tie it to the Internet or ‘that’s not cool,’ or teens don’t like it,” Jesse Tron, a spokesman for industry trade group International Council of Shopping Centers, told CNBC last year. “It’s hard to support large-format retail in those suburban areas when people are trying to just pay their mortgage.”

In order to have a thriving middle class, we need good paying middle class jobs.  Unfortunately, our economy has been bleeding those kinds of jobs quite rapidly.  For example, Halliburton just announced that it is eliminating 5,000 more jobs after getting rid of 4,000 workers at the end of last year.

During the Obama years, good paying middle class jobs have been getting replaced by low paying service jobs.  At this point, 51 percent of all American workers make less than $30,000 a year.

And there is no way that you can support a middle class family with children on $30,000 a year.

We have an economy that is in the process of failing.  We can see it in the explosion of subprime auto loans that are going bad, we can see it in the hundreds of retail stores that are shutting down, and we can see it in the tens of thousands of good paying energy jobs that are being lost.

During the Obama years, interest rates have been pushed to the floor, the Federal Reserve has created trillions of dollars out of thin air, and the size of our national debt is getting close to doubling.  Despite all of those desperate measures, our economy continues to crumble.

We stole from the future to try to paper over our failures and it didn’t work.  Now an economic downturn that will ultimately turn out to be even worse than the “Great Recession” of 2008 and 2009 has begun, and our leaders have absolutely no idea how to fix things.

I wish I had better news to report, but I don’t.  Get prepared now, because very rough times are ahead.

The Baltic Dry Shipping Index Just Collapsed To An All-Time Record Low

Globe Matrix - Public DomainI was absolutely stunned to learn that the Baltic Dry Shipping Index had plummeted to a new all-time record low of 504 at one point on Thursday.  I have written a number of articles lately about the dramatic slowdown in global trade, but I didn’t realize that things had gotten quite this bad already.  Not even during the darkest moments of the last financial crisis did the Baltic Dry Shipping Index drop this low.  Something doesn’t seem to be adding up, because the mainstream media keeps telling us that the global economy is doing just fine.  In fact, the Federal Reserve is so confident in our “economic recovery” that they are getting ready to raise interest rates.  Of course the truth is that there is no “economic recovery” on the horizon.  In fact, as I wrote about yesterday, there are signs all around us that are indicating that we are heading directly into another major economic crisis.  This staggering decline of the Baltic Dry Shipping Index is just another confirmation of what is directly ahead of us.

Overall, the Baltic Dry Index is down more than 60 percent over the past 12 months.  Global demand for shipping is absolutely collapsing, and yet very few “experts” seem alarmed by this.  If you are not familiar with the Baltic Dry Shipping Index, the following is a pretty good definition from Investopedia

A shipping and trade index created by the London-based Baltic Exchange that measures changes in the cost to transport raw materials such as metals, grains and fossil fuels by sea. The Baltic Exchange directly contacts shipping brokers to assess price levels for a given route, product to transport and time to delivery (speed).

The Baltic Dry Index is a composite of three sub-indexes that measure different sizes of dry bulk carriers (merchant ships) – Capesize, Supramax and Panamax. Multiple geographic routes are evaluated for each index to give depth to the index’s composite measurement.

It is also known as the “Dry Bulk Index”.

Much of the decline of the Baltic Dry Shipping Index is being blamed on China.  The following comes from a Bloomberg report that was posted on Thursday…

The cost of shipping commodities fell to a record, amid signs that Chinese demand growth for iron ore and coal is slowing, hurting the industry’s biggest source of cargoes.

The Baltic Dry Index, a measure of shipping rates for everything from coal to ore to grains, fell to 504 points on Thursday, the lowest data from the London-based Baltic Exchange going back to 1985. Among the causes of shipowners’ pain is slowing economic growth in China, which is translating into weakening demand for imported iron ore that’s used to make the steel.

So many of the exact same patterns that we witnessed back in 2008 are playing out once again in front of our very eyes.  Below, I have shared a chart that was posted by Zero Hedge, and it shows how the Baltic Dry Shipping Index absolutely collapsed in 2008 as we headed into a major financial crisis.  Well, now the Index is collapsing again, and it is already lower than it was at any point back in 2008…

Baltic Dry Index - Zero Hedge

The evidence continues to mount that we are steamrolling toward a deflationary economic slowdown that is worldwide in scope.

Just look at the price of U.S. oil.  It just keeps on falling, and as I write this article it is sitting at $40.40.

The price of oil collapsed just before the financial crisis of 2008, and the same pattern is happening again.

And look at what is happening to commodities. The Thomson Reuters/CoreCommodity CRB Commodity Index has plummeted to the lowest level that we have seen since the last recession. It is now down more than 30 percent over the past 12 months, and it continues to fall.

So don’t be fooled by the temporary “stock market recovery” that we have witnessed.  The underlying economic fundamentals continue to decline.  We are entering a global deflationary recession, and the stock market will get the memo at some point just like we saw in 2008.

At this moment, global financial markets are teetering on the brink, and all it is going to take is some kind of major trigger event to send them tumbling over the edge.

And such an event may be coming sooner than you may think.

We live at a time when global terrorism is surging, relationships between nations are deteriorating and our planet is shaking in wild and unpredictable ways.

It wouldn’t take much to push the financial world into full-blown panic mode.  A major regional war in the Middle East, a terror attack that kills thousands, or an earthquake or volcanic eruption that affects a large U.S. city are all potential examples of “black swan events” which could fit the bill.

The global financial system has never been more primed for another 2008-style crisis.  Thanks to the fragility of the system, it could literally happen any day now.

So keep your eyes open – within weeks our world could be completely and totally different.

10 Charts Which Show We Are Much Worse Off Than Just Before The Last Economic Crisis

10 Charts Economic CrisisIf you believe that ignorance is bliss, you might not want to read this article.  I am going to dispel the notion that there has been any sort of “economic recovery”, and I am going to show that we are much worse off than we were just prior to the last economic crisis.  If you go back to 2007, people were feeling really good about things.  Houses were being flipped like crazy, the stock market was booming and unemployment was relatively low.  But then the financial crisis of 2008 struck, and for a while it felt like the world was coming to an end.  Of course it didn’t come to an end – it was just the first wave of our problems.  The waves that come next are going to be the ones that really wipe us out.  Unfortunately, because we have experienced a few years of relative stability, many Americans have become convinced that Barack Obama, Janet Yellen and the rest of the folks in Washington D.C. have fixed whatever problems caused the last crisis.  Even though all of the numbers are screaming otherwise, there are millions upon millions of people out there that truly believe that everything is going to be okay somehow.  We never seem to learn from the past, and when this next economic downturn strikes it is going to do an astonishing amount of damage because we are already in a significantly weakened state from the last one.

For each of the charts that I am about to share with you, I want you to focus on the last shaded gray bar on each chart which represents the last recession.  As you will see, our economic problems are significantly worse than they were just before the financial crisis of 2008.  That means that we are far less equipped to handle a major economic crisis than we were the last time.

#1 The National Debt

Just prior to the last recession, the U.S. national debt was a bit above 9 trillion dollars.  Since that time, it has nearly doubled.  So does that make us better off or worse off?  The answer, of course, is obvious.  And even though Barack Obama promises that “deficits are under control”, more than a trillion dollars was added to the national debt in fiscal year 2014.  What we are doing to future generations by burdening them with so much debt is beyond criminal.  And so what does Barack Obama want to do now?  He wants to ramp up government spending and increase the debt even faster.  This is something that I covered in my previous article entitled “Barack Obama Says That What America Really Needs Is Lots More Debt“.

Presentation National Debt

#2 Total Debt

Over the past 40 years, the total amount of debt in the United States has skyrocketed to astronomical heights.  We have become a “buy now, pay later” society with devastating consequences.  Back in 1975, our total debt level was sitting at about 2.5 trillion dollars.  Just prior to the last recession, it was sitting at about 50 trillion dollars, and today we are rapidly closing in on 60 trillion dollars.

Presentation Credit Market Instruments

#3 The Velocity Of Money

When an economy is healthy, money tends to change hands and circulate through the system quite rapidly.  So it makes sense that the velocity of money fell dramatically during the last recession.  But why has it kept going down since then?

Presentation Velocity Of M2

#4 The Homeownership Rate

Were you aware that the rate of homeownership in the United States has fallen to a 20 year low?  Traditionally, owning a home has been a sign that you belong to the middle class.  And the last recession was really rough on the middle class, so it makes sense that the rate of homeownership declined during that time frame.  But why has it continued to steadily decline ever since?

Presentation Homeownership Rate

#5 The Employment Rate

Barack Obama loves to tell us how the unemployment rate is “going down”.  But as I will explain later in this article, this decline is primarily based on accounting tricks.  Posted below is a chart of the civilian employment-population ratio.  Just prior to the last recession, approximately 63 percent of the working age population of the United States was employed.  During the recession, this ratio fell to below 59 percent and it stayed there for several years.  Just recently it has peeked back above 59 percent, but we are still very, very far from where we used to be, and now the next economic downturn is rapidly approaching.

Presentation Employment Population Ratio

#6 The Labor Force Participation Rate

So how can Obama get away with saying that the unemployment rate has gone down dramatically?  Well, each month the government takes thousands upon thousands of long-term unemployed workers and decides that they have been unemployed for so long that they no longer qualify as “part of the labor force”.  As a result, the “labor force participation rate” has fallen substantially since the end of the last recession…

Presentation Labor Force Participation Rate

#7 The Inactivity Rate For Men In Their Prime Working Years

If things are “getting better”, then why are so many men in their prime working years doing nothing at all?  Just prior to the last recession, the inactivity rate for men in their prime working years was about 9 percent.  Today it is just about 12 percent.

Presentation Inactivity Rate

#8 Real Median Household Income

Not only is a smaller percentage of Americans employed today than compared to just prior to the last recession, the quality of our jobs has gone down as well.  This is one of the factors which has resulted in a stunning decline of real median household income.

Presentation Real Median Household Income

I have shared these next numbers before, but they bear repeating.  In America today, most Americans do not make enough to support a middle class lifestyle on a single salary.  The following figures come directly from the Social Security Administration

-39 percent of American workers make less than $20,000 a year.

-52 percent of American workers make less than $30,000 a year.

-63 percent of American workers make less than $40,000 a year.

-72 percent of American workers make less than $50,000 a year.

We all know people that are working part-time jobs because that is all that they can find in this economy.  As the quality of our jobs continues to deteriorate, the numbers above are going to become even more dismal.

#9 Inflation

Even as our incomes have stagnated, the cost of living just continues to rise steadily.  For example, the cost of food and beverages has gone up nearly 50 percent just since the year 2000.

Presentation Food Inflation

#10 Government Dependence

As the middle class shrinks and the number of Americans that cannot independently take care of themselves soars, dependence on the government is reaching unprecedented heights.  For instance, the federal government is now spending about twice as much on food stamps as it was just prior to the last recession.  How in the world can anyone dare to call this an “economic recovery”?

Presentation Government Spending On Food Stamps

So you tell me – are things “getting better” or are they getting worse?

To me, it is crystal clear that we are in much worse condition than we were just prior to the last economic crisis.

And now things are setting up in textbook fashion for the next great economic crisis.  Unfortunately, most Americans are totally clueless about what is going on and the vast majority are completely and totally unprepared for what is coming.

Or could it be possible that I am wrong?  Whether you agree or disagree with me, please feel free to add to the discussion by posting a comment below…

19 Very Surprising Facts About The Messed Up State Of The U.S. Economy

19 - Public DomainBarack Obama and the Federal Reserve are lying to you.  The “economic recovery” that we all keep hearing about is mostly just a mirage.  The percentage of Americans that are employed has barely budged since the depths of the last recession, the labor force participation rate is at a 36 year low, the overall rate of homeownership is the lowest that it has been in nearly 20 years and approximately 49 percent of all Americans are financially dependent on the government at this point.  In a recent article, I shared 12 charts that clearly demonstrate the permanent damage that has been done to our economy over the last decade.  The response to that article was very strong.  Many people were quite upset to learn that they were not being told the truth by our politicians and by the mainstream media.  Sadly, the vast majority of Americans still have absolutely no idea what is being done to our economy.  For those out there that still believe that we are doing “just fine”, here are 19 more facts about the messed up state of the U.S. economy…

#1 After accounting for inflation, median household income in the United States is 8 percent lower than it was when the last recession started in 2007.

#2 The number of part-time workers in America has increased by 54 percent since the last recession began in December 2007.  Meanwhile, the number of full-time jobs has dropped by more than a million over that same time period.

#3 More than 7 million Americans that are currently working part-time jobs would actually like to have full-time jobs.

#4 The jobs gained during this “recovery” pay an average of 23 percent less than the jobs that were lost during the last recession.

#5 The number of unemployed workers that have completely given up looking for work is twice as high now as it was when the last recession began in December 2007.

#6 When the last recession began, about 17 percent of all unemployed workers had been out of work for six months or longer.  Today, that number sits at just above 34 percent.

#7 Due to a lack of decent jobs, half of all college graduates are still relying on their parents financially when they are two years out of school.

#8 According to a new method of calculating poverty devised by the U.S. Census Bureau, the state of California currently has a poverty rate of 23.4 percent.

#9 According to the New York Times, the “typical American household” is now worth 36 percent less than it was worth a decade ago.

#10 In 2007, the average household in the top 5 percent had 16.5 times as much wealth as the average household overall.  But now the average household in the top 5 percent has 24 times as much wealth as the average household overall.

#11 In an absolutely stunning development, the rate of small business ownership in the United States has plunged to an all-time low.

#12 Subprime loans now make up 31 percent of all auto loans in America.  Didn’t that end up really badly when the housing industry tried the same thing?

#13 The average cost of producing a barrel of shale oil in the United States is approximately 85 dollars.  Now that the price of oil is starting to slip under that number, the “shale boom” in America could turn into a bust very rapidly.

#14 On a purchasing power basis, China now actually has a larger economy than the United States does.

#15 It is hard to believe, but there are 49 million people that are dealing with food insecurity in America today.

#16 There are six banks in the United States that pretty much everyone agrees fit into the “too big to fail” category.  Five of them have more than 40 trillion dollars of exposure to derivatives.

#17 The 113 top earning employees at the Federal Reserve headquarters in Washington D.C. make an average of $246,506 a year.  It turns out that ruining the U.S. economy is a very lucrative profession.

#18 We are told that the federal deficit is under control, but the truth is that the U.S. national debt increased by more than a trillion dollars during fiscal year 2014.

#19 An astounding 40 million dollars has been spent just on vacations for Barack Obama and his family.  Perhaps he figures that if we are going down as a nation anyway, he might as well enjoy the ride.

If our economy truly was “recovering”, there would be lots of good paying middle class jobs available.

But that is not the case at all.

I know so many people in their prime working years that spend day after day searching for a job.  Most of them never seem to get anywhere.  It isn’t because they don’t have anything to offer.  It is just that the labor market is absolutely saturated with qualified job seekers.

For example, USA Today recently shared the story of 42-year-old Alex Gomez…

“I’ve had to seriously downgrade my living situation,” said Alex Gomez, a 42-year-old with a master’s degree in entrepreneurship. Gomez lost his last full-time job in 2009 and has been looking for work since a short-term contract position ended in 2012.

Gomez’s home was foreclosed on, so the Tampa resident lives with three roommates in a college neighborhood. He drained his 401(k) trying to save his house, and he has around $150,000 in student loans. His mother is tapping her 401(k) to pay his rent. Gomez subsists on that and about $200 a month in food stamps.

“I have been applying and looking for pretty much anything at this stage,” he said. Although he’s looking for work in engineering or data management, “I applied to a supermarket as a deli clerk because I used to be a deli clerk as a teenager,” he said. He was told he was overqualified and turned down.

Does Alex Gomez have gifts and abilities to share with our society?

Of course he does.

So why can’t he find a job?

It is because we have a broken economy.

We are in the midst of a long-term economic decline and the system simply does not work properly anymore.

And thanks to decades of very foolish decisions, this is only the start of our problems.

Things are only going to get worse from here.

This Is About As Good As Things Are Going To Get For The Middle Class – And It’s Not That Good

Depressed - Public DomainThe U.S. economy has had six full years to bounce back since the financial collapse of 2008, and it simply has not happened.  Median household income has declined substantially since then, total household wealth for middle class families is way down, the percentage of the population that is employed is still about where it was at the end of the last recession, and the number of Americans that are dependent on the government has absolutely exploded.  Even those that claim that the economy is “recovering” admit that we are not even close to where we used to be economically.  Many hope that someday we will eventually get back to that level, but the truth is that this is about as good as things are ever going to get for the middle class.  And we should enjoy this period of relative stability while we still can, because when the next great financial crisis strikes things are going to fall apart very rapidly.

The U.S. Census Bureau has just released some brand new numbers, and they are quite sobering.  For example, after accounting for inflation median household income in the United States has declined a total of 8 percent from where it was back in 2007.

That means that middle class families have significantly less purchasing power than they did just prior to the last major financial crisis.

And one research firm is projecting that it is going to take until 2019 for median household income to return to the level that we witnessed in 2007…

For everybody wondering why the economic recovery feels like a recession, here’s the answer: We’re still at least five years away from regaining everything lost during the 2007-2009 downturn.

Forecasting firm IHS Global Insight predicts that real median household income — perhaps the best proxy for middle-class living standards — won’t reach the prior peak from 2007 until 2019. Since the numbers are adjusted for inflation, that means the typical family will wait 12 years until their purchasing power is as strong as it was before the recession. That would be the longest period of stagnation, by far, since the Great Depression of the 1930s.

Of course that projection assumes that the economy will continue to “recover”, which is a very questionable assumption at best.

Meanwhile, total household wealth has been declining for middle class families as well.

According to the New York Times, the “typical American household” is now worth 36 percent less than it was worth a decade ago.

That is a pretty substantial drop.  But you never hear our politicians (especially the Democrats) bring up numbers like that because they want us to feel good about things.

So why is all of this happening?

The biggest reason why the middle class is struggling so much is the lack of good jobs.

As the chart posted below demonstrates, the percentage of the working age population that is actually employed is still way, way below where it was prior to the last recession…

Employment Population Ratio

The “employment recovery” (the tiny little bump at the end of the chart) has been so miniscule that it is hardly even worth mentioning.

At the moment, we still have 1.4 million fewer full-time jobs than we did in 2008 even though more than 100,000 people are added to the U.S. population each month.

And a lot of the workers that have lost jobs since the start of the last recession have never been able to find a new one.

According to a brand new survey conducted by Rutgers University, more than 20 percent of all workers that have been laid off in the past five years still have not found a new job.

Meanwhile, the control freak bureaucrats that run this country continue to kill off small businesses.

In recent years we have seen large numbers of small businesses fail, and at this point the rate of small business ownership in the United States is at an all-time low.

As a result of everything that you have just read, the middle class is shrinking and dependence on the government is soaring.

Today, there are 49 million Americans that are dealing with food insecurity, and Americans received more than 2 trillion dollars in benefits from the federal government last year alone.

For many more statistics just like this, please see my previous article entitled “30 stats to show to anyone that does not believe the middle class is being destroyed“.

Without a doubt, things are not that good for the middle class in America these days.

Unfortunately, the next great wave of financial trouble is rapidly approaching, and once it strikes things are going to get substantially worse for the middle class.

Yes, the stock market set record high after record high this summer.  But what we have observed is classic bubble behavior.  So many of the exact same patterns that occurred just prior to previous stock market crashes are happening once again.

And it is interesting to note that September 22nd has marked important market peaks at various times throughout history…

For traders, September 22 is one of those days with a notorious history. UBS’s Art Cashin notes that September 22 marked various market highs in 1873, 1929, 1980, and even as recent as 2008.

Could the coming months be the beginning of the next major stock market decline?

Small-cap stocks are already starting to show signs of real weakness.  In fact, the Russell 2000 just hit a “death cross” for the first time in more than 2 years

The Russell 2000 has been diverging from the broader market over the last several weeks, and now technicians point out it has flashed a bearish signal. For the first time in more than two years, the small-cap index has hit a so-called death cross.

A death cross occurs when a nearer-term 50-day moving average falls below a longer-term, 200-day moving average. Technicians argue that a death cross can be a bearish sign.

None of us knows what the market is going to do tomorrow, but a lot of the “smart money” is getting out of the market right now while the getting is good.

So where is the “smart money” putting their assets?

In a previous article, I discussed how sales of gold bars to wealthy clients is way up so far this year.

And CNBC has just reported that the ultra-wealthy “are holding mountains of cash” right now…

Billionaires are holding mountains of cash, offering the latest sign that the ultra-wealthy are nervous about putting more money into today’s markets.

According to the new Billionaire Census from Wealth-X and UBS, the world’s billionaires are holding an average of $600 million in cash each—greater than the gross domestic product of Dominica.

Why are they doing this?

Are they concerned about the potential of a market crash?

And if we do see another market crash like we witnessed back in 2008, what is that going to mean for the rest of us?

2008 certainly did not destroy our economy.

But it did cause an immense amount of damage that we have never recovered from.

Now the next wave is approaching, and most people don’t even see it coming.