Detroit Has Gone From Being The Greatest Manufacturing City In The World To A Global Joke

The Ruins Of Detroit - Photo by Csmcm
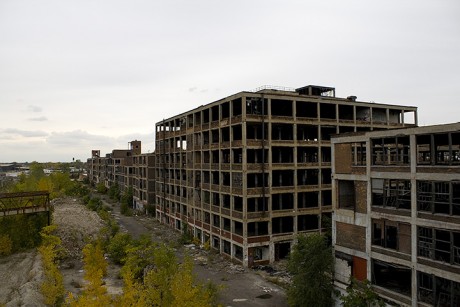
In 1960, the city of Detroit was the greatest manufacturing city that the world had ever seen.  Nearly two million people lived there, and it had the highest per capita income in the United States.  That may be hard to believe, because today it actually has one of the lowest per capita incomes of all of our major cities.  Over the decades more than a million people have left the city, and thousands of abandoned homes have been torn down.  But there are still tens of thousands of abandoned dwellings that remain standing, and some have sold for as little as one dollar in recent years.  Once Detroit was the envy of the entire planet, but now it has become a global joke and in other countries they love to do news stories about “the ruins of Detroit” to show how rapidly America is rotting and decaying.  Sadly, Detroit is far from alone, because there are other formerly great manufacturing cities that have declined just as fast as Detroit has.

Earlier today, I came across a video that contains footage that someone recently captured as they drove through the city of Detroit at night.  To say that the footage is disturbing would be a tremendous understatement

It has become known as a mecca of violent crime and poverty, and now a viral video is giving an unpleasant view of Detroit after dark.

The clip, called Driving through Detroit at night, was filmed by a woman who was a passenger in a car going around the Motor City and was posted to Twitter at the weekend.

It shows terrifying scenes of gangs gathered on the sidewalk, prostitutes lifting up their skirts and dancing, and even a man being run over by a car on purpose.

I would have liked to share the video with you all, but it is just way too graphic.  There really are prostitutes lifting up their skirts in the video, and a man really is hit by a vehicle.  If you want to watch it for yourself, it is very easy to find on YouTube.  But please be warned that children should not be watching this.

If you live in a peaceful rural or suburban setting, the kind of behavior displayed in this video may seem very foreign to you.  In America today, it is way too easy to allow our televisions to define reality for us.  But the warped view of reality that we get through our televisions is nothing like the real world.  The real world is cold, cruel and very unforgiving.

If you are in the wrong place at the wrong time, the real world will eat you alive.

In the city of Detroit today, close to half the population is functionally illiterate, and one survey found that 60 percent of all children in the city are living in poverty.  It has been reported that 40 percent of the street lights do not work, and as you can see from the video it is a very frightening place to be after dark.

And don’t count on the police to help you.  The size of the police force in Detroit has been reduced by about 40 percent over the years, and it has been estimated that it takes the Detroit police an average of 58 minutes to respond to a call.

If it was just one major city where all of these things were happening, that would be bad enough.

Sadly, the truth is that what is happening in Detroit is happening all over the nation.  In fact, St. Louis and Memphis now have higher gun crime rates than Detroit does

The listing places St Louis above the notoriously dangerous Detroit which has topped the list in previous years thanks to the city’s high gun crime rate.

Detroit is now listed as third after Memphis, Tennessee which had 84.2 violent crimes per 10,000 residents.

Birmingham, Alabama comes in fourth place with 82.8 violent crimes per 10,000 residents while Rockford, Illinois was fifth with a rate of 76.3.

Earlier this month, we saw how a major city such as Milwaukee can erupt in flames in just a matter of hours.  And in Chicago, some of the major gangs have agreed to use automatic weapons and sniper fire in their battle against the police.

A spirit of chaos and violence has descended on America, and things are going to get much worse during the months and years to come.

Meanwhile, crime continues to rise in our smaller cities and in our suburbs as well.  For a moment, I want you to consider a short excerpt from a recent Bloomberg article entitled “Walmart’s Out-of-Control Crime Problem Is Driving Police Crazy“…

The call log on the store stretches 126 pages, documenting more than 5,000 trips over the past five years. Last year police were called to the store and three other Tulsa Walmarts just under 2,000 times. By comparison, they were called to the city’s four Target stores about 300 times. Most of the calls to the northeast Supercenter were for shoplifting, but there’s no shortage of more serious crimes, including five armed robberies so far this year, a murder suspect who killed himself with a gunshot to the head in the parking lot last year, and, in 2014, a group of men who got into a parking lot shootout that killed one and seriously injured two others.

Police reports from dozens of stores suggest the number of petty crimes committed on Walmart properties nationwide this year will be in the hundreds of thousands.

Did you catch that?

This Bloomberg report says that there will be “hundreds of thousands” of crimes just committed at Wal-Mart stores alone this year.

If people are behaving like this while times are still relatively stable and relatively good, what would things look like during a real crisis?

Many people openly wonder what happened to Detroit, but it really isn’t much of a mystery at all.

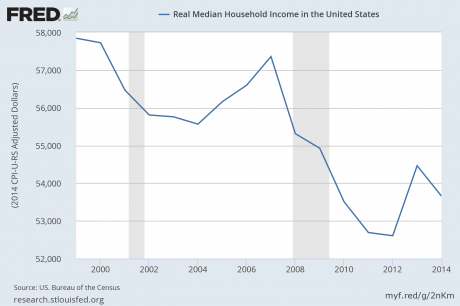
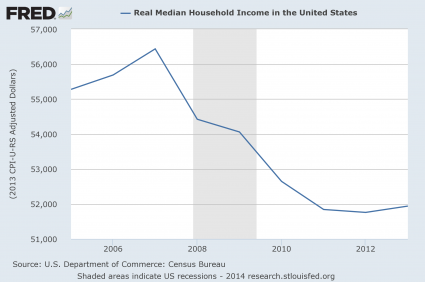
Over the decades, our politicians have stood idly by as tens of thousands of businesses and millions of good paying jobs have left the country.  Our economic infrastructure has been absolutely gutted, and as a result formerly great manufacturing cities have become rotting, decaying hellholes.

And it certainly doesn’t help that voters in many of these cities have willingly chosen to put radical leftists into power time after time.

Unfortunately, it appears that the nation as a whole is about to hand the keys to the White House to a radical leftist that has a violent temper that is absolutely legendary.  If she gets into power, that might just be the final nail in our coffin.

What has already happened to Detroit is slowly happening to the entire country, but we never seem to learn from our past mistakes.

So now we will suffer the consequences for our very foolish decisions, and it will not be pretty.

The Triumph Of Materialism: The Average American Will Spend 830 Dollars On Christmas In 2015

Christmas Gift - Public DomainHas there ever been a major holiday more focused on materialism than the modern American Christmas?  This year, Americans are planning to spend an average of 830 dollars on Christmas gifts, which represents a jump of 110 dollars over the average of 720 dollars last year.  But have our incomes gone up accordingly?  Of course not.  In fact, real median household income in the United States has been experiencing a steady long-term decline.  So in order to fund all of our Christmas spending, we have got to go into even more debt.  We love to pull out our credit cards and spend money that we do not have on lots of cheap, useless stuff made on the other side of the world by workers making slave labor wages.  We do the same thing year after year, and most of us have grown accustomed to the endless cycle of growing debt.  In fact, one Pew survey found that approximately 70 percent of all Americans believe that “debt is a necessity in their lives”.  But then we have to work our fingers to the bone to try to make the payments on all of that debt, not realizing that debt systematically impoverishes us.  It may be hard to believe, but if you have a single dollar in your pocket and no debt, you have a greater net worth than 25 percent of all Americans.  I know that sounds crazy, but it is true.

Overall, when you add up all forms of debt (consumer, business, local government, state government and federal government), Americans are more than 60 trillion dollars in debt.

Let that sink in for a bit.

40 years ago, that number was sitting at about 3 trillion dollars.

We have been on the greatest debt binge in the history of the world.  Even though we were “the wealthiest, most prosperous nation on the entire planet”, we always had to have more.  We just kept on borrowing and borrowing and borrowing from the future until we completely destroyed it.

And we still haven’t learned anything.  Instead, this Christmas season we will be partying like it’s 2007

Americans are planning on celebrating Christmas like it’s 2007.

A November survey by Gallup found that US adults are planning on spending about $830 on average on Christmas gifts this year.

That’s a huge jump from last year’s $720 average.

Notably, American consumers haven’t suggested a number that high since November 2007, when they were planning on spending $866 on average.

Sadly, our incomes simply do not justify this kind of extravagance.  As Zero Hedge has pointed out, household incomes “actually peaked at least 15 years ago in 81% of U.S. counties.”

So why can’t we adjust our lifestyles to match?

Why must we always have more?

Here are more details on our declining incomes from the Visual Capitalist

  • Income peaked one year ago for many of the counties that are a part of the shale boom. This includes much of North and South Dakota, as well as parts of Texas, Nebraska, and Oklahoma. Income in Washington, D.C. and neighboring Arlington County also peaked then.
  • In 1999, a total of 1,623 counties had their households reach peak income. The majority of these counties are in the Midwest and Southeast.
  • The most southern part of California and parts of New England both peaked around 25 years ago.
  • Many states along the Rocky Mountains such as Wyoming and Montana had counties that peaked roughly 35 years ago.
  • Household income peaked in upstate New York, the northern tip of California, and southern Nevada at the same time that humans were first landing on the moon in 1969.

But you won’t hear this reported on the mainstream news, will you?

They want us to think that happy days are here again.

The following chart comes from the Federal Reserve, and it shows that real median household income in the United States has been trending down since 1999…

Real Median Household Income - Federal Reserve

Americans should be having smaller Christmases instead of bigger ones, but that doesn’t fit the image of who we still think that we are.

Recently, I published an article entitled “Goodbye Middle Class: 51 Percent Of All American Workers Make Less Than 30,000 Dollars A Year” that was shared more than 44,000 times on Facebook.  In that article, I included brand new figures that were just released by the Social Security Administration.  As you can see, the quality of our jobs is not great…

-38 percent of all American workers made less than $20,000 last year.

-51 percent of all American workers made less than $30,000 last year.

-62 percent of all American workers made less than $40,000 last year.

-71 percent of all American workers made less than $50,000 last year.

Without a doubt, most American families should not be spending hundreds of dollars a year on Christmas gifts.

At these income levels, most American families are just barely surviving.

But once again this year, millions upon millions of Americans will flock to the malls and big box stores in a desperate attempt to make themselves happy.

Sadly, those efforts will be in vain.  In fact, in a previous article I highlighted the fact that Christmas is the unhappiest season of the year.  The suicide rate spikes to the highest level of the year during “the holidays”, and 45 percent of all Americans report that they dread the Christmas season.  The following is an excerpt from a Psychology Today article

We are told that Christmas, for Christians, should be the happiest time of year, an opportunity to be joyful and grateful with family, friends and colleagues. Yet, according to the National Institute of Health, Christmas is the time of year that people experience the highest incidence of depression. Hospitals and police forces report the highest incidences of suicide and attempted suicide. Psychiatrists, psychologists and other mental health professionals report a significant increase in patients complaining about depression. One North American survey reported that 45% of respondents dreaded the festive season.

In recent years, an increasing number of Americans have given up the tradition of Christmas gifts entirely, and many of them that I know seem quite happy to have done so.

Of course most people are still quite satisfied with the status quo, and there are many that will get very angry with you if you dare to suggest that the way that Americans celebrate Christmas has gotten way out of hand.

But shouldn’t it alarm us that for most Americans the biggest holiday of the year is all about the “stuff” they are going to buy, the “stuff” they are going to give and the “stuff” they are going to get?

As a society, we are obsessed with things, but those things are never going to make us happy.

Perhaps we should all take some time to reflect on the traditions that we choose to participate in and what they really mean to us during this “holiday season”…

Guess How Much Americans Plan To Spend On Christmas And Halloween This Year…

Credit Card - Public DomainIt is that magical time of the year for retailers.  The period between mid-October and late December can often make the difference between success or failure in the retail industry, and this year will be no exception.  As you will see below, it is being projected that Americans will spend a massive amount of money this holiday season.  In fact, what Americans plan to spend on Christmas this year is greater than the yearly GDP of the entire nation of Sweden.  So isn’t this good economic news?  Shouldn’t we be happy that Americans are opening up their wallets so eagerly?  Well, it depends how you look at it.  Even though our spending is increasing, our incomes are not.  As I discussed the other day, 50 percent of American workers make less than 28,031 dollars a year and incomes have been stagnant for years.  That means that any increases in spending must be funded by more debt, and that is not good news at all.

In 2014, approximately 70 percent of all Americans will participate in Halloween.  It seems like with each passing year this dark holiday become even more popular, and before it is all said and done it is being projected that Americans will spend a whopping 7.4 billion dollars this time around…

Kicking off the end of year spending season is Halloween. Just how much do Americans spend on trick-or-treating and other Halloween festivities? The National Retail Federation (NRF) forecasts total Halloween spending—including candy, costumes, and decorations—to come in at $7.4 billion this year.

That 7.4 billion dollars includes 2 billion dollars for Halloween candy and 350 million dollars for pet Halloween costumes.

Yes, you read that correctly.  We are collectively going to spend 350 million dollars on Halloween costumes for our cats and dogs.

Overall, spending on Halloween has risen by more than 55 percent since 2005.  It just seems like Americans can’t get enough of this particular holiday.

But of course what Americans spend on Halloween is not even worth comparing to what Americans spend on Christmas.

According to the National Retail Federation, more than 90 percent of Americans celebrate either Christmas, Kwanza or Hanukkah.

And Christmas in particular has become virtually synonymous with materialism.  This year, the National Retail Federation is projecting that Americans will spend more than 600 billion dollars just on Christmas.

That represents a huge chunk of our GDP as a nation.

Most of that money will be spent on Christmas gifts.  According to a Gallup survey that was just released, the average U.S. adult plans to spend 781 dollars on Christmas gifts this year, which is significantly up from last year…

Americans’ initial estimates of the total amount they will spend on Christmas gifts this year point to an above-average holiday season for the nation’s retailers. While Gallup’s October spending forecast is a warm-up to its key measure in November, it finds Americans expecting to spend $781, on average, up from $704 last November.

Of course holiday spending does not end there.  There are trees to put up, packages to send out and decorations to buy.  The following numbers are from a Forbes article about what an average American typically spends during a Christmas season…

Christmas Tree: $41.50

Cards And Postage: $32.43

Floral Arrangements: $22.61

Food And Candy: $95.04

Decorations: $51.43

Travel: $960.50

So where is all of this money coming from?

That is a key question.

If our incomes were going up, all of this spending might be good news.  But as the following chart from the Federal Reserve demonstrates, that is not the case…

Median Household Income Since 2005

Our incomes are stagnant at best.  But Americans always like to party as if it were the best of times.  So they will pull out their credit cards and spend what they feel they need to spend in order to feel happy once again this year.

But deep down most people realize that this debt-fueled party cannot last forever.

Deep down most people realize that we have some incredibly serious long-term problems that need to be fixed.

Sadly, no matter which political party occupies the White House, and no matter which political party controls Congress, our long-term problems only seem to get even worse.

As our problems have multiplied, over time Americans have become angrier and angrier.

And right now is election season, and so that is very bad news for Democrats

Nearly 7 in 10 Americans are angry at the direction the country is headed and 53% of Americans disapprove of President Barack Obama’s job performance, two troubling signs for Democrats one week before the midterm elections, a new CNN/ORC International Poll shows.

Democrats are battling to try and save the Senate majority, while hoping to prevent more losses in the House, which the GOP controls by a 234 to 201 margin.

In the Senate, Republicans need a net gain of six seats, and several state polls in the past month of contested races show that Democrats are in danger of losing control of the majority, and thus Congress.

If the Republicans do take control of both houses of Congress, will that fundamentally change the direction of the country?

I wish that I could believe that, but at this point most Republicans are virtually indistinguishable from most Democrats.

In other words, it is very hard to tell them apart.

As a nation, we are steamrolling toward a date with oblivion, but everyone is trying to put such a happy face on things.

Well, enjoy this time of relative stability while you can, because it is going to end way too soon.

15 Reasons Why Your Food Bill Is Going To Start SOARING

U.S. Drought Monitor California February 11 2014Did you know that the U.S. state that produces the most vegetables is going through the worst drought it has ever experienced and that the size of the total U.S. cattle herd is now the smallest that it has been since 1951?  Just the other day, a CBS News article boldly declared that “food prices soar as incomes stand still“, but the truth is that this is only just the beginning.  If the drought that has been devastating farmers and ranchers out west continues, we are going to see prices for meat, fruits and vegetables soar into the stratosphere.  Already, the federal government has declared portions of 11 states to be “disaster areas”, and California farmers are going to leave half a million acres sitting idle this year because of the extremely dry conditions.  Sadly, experts are telling us that things are probably going to get worse before they get better (if they ever do).  As you will read about below, one expert recently told National Geographic that throughout history it has been quite common for that region of North America to experience severe droughts that last for decades.  In fact, one drought actually lasted for about 200 years.  So there is the possibility that the drought that has begun in the state of California may not end during your entire lifetime.

This drought has gotten so bad that it is starting to get national attention.  Barack Obama visited the Fresno region on Friday, and he declared that “this is going to be a very challenging situation this year, and frankly, the trend lines are such where it’s going to be a challenging situation for some time to come.”

According to NBC News, businesses across the region are shutting down, large numbers of workers are leaving to search for other work, and things are already so bad that it “calls to mind the Dust Bowl of the 1930s“…

In the state’s Central Valley — where nearly 40 percent of all jobs are tied to agriculture production and related processing — the pain has already trickled down. Businesses across a wide swath of the region have shuttered, casting countless workers adrift in a downturn that calls to mind the Dust Bowl of the 1930s.

If you will recall, there have been warnings that Dust Bowl conditions were going to return to the western half of the country for quite some time.

Now the mainstream media is finally starting to catch up.

And of course these extremely dry conditions are going to severely affect food prices.  The following are 15 reasons why your food bill is going to start soaring…

#1 2013 was the driest year on record for the state of California, and 2014 has been exceptionally dry so far as well.

#2 According to the U.S. Drought Monitor, 91.6 percent of the entire state of California is experiencing “severe to exceptional drought” even as you read this article.

#3 According to CNBC, it is being projected that California farmers are going to let half a million acres of farmland sit idle this year because of the crippling drought.

#4 Celeste Cantu, the general manager for the Santa Ana Watershed Project Authority, says that this drought could have a “cataclysmic” impact on food prices…

Given that California is one of the largest agricultural regions in the world, the effects of any drought, never mind one that could last for centuries, are huge. About 80 percent of California’s freshwater supply is used for agriculture. The cost of fruits and vegetables could soar, says Cantu. “There will be cataclysmic impacts.”

#5 Mike Wade, the executive director of the California Farm Water Coalition, recently explained which crops he believes will be hit the hardest…

Hardest hit would be such annual row crops as tomatoes, broccoli, lettuce, cantaloupes, garlic, peppers and corn. Wade said consumers can also expect higher prices and reduced selection at grocery stores, particularly for products such as almonds, raisins, walnuts and olives.

#6 As I discussed in a previous article, the rest of the nation is extremely dependent on the fruits and vegetables grown in California.  Just consider the following statistics regarding what percentage of our produce is grown in the state…

99 percent of the artichokes

44 percent of asparagus

two-thirds of carrots

half of bell peppers

89 percent of cauliflower

94 percent of broccoli

95 percent of celery

90 percent of the leaf lettuce

83 percent of Romaine lettuce

83 percent of fresh spinach

a third of the fresh tomatoes

86 percent of lemons

90 percent of avocados

84 percent of peaches

88 percent of fresh strawberries

97 percent of fresh plums

#7 Of course it isn’t just agriculture which will be affected by this drought.  Just consider this chilling statement by Tim Quinn, the executive director of the Association of California Water Agencies…

“There are places in California that if we don’t do something about it, tens of thousands of people could turn on their water faucets and nothing would come out.”

#8 The Sierra Nevada snowpack is only about 15 percent of what it normally is.  As the New York Times recently explained, this is going to be absolutely devastating for Californians when the warmer months arrive…

Experts offer dire warnings. The current drought has already eclipsed previous water crises, like the one in 1977, which a meteorologist friend, translating into language we understand as historians, likened to the “Great Depression” of droughts. Most Californians depend on the Sierra Nevada for their water supply, but the snowpack there was just 15 percent of normal in early February.

#9 The underground aquifers that so many California farmers depend upon are being drained at a staggering rate

Pumping from aquifers is so intense that the ground in parts of the valley is sinking about a foot a year. Once aquifers compress, they can never fill with water again. It’s no surprise Tom Willey wakes every morning with a lump in his throat. When we ask which farmers will survive the summer, he responds quite simply: those who dig the deepest and pump the hardest.

#10 According to an expert interviewed by National Geographic, the current drought in the state of California could potentially last for 200 years or more as some mega-droughts in the region have done in the past…

California is experiencing its worst drought since record-keeping began in the mid 19th century, and scientists say this may be just the beginning. B. Lynn Ingram, a paleoclimatologist at the University of California at Berkeley, thinks that California needs to brace itself for a megadrought—one that could last for 200 years or more.

#11 Much of the western U.S. has been exceedingly dry for an extended period of time, and this is hurting huge numbers of farmers and ranchers all the way from Texas to the west coast…

“Ranchers in the West are selling off their livestock,” Patzert said. “Farmers all over the Southwest, from Texas to Oregon, are fallowing in their fields because of a lack of water. For farmers and ranchers, this is a painful drought.”

#12 The size of the U.S. cattle herd has been shrinking for seven years in a row, and it is now the smallest that it has been since 1951.  But our population has more than doubled since then.

#13 Extremely unusual weather patterns are playing havoc with crops all over the planet right now.  The following is an excerpt from a recent article by Lizzie Bennett

Peru, Venezuela, and Bolivia have experienced rainfall heavy enough to flood fields and rot crops where they stand. Volcanic eruptions in Ecuador are also creating problems due to cattle ingesting ash with their feed leading to a slow and painful death.

Parts of Australia have been in drought for years affecting cattle and agricultural production.

Rice production in China has been affected by record low temperatures.

Large parts of the UK are underwater, and much of that water is sea water which is poisoning the soil. So wet is the UK that groundwater is so high it is actually coming out of the ground and adding to the water from rivers and the sea. With the official assessment being that groundwater flooding will continue until MAY, and that’s if it doesn’t rain again between now and then. The River Thames is 65 feet higher than normal in some areas, flooding town after town as it heads to the sea.

#14 As food prices rise, our incomes are staying about the same.  The following is from a CBS News article entitled “Food prices soar as incomes stand still“…

While the government says prices are up 6.4 percent since 2011, chicken is up 18.4 percent, ground beef is up 16.8 percent and bacon has skyrocketed up 22.8 percent, making it a holiday when it’s on sale.

#15 As I have written about previously, median household income has fallen for five years in a row.  So average Americans are going to have to make their food budgets stretch more than they ever have before as this drought drags on.

If the drought does continue to get worse, small agricultural towns all over California are going to die off.

For instance, consider what is already happening to the little town of Mendota

The farms in and around Mendota are dying of thirst. The signs are everywhere. Orchards with trees lying on their sides, as if shot. Former farm fields given over to tumbleweeds. Land and cattle for sale, cheap.

Large numbers of agricultural workers continue to hang on, hoping that somehow there will be enough work for them.  But as Evelyn Nieves recently observed, panic is starting to set in…

Off-season, by mid-February, idled workers are clearly anxious. Farmworkers and everyone else who waits out the winter for work (truckers, diesel providers, packing suppliers and the like) are nearing the end of the savings they squirrel away during the season. The season starts again in March, April at the latest, but no one knows who will get work when the season begins, or how much.

People are scared, panicked even.

I did not write this article so that you would panic.

Yes, incredibly hard times are coming.  If you will recall, the 1930s were also a time when the United States experienced extraordinarily dry weather conditions and a tremendous amount of financial turmoil.  We could very well be entering a similar time period.

Worrying about this drought is not going to change anything.  Instead of worrying, we should all be doing what we can to store some things up while food is still relatively cheap.  Our grandparents and our great-grandparents that lived during the days of the Great Depression knew the wisdom of having a well-stocked food pantry, and it would be wise to follow their examples.

Please share this article with as many people as you can.  The United States has never faced anything like this during most of our lifetimes.  We need to shake people out of their “normalcy bias” and get them to understand that big changes are coming.

U.S. Drought Monitor California February 11 2014

28 Signs That The Middle Class Is Heading Toward Extinction

Dilapidated House In IndianaThe death of the middle class in America has become so painfully obvious that now even the New York Times is doing stories about it.  Millions of middle class jobs have disappeared, incomes are steadily decreasing, the rate of homeownership has declined for eight years in a row and U.S. consumers have accumulated record-setting levels of debt.  Being independent is at the heart of what it means to be “middle class”, and unfortunately the percentage of Americans that are able to take care of themselves without government assistance continues to decline.  In fact, the percentage of Americans that are receiving government assistance is now at an all-time record high.  This is not a good thing.  Sadly, the number of people on food stamps has increased by nearly 50 percent while Barack Obama has been in the White House, and at this point nearly half the entire country gets money from the government each month.  Anyone that tries to tell you that the middle class is going to be “okay” simply has no idea what they are talking about.  The following are 28 signs that the middle class is heading toward extinction…

#1 You don’t have to ask major U.S. corporations if the middle class is dying.  This fact is showing up plain as day in their sales numbers.  The following is from a recent New York Times article entitled “The Middle Class Is Steadily Eroding. Just Ask the Business World“…

In Manhattan, the upscale clothing retailer Barneys will replace the bankrupt discounter Loehmann’s, whose Chelsea store closes in a few weeks. Across the country, Olive Garden and Red Lobster restaurants are struggling, while fine-dining chains like Capital Grille are thriving. And at General Electric, the increase in demand for high-end dishwashers and refrigerators dwarfs sales growth of mass-market models.

As politicians and pundits in Washington continue to spar over whether economic inequality is in fact deepening, in corporate America there really is no debate at all. The post-recession reality is that the customer base for businesses that appeal to the middle class is shrinking as the top tier pulls even further away.

#2 Some of the largest retailers in the United States that once thrived by serving the middle class are now steadily dying.  Sears and J.C. Penney are both on the verge of bankruptcy, and now we have learned that Radio Shack may be shutting down another 500 stores this year.

#3 Real disposable income in the United States just experienced the largest year over year drop that we have seen since 1974.

#4 Median household income in the United States has fallen for five years in a row.

#5 The rate of homeownership in the United States has fallen for eight years in a row.

#6 In 2008, 53 percent of all Americans considered themselves to be “middle class”.  In 2014, only 44 percent of all Americans consider themselves to be “middle class”.

#7 In 2008, 25 percent of all Americans in the 18 to 29-year-old age bracket considered themselves to be “lower class”.  In 2014, an astounding 49 percent of them do.

#8 Incredibly, 56 percent of all Americans now have “subprime credit”.

#9 Total consumer credit has risen by a whopping 22 percent over the past three years.

#10 The average credit card debt in the United States is $15,279.

#11 The average student loan debt in the United States is $32,250.

#12 The average mortgage debt in the United States is $149,925.

#13 Overall, U.S. consumers are $11,360,000,000,000 in debt.

#14 The U.S. national debt is currently sitting at $17,263,040,455,036.20, and it is being reported that is has grown by $6.666 trillion during the Obama years so far.  Most of the burden of servicing that debt is going to fall on the middle class (if the middle class is able to survive that long).

#15 According to the Congressional Budget Office, interest payments on the national debt will nearly quadruple over the next ten years.

#16 Back in 1999, 64.1 percent of all Americans were covered by employment-based health insurance.  Today, only 54.9 percent of all Americans are covered by employment-based health insurance.

#17 More Americans than ever find themselves forced to turn to the government for help with health care.  At this point, 82.4 million Americans live in a home where at least one person is enrolled in the Medicaid program.

#18 There are 46.5 million Americans that are living in poverty, and the poverty rate in America has been at 15 percent or above for 3 consecutive years.  That is the first time that has happened since 1965.

#19 While Barack Obama has been in the White House, the number of Americans on food stamps has gone from 32 million to 47 million.

#20 While Barack Obama has been in the White House, the percentage of working age Americans that are actually working has declined from 60.6 percent to 58.6 percent.

#21 While Barack Obama has been in the White House, the average duration of unemployment in the United States has risen from 19.8 weeks to 37.1 weeks.

#22 Middle-wage jobs accounted for 60 percent of the jobs lost during the last recession, but they have accounted for only 22 percent of the jobs created since then.

#23 It is hard to believe, but an astounding 53 percent of all American workers make less than $30,000 a year in wages.

#24 Approximately one out of every four part-time workers in America is living below the poverty line.

#25 According to the most recent numbers from the U.S. Census Bureau, an all-time record 49.2 percent of all Americans are receiving benefits from at least one government program each month.

#26 The U.S. government has spent an astounding 3.7 trillion dollars on welfare programs over the past five years.

#27 Only 35 percent of all Americans say that they are better off financially than they were a year ago.

#28 Only 19 percent of all Americans believe that the job market is better than it was a year ago.

As if the middle class didn’t have enough to deal with, now here comes Obamacare.

As I have written about previously, Obamacare is going to mean higher taxes and much higher health insurance premiums for middle class Americans.

Not only that, but millions of hard working Americans are going to end up losing their jobs or having their hours cut back thanks to Obamacare.  For example, a fry cook named Darnell Summers recently told Barack Obama directly that he and his fellow workers “were broken down to part time to avoid paying health insurance“…

And the Congressional Budget Office now says that Obamacare could result in the loss of 2.3 million full-time jobs by 2021.

Several million people will reduce their hours on the job or leave the workforce entirely because of incentives built into President Barack Obama’s health care overhaul, the Congressional Budget Office said Tuesday.

That would mean job losses equal to 2.3 million full-time jobs by 2021, in large part because people would opt to keep their income low to stay eligible for federal health care subsidies or Medicaid, the agency said. It had estimated previously that the law would lead to 800,000 fewer jobs by that year.

But even if we got rid of Obamacare tomorrow that would not solve the problems of the middle class.

The middle class has been shrinking for a very long time, and something dramatic desperately needs to be done.

The numbers that I shared above simply cannot convey the level of suffering that is going on out there on the streets of America today.  That is why I also like to share personal stories when I can.  Below, I have posted an excerpt from an open letter to Barack Obama that a woman with a Master’s degree and 30 years of work experience recently submitted to the Huffington Post.  What this formerly middle class lady is having to endure because of this horrible economy is absolutely tragic…

Dear Mr. President,

I write to you today because I have nowhere else to turn. I lost my full time job in September 2012. I have only been able to find part-time employment — 16 hours each week at $12 per hour — but I don’t work that every week. For the month of December, my net pay was $365. My husband and I now live in an RV at a campground because of my job loss. Our monthly rent is $455 and that doesn’t include utilities. We were given this 27-ft. 1983 RV when I lost my job.

This is America today. We have no running water; we use a hose to fill jugs. We have no shower but the campground does. We have a toilet but it only works when the sewer line doesn’t freeze — if it freezes, we use the campground’s restrooms. At night, in my bed, when it’s cold out, my blanket can freeze to the wall of the RV. We don’t have a stove or an oven, just a microwave, so regular-food cooking is out. Recently we found a small toaster oven on sale so we can bake a little now because eating only microwaved food just wasn’t working for us. We don’t have a refrigerator, just an icebox (a block of ice cost about $1.89). It keeps things relatively cold. If it’s freezing outside, we just put things on the picnic table.

You can read the rest of her incredibly heartbreaking letter right here.

This is not the America that I remember.

What in the world is happening to us?

30 Statistics About Americans Under The Age Of 30 That Will Blow Your Mind

Young People - Photo by Jefferson liffeyWhy are young people in America so frustrated these days?  You are about to find out.  Most young adults started out having faith in the system.  They worked hard, they got good grades, they stayed out of trouble and many of them went on to college.  But when their educations where over, they discovered that the good jobs that they had been promised were not waiting for them at the end of the rainbow.  Even in the midst of this so-called “economic recovery”, the full-time employment rate for Americans under the age of 30 continues to fall.  And incomes for that age group continue to fall as well.  At the same time, young adults are dealing with record levels of student loan debt.  As a result, more young Americans than ever are putting off getting married and having families, and more of them than ever are moving back in with their parents.

It can be absolutely soul crushing when you discover that the “bright future” that the system had been promising you for so many years turns out to be a lie.  A lot of young people ultimately give up on the system and many of them end up just kind of drifting aimlessly through life.  The following is an example from a recent Wall Street Journal article

James Roy, 26, has spent the past six years paying off $14,000 in student loans for two years of college by skating from job to job. Now working as a supervisor for a coffee shop in the Chicago suburb of St. Charles, Ill., Mr. Roy describes his outlook as “kind of grim.”

“It seems to me that if you went to college and took on student debt, there used to be greater assurance that you could pay it off with a good job,” said the Colorado native, who majored in English before dropping out. “But now, for people living in this economy and in our age group, it’s a rough deal.”

Young adults as a group have been experiencing a tremendous amount of economic pain in recent years.  The following are 30 statistics about Americans under the age of 30 that will blow your mind…

#1 The labor force participation rate for men in the 18 to 24 year old age bracket is at an all-time low.

#2 The ratio of what men in the 18 to 29 year old age bracket are earning compared to the general population is at an all-time low.

#3 Only about a third of all adults in their early 20s are working a full-time job.

#4 For the entire 18 to 29 year old age bracket, the full-time employment rate continues to fall.  In June 2012, 47 percent of that entire age group had a full-time job.  One year later, in June 2013, only 43.6 percent of that entire age group had a full-time job.

#5 Back in the year 2000, 80 percent of men in their late 20s had a full-time job.  Today, only 65 percent do.

#6 In 2007, the unemployment rate for the 20 to 29 year old age bracket was about 6.5 percent.  Today, the unemployment rate for that same age group is about 13 percent.

#7 American families that have a head of household that is under the age of 30 have a poverty rate of 37 percent.

#8 During 2012, young adults under the age of 30 accounted for 23 percent of the workforce, but they accounted for a whopping 36 percent of the unemployed.

#9 During 2011, 53 percent of all Americans with a bachelor’s degree under the age of 25 were either unemployed or underemployed.

#10 At this point about half of all recent college graduates are working jobs that do not even require a college degree.

#11 The number of Americans in the 16 to 29 year old age bracket with a job declined by 18 percent between 2000 and 2010.

#12 According to one survey, 82 percent of all Americans believe that it is harder for young adults to find jobs today than it was for their parents to find jobs.

#13 Incomes for U.S. households led by someone between the ages of 25 and 34 have fallen by about 12 percent after you adjust for inflation since the year 2000.

#14 In 1984, the median net worth of households led by someone 65 or older was 10 times larger than the median net worth of households led by someone 35 or younger.  Today, the median net worth of households led by someone 65 or older is 47 times larger than the median net worth of households led by someone 35 or younger.

#15 In 2011, SAT scores for young men were the worst that they had been in 40 years.

#16 Incredibly, approximately two-thirds of all college students graduate with student loans.

#17 According to the Federal Reserve, the total amount of student loan debt has risen by 275 percent since 2003.

#18 In America today, 40 percent of all households that are led by someone under the age of 35 are paying off student loan debt.  Back in 1989, that figure was below 20 percent.

#19 The total amount of student loan debt in the United States now exceeds the total amount of credit card debt in the United States.

#20 According to the U.S. Department of Education, 11 percent of all student loans are at least 90 days delinquent.

#21 The student loan default rate in the United States has nearly doubled since 2005.

#22 One survey found that 70% of all college graduates wish that they had spent more time preparing for the “real world” while they were still in college.

#23 In the United States today, there are more than 100,000 janitors that have college degrees.

#24 In the United States today, 317,000 waiters and waitresses have college degrees.

#25 Today, an all-time low 44.2 percent of all Americans between the ages of 25 and 34 are married.

#26 According to the Pew Research Center, 57 percent of all Americans in the 18 to 24 year old age bracket lived with their parents during 2012.

#27 One poll discovered that 29 percent of all Americans in the 25 to 34 year old age bracket are still living with their parents.

#28 Young men are nearly twice as likely to live with their parents as young women the same age are.

#29 Overall, approximately 25 million American adults are living with their parents according to Time Magazine.

#30 Young Americans are becoming increasingly frustrated that previous generations have saddled them with a nearly 17 trillion dollar national debt that they are expected to make payments on for the rest of their lives.

And this trend is not just limited to the United States.  As I have written about frequently, unemployment rates for young adults throughout Europe have been soaring to unprecedented heights.  For example, the unemployment rate for those under the age of 25 in Italy has now reached 40.1 percent.

Simon Black of the Sovereign Man blog discussed this global trend in a recent article on his website…

Youth unemployment rates in these countries are upwards of 40% to nearly 70%. The most recent figures published by the Italian government show yet another record high in youth unemployment.

An entire generation is now coming of age without being able to leave the nest or have any prospect of earning a decent wage in their home country.

This underscores an important point that I’ve been writing about for a long time: young people in particular get the sharp end of the stick.

They’re the last to be hired, the first to be fired, the first to be sent off to fight and die in foreign lands, and the first to have their benefits cut.

And if they’re ever lucky enough to find meaningful employment, they can count on working their entire lives to pay down the debts of previous generations through higher and higher taxes.

But when it comes time to collect… finally… those benefits won’t be there for them.

Meanwhile, the overall economy continues to get even weaker.

In the United States, Gallup’s daily economic confidence index is now the lowest that it has been in more than a year.

For young people that are in high school or college right now, the future does not look bright.  In fact, this is probably as good as the U.S. economy is going to get.  It is probably only going to be downhill from here.

The system is failing, and young people are going to become even angrier and even more frustrated.

So what will that mean for our future?

Please feel free to share what you think by posting a comment below…

Median Household Income Has Fallen For FIVE YEARS IN A ROW

Five - Photo by woodley wonderworksIf the economy is getting better, then why do incomes keep falling?  According to a shocking new report that was just released by the U.S. Census Bureau, median household income (adjusted for inflation) has declined for five years in a row.  This has happened even though the federal government has been borrowing and spending money at an unprecedented rate and the Federal Reserve has been on the most reckless money printing spree in U.S. history.  Despite all of the “emergency measures” that have been taken to “stimulate the economy”, things just continue to get worse for average American families.  Americans are working harder than ever, but their paychecks are not reflecting that.  Meanwhile, the cost of everything just keeps going up.  The Federal Reserve insists that inflation is “low”, but anyone that goes grocery shopping or that stops at a gas station knows that is a lie.  In fact, if inflation was calculated the exact same way that it was calculated back in 1980, the inflation rate would be somewhere between 8 and 10 percent right now.  Paychecks are being stretched more than ever before, and that is probably the reason why about three-fourths of the entire country is living paycheck to paycheck at this point.

According to the Census report, the high point for median household income in the United States was back in 1999 ($56,080).  It almost got back to that level in 2007 ($55,627), but ever since then there has been a steady decline.  The following figures come directly from the report, and as you can see, median household income has fallen every single year for the past five years…

2007: $55,627

2008: $53,644

2009: $53,285

2010: $51,892

2011: $51,100

2012: $51,017

How far does that number have to go down before we admit that we have a major problem on our hands?

The new Census report also revealed that 46.5 million Americans are living in poverty.  As CNSNews.com noted, this is far higher than when Barack Obama first entered the White House…

During the four years that marked President Barack Obama’s first term in office, the real median income of American households dropped by $2,627 and the number of people on poverty increased by approximately 6,667,000, according to data released today by the Census Bureau.

So why does Obama continue to insist that things are getting better?

Right now, one out of every five households in the United States is on food stamps.

One out of every five.

How bad does it have to get before we acknowledge that what we are doing economically is not working.

Will half of us eventually end up on food stamps?

In addition, the new Census report also says that 48 million Americans are currently without any kind of health insurance whatsoever.

The biggest culprit for this is the stunning decline of employment-based health insurance.  Back in 1999, 64.1 percent of all Americans were covered by employment-based health insurance.  Today, only 54.9 percent are covered by employment-based health insurance.

And of course as I noted yesterday, even more companies are going to be dumping health insurance plans because of Obamacare.

All in all, what we have been witnessing over the past decade and a half is the systematic evisceration of the middle class.

After accounting for inflation, right now 40 percent of all U.S. workers are making less than what a full-time minimum wage worker made back in 1968.

Over the years, our incomes have certainly gone up, but inflation has increased even faster.

Back when I was growing up, $50,000 a year sounded like a whole lot of money.  I thought that anyone should be able to live a very comfortable lifestyle on that amount of money.

Unfortunately, $50,000 a year doesn’t go nearly as far as it once did.

If you take the current median household income ($51,017) and divide it up by 12 months, it comes to just a little bit more than $4000 a month.

And as I noted last year, it is not easy for the average American family to do everything that it needs to do on $4000 a month…

So can an average family of four people make it on just $4000 a month?

Well, first of all you have got to take out taxes.  After accounting for all forms of taxation you will be lucky if you have $3000 remaining.

With that $3000, you have to pay for all of the following…

*Housing

*Power

*Water

*Food

*Phone

*Internet

*At Least One Vehicle

*Gasoline

*Vehicle Repairs

*Car Insurance

*Health Insurance

*Dental Bills

*Home Or Rental Insurance

*Life Insurance

*Student Loan Debt Payments

*Credit Card Payments

*Furniture

*Clothing

*Pets

*Entertainment (although it is hard to imagine any money will be left for that)

Have I left anything out?

The truth is that $3000 does not go as far as it used to.

No wonder American families are feeling so stretched financially these days.

The new Census report also noted that the gap between the wealthiest Americans and the rest of us continues to grow.  There is certainly nothing wrong with making money, but if the economy was working properly all Americans should be able to have the opportunity to better themselves.

According to CNBC, the 400 wealthiest Americans now have more money than the poorest 50 percent of all Americans combined.

So why is this happening?  Well, certainly there are a lot of reasons, but in recent years quantitative easing has definitely played a role.  As I noted in my recent article about the Federal Reserve, quantitative easing has been incredibly good for those with stocks and other forms of financial investments.  All of that liquidity has juiced the financial markets, and the extremely wealthy have been loving it.

Meanwhile, things just continue to get even tougher for most of the rest of the American people, and the frightening thing is that the next major wave of the economic collapse has not even hit us yet.

How bad will things be for average American families once that happens?

And there are certainly lots of troubling signs as we get ready to head into the fall season…

-Total mortgage activity has dropped to the lowest level that we have seen since October 2008.

-One of the largest furniture manufacturers in America was just forced into bankruptcy.

-According to the Wall Street Journal, the 2013 holiday shopping season is already being projected to be the worst that we have seen since 2009.

Hopefully the slow and steady economic decline that we have been experiencing will not accelerate into a full-blown avalanche any time soon.

But I would definitely get prepared just in case.

44 Facts About The Death Of The Middle Class That Every American Should Know

44What is America going to look like when the middle class is dead?  Once upon a time, the United States has the largest and most vibrant middle class in the history of the world.  When I was growing up, it seemed like almost everyone was “middle class” and it was very rare to hear of someone that was out of work.  Of course life wasn’t perfect, but most families owned a home, most families had more than one vehicle, and most families could afford nice vacations and save for retirement at the same time.  Sadly, things have dramatically changed in America since that time.  There just aren’t as many “middle class jobs” as there used to be.  In fact, just six years ago there were about six million more full-time jobs in our economy than there are right now.  Those jobs are being replaced by part-time jobs and temp jobs.  The number one employer in America today is Wal-Mart and the number two employer in America today is a temp agency (Kelly Services).  But you can’t support a family on those kinds of jobs.  We live at a time when incomes are going down but the cost of living just keeps going up.  As a result, the middle class in America is being absolutely shredded and the ranks of the poor are steadily growing.  The following are 44 facts about the death of the middle class that every American should know…

1. According to one recent survey, “four out of five U.S. adults struggle with joblessness, near poverty or reliance on welfare for at least parts of their lives”.

2. The growth rate of real disposable personal income is the lowest that it has been in decades.

3. Median household income (adjusted for inflation) has fallen by 7.8 percent since the year 2000.

4. According to the U.S. Census Bureau, the middle class is taking home a smaller share of the overall income pie than has ever been recorded before.

5. The home ownership rate in the United States is the lowest that it has been in 18 years.

6. It is more expensive to rent a home in America than ever before.  In fact, median asking rent for vacant rental units just hit a brand new all-time record high.

7. According to one recent survey, 76 percent of all Americans are living paycheck to paycheck.

8. The U.S. economy actually lost 240,000 full-time jobs last month, and the number of full-time workers in the United States is now about 6 million below the old record that was set back in 2007.

9. The largest employer in the United States right now is Wal-Mart.  The second largest employer in the United States right now is a temp agency (Kelly Services).

10. One out of every ten jobs in the United States is now filled through a temp agency.

11. According to the Social Security Administration, 40 percent of all workers in the United States make less than $20,000 a year.

12. The ratio of wages and salaries to GDP is near an all-time record low.

13. The U.S. economy continues to trade good paying jobs for low paying jobs.  60 percent of the jobs lost during the last recession were mid-wage jobs, but 58 percent of the jobs created since then have been low wage jobs.

14. Back in 1980, less than 30% of all jobs in the United States were low income jobs.  Today, more than 40% of all jobs in the United States are low income jobs.

15. At this point, one out of every four American workers has a job that pays $10 an hour or less.

16. According to one study, between 1969 and 2009 the median wages earned by American men between the ages of 30 and 50 declined by 27 percent after you account for inflation.

17. In the year 2000, about 17 million Americans were employed in manufacturing.  Today, only about 12 million Americans are employed in manufacturing.

18. The United States has lost more than 56,000 manufacturing facilities since 2001.

19. The average number of hours worked per employed person per year has fallen by about 100 since the year 2000.

20. Back in the year 2000, more than 64 percent of all working age Americans had a job.  Today, only 58.7 percent of all working age Americans have a job.

21. When you total up all working age Americans that do not have a job, it comes to more than 100 million.

22. The average duration of unemployment in the United States is nearly three times as long as it was back in the year 2000.

23. The percentage of Americans that are self-employed has steadily declined over the past decade and is now at an all-time low.

24. Right now there are 20.2 million Americans that spend more than half of their incomes on housing.  That represents a 46 percent increase from 2001.

25. In 1989, the debt to income ratio of the average American family was about 58 percent.  Today it is up to 154 percent.

26. Total U.S. household debt grew from just 1.4 trillion dollars in 1980 to a whopping 13.7 trillion dollars in 2007.  This played a huge role in the financial crisis of 2008, and the problem still has not been solved.

27. The total amount of student loan debt in the United States recently surpassed the one trillion dollar mark.

28. Total home mortgage debt in the United States is now about 5 times larger than it was just 20 years ago.

29. Back in the year 2000, the mortgage delinquency rate was about 2 percent.  Today, it is nearly 10 percent.

30. Consumer debt in the United States has risen by a whopping 1700% since 1971, and 46% of all Americans carry a credit card balance from month to month.

31. In 1999, 64.1 percent of all Americans were covered by employment-based health insurance.  Today, only 55.1 percent are covered by employment-based health insurance.

32. One study discovered that approximately 41 percent of all working age Americans either have medical bill problems or are currently paying off medical debt, and according to a report published in The American Journal of Medicine medical bills are a major factor in more than 60 percent of all personal bankruptcies in the United States.

33. Each year, the average American must work 107 days just to make enough money to pay local, state and federal taxes.

34. Today, approximately 46.2 million Americans are living in poverty.

35. The number of Americans living in poverty has increased by more than 15 million since the year 2000.

36. Families that have a head of household under the age of 30 have a poverty rate of 37 percent.

37. At this point, approximately 25 million American adults are living with their parents.

38. In the year 2000, there were only 17 million Americans on food stamps.  Today, there are more than 47 million Americans on food stamps.

39. Back in the 1970s, about one out of every 50 Americans was on food stamps.  Today, about one out of every 6.5 Americans is on food stamps.

40. Right now, the number of Americans on food stamps exceeds the entire population of the nation of Spain.

41. According to one calculation, the number of Americans on food stamps now exceeds the combined populations of “Alaska, Arkansas, Connecticut, Delaware, District of Columbia, Hawaii, Idaho, Iowa, Kansas, Maine, Mississippi, Montana, Nebraska, Nevada, New Hampshire, New Mexico, North Dakota, Oklahoma, Oregon, Rhode Island, South Dakota, Utah, Vermont, West Virginia, and Wyoming.”

42. At this point, more than a million public school students in the United States are homeless.  This is the first time that has ever happened in our history.  That number has risen by 57 percent since the 2006-2007 school year.

43. According to U.S. Census data, 57 percent of all American children live in a home that is either considered to be “poor” or “low income”.

44. In the year 2000, the ratio of social welfare benefits to salaries and wages was approximately 21 percent.  Today, the ratio of social welfare benefits to salaries and wages is approximately 35 percent.

And not only is the middle class being systematically destroyed right now, we are also destroying the bright economic future that our children and our grandchildren were supposed to have by accumulating gigantic mountains of debt in their names.  The following is from a recent article by Bill Bonner

Today, the U.S. lumbers into the future with total debt equal to about 350% of GDP. In Britain and Japan, the total is over 500%. Debt, remember, is the homage that the future pays to the past. It has to be carried, serviced… and paid. It has to be reckoned with… one way or another.

And the cost of carrying debt is going up! Over the last few weeks, interest rates have moved up by about 15% — an astounding increase for the sluggish debt market. How long will it be before long-term borrowing rates are back to “normal”?

At 5% interest, a debt that measures 3.5 times your revenue will cost about one-sixth of your income. Before taxes. After tax, you will have to work about one day a week to keep up with it (to say nothing of paying it off!).

That’s a heavy burden. It is especially disagreeable when someone else ran up the debt. Then you are a debt slave. That is the situation of young people today. They must face their parents’ debt. Even serfs in the Dark Ages had it better. They had to work only one day out of 10 for their lords and masters.

We were handed the keys to the greatest economic machine in the history of the planet and we wrecked it.

As young people realize that their futures have been destroyed, many of them are going to totally lose hope and give in to despair.

And desperate people do desperate things.  As our economy continues to crumble, we are going to see crime greatly increase as people do what they feel they need to do in order to survive.  In fact, we are already starting to see this happen.  Just this week, CNBC reported on the raging epidemic of copper theft that we are seeing all over the nation right now…

Copper is such a hot commodity that thieves are going after the metal anywhere they can find it: an electrical power station in Wichita, Kan., or half a dozen middle-class homes in Morris Township, N.J. Even on a Utah highway construction site, crooks managed to abscond with six miles of copper wire.

Those are just a handful of recent targets across the U.S. in the $1 billion business of copper theft.

“There’s no question the theft has gotten much, much worse,” said Mike Adelizzi, president of the American Supply Association, a nonprofit group representing distributors and suppliers in the plumbing, heating, cooling and industrial pipe industries.

The United States once had the greatest middle class in the history of the world, but now it it dying.

This is causing a tremendous amount of anger and frustration to build in this nation, and when the next major wave of the economic collapse strikes, a lot of that anger and frustration will likely be unleashed.

The American people don’t understand that these problems have taken decades to develop.  They just want someone to fix things.  They just want things to go back to the way that they used to be.

Unfortunately, the great economic storm that is coming is not going to be averted.

Get ready while you still can.  Time is running out.