The Price Of Ground Beef Has DOUBLED Since The Last Financial Crisis

Burger And Fries - Photo by Ewan Munro
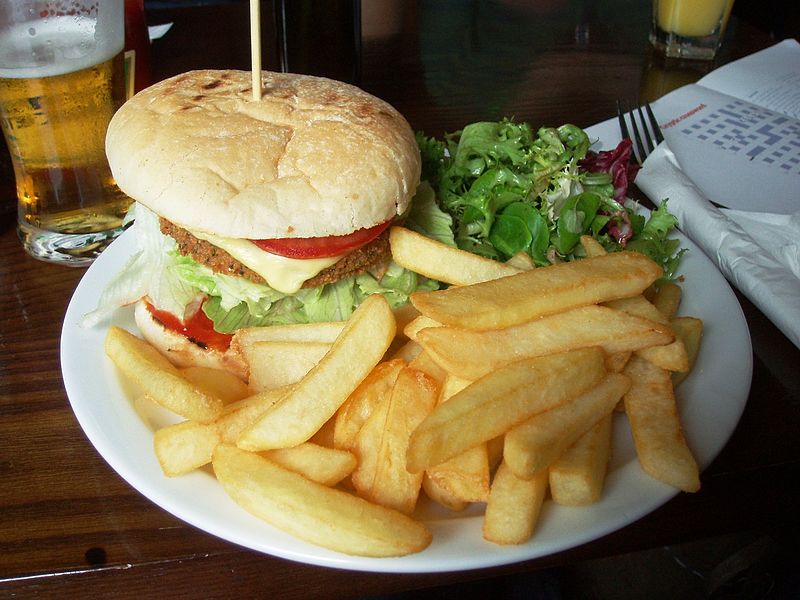
Since the depths of the last recession, the price of ground beef in the United States has doubled.  Has your paycheck doubled since then?  Even though the Federal Reserve insists that we are in a “low inflation” environment, the government’s own numbers show that the price of ground beef has been on an unprecedented run over the past six years.  In early 2009, the average price of a pound of ground beef was hovering near 2 dollars.  In February, it hit a brand new all-time record high of $4.238 per pound.  Even just 12 months ago, the price of ground beef was sitting at $3.555 per pound.  So we are talking about a huge increase.  And this hits American families where they really live.  Each year, the average American consumes approximately 270 pounds of meat.  The only nation in the world that eats more meat than we do is Luxembourg.  If the paychecks of American workers were going up fast enough to deal with this increase, it wouldn’t be that big of a deal.  But of course that is not happening.  In an article just last week, I showed that real median household income is a couple thousand dollars lower now than it was during the depths of the last recession.  The middle class is being squeezed, and we are rapidly getting to the point where burgers are going to be considered a “luxury” item.

The following chart was posted by the Economic Policy Journal on Wednesday, and it incorporates the latest data from the Bureau of Labor Statistics.  When I first saw it, I was rather stunned.  I knew that the price of ground beef had become rather outrageous in my local grocery stores, but I had no idea just how much damage had been done over the past six years…

Beef Price - Economic Policy Journal

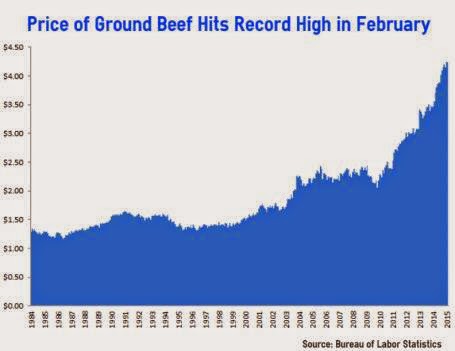
The biggest reason why the price of ground beef has been going up is the fact that the U.S. cattle herd has been shrinking.  It shrunk seven years in a row, and on January 1st, 2014 it was the smallest that it had been since 1951.

The good news is that the decline appears to have stopped, at least for the moment.  According to the Wall Street Journal, the size of the U.S. cattle herd actually increased by 1 percent last year…

The U.S. cattle herd expanded in 2014 for the first time in eight years, offering hope to consumers that beef prices could start to subside after soaring to a series of records.

The nation’s cattle supply increased 1% in the year through Jan. 1 to 89.8 million head, according to data released Friday by the U.S. Agriculture Department, reversing a steady decline fueled by prolonged drought in the southern U.S. Great Plains and industry consolidation that encouraged many ranchers to thin herds.

But an increase of 1 percent is just barely going to keep up with the official population growth rate.  If you factor in illegal immigration, we are still losing ground.

And if we have another major drought in cattle country this summer, the cattle herd is going to start shrinking again.

In addition, the price of food overall has been steadily rising for years.  Here is a chart that I shared the other day

Presentation Food Inflation

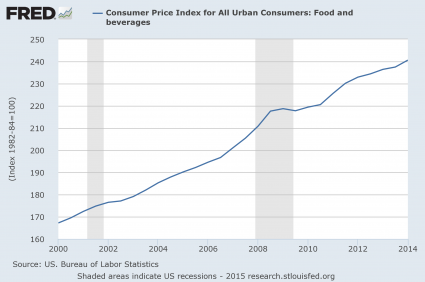
It boggles the mind that the Federal Reserve can claim that we are in a “low inflation” environment.  Anyone that goes grocery shopping feels the pain of these rising prices every time that they go to the store.

In the list that I put together yesterday, I included the following statistic…

Almost half of all Americans (47 percent) do not put a single penny out of their paychecks into savings.

One of the primary reasons why so many Americans are not saving any money is because many families simply cannot save any money.  Their paychecks are stagnant while the cost of living just keeps going up and up.

There simply are not enough “good jobs” out there anymore.  Our economy continues to bleed middle class jobs and the competition for the jobs that remain is quite intense.

Do you know what the two most common occupations in America today are?

According to the Bureau of Labor Statistics, they are “retail sales clerk” and “cashier”.

And of course neither of those “occupations” pays even close to what is required to support a middle class family.

On average, a retail sales clerk makes $24,020 a year, and a cashier makes $20,670 a year.

Because the quality of our jobs has declined so much, there are millions of American families today in which both the mother and the father are working multiple jobs in a desperate attempt to make ends meet each month.

But don’t worry, the Federal Reserve says that we are nearly at “full employment“, and Barack Obama says that everything is going to be just fine.

Actually, the truth is that things are about to get a lot worse.  At this point, we are even getting pessimistic numbers out of the Federal Reserve.  Just this week we learned that the Fed is now projecting that economic growth for the first quarter of 2015 will be barely above zero

From almost 2.5% GDP growth expectations in February, The Atlanta Fed’s GDPNow model has now collapsed its estimates of Q1 GDP growth to just 0.2%plunging from +1.4% just 2 weeks ago. The reality of plunging capex and no decoupling is starting to rear its ugly head in the hard data and as the sun warms things up, weather will start to lose its ability to sway sentiment.

We are at a turning point.  The bubble of false stability that we have been living in is rapidly coming to an end, and when people start to realize that another great economic crisis is coming there is going to be a lot of panic.

And as far as food prices go, they are just going to keep taking a bigger chunk out of all of our wallets.

As high as prices are already, the truth is that your food dollars are never going to go farther than they do right now.

So let us hope for the best, but let us also get prepared for the worst.

This Is About As Good As Things Are Going To Get For The Middle Class – And It’s Not That Good

Depressed - Public DomainThe U.S. economy has had six full years to bounce back since the financial collapse of 2008, and it simply has not happened.  Median household income has declined substantially since then, total household wealth for middle class families is way down, the percentage of the population that is employed is still about where it was at the end of the last recession, and the number of Americans that are dependent on the government has absolutely exploded.  Even those that claim that the economy is “recovering” admit that we are not even close to where we used to be economically.  Many hope that someday we will eventually get back to that level, but the truth is that this is about as good as things are ever going to get for the middle class.  And we should enjoy this period of relative stability while we still can, because when the next great financial crisis strikes things are going to fall apart very rapidly.

The U.S. Census Bureau has just released some brand new numbers, and they are quite sobering.  For example, after accounting for inflation median household income in the United States has declined a total of 8 percent from where it was back in 2007.

That means that middle class families have significantly less purchasing power than they did just prior to the last major financial crisis.

And one research firm is projecting that it is going to take until 2019 for median household income to return to the level that we witnessed in 2007…

For everybody wondering why the economic recovery feels like a recession, here’s the answer: We’re still at least five years away from regaining everything lost during the 2007-2009 downturn.

Forecasting firm IHS Global Insight predicts that real median household income — perhaps the best proxy for middle-class living standards — won’t reach the prior peak from 2007 until 2019. Since the numbers are adjusted for inflation, that means the typical family will wait 12 years until their purchasing power is as strong as it was before the recession. That would be the longest period of stagnation, by far, since the Great Depression of the 1930s.

Of course that projection assumes that the economy will continue to “recover”, which is a very questionable assumption at best.

Meanwhile, total household wealth has been declining for middle class families as well.

According to the New York Times, the “typical American household” is now worth 36 percent less than it was worth a decade ago.

That is a pretty substantial drop.  But you never hear our politicians (especially the Democrats) bring up numbers like that because they want us to feel good about things.

So why is all of this happening?

The biggest reason why the middle class is struggling so much is the lack of good jobs.

As the chart posted below demonstrates, the percentage of the working age population that is actually employed is still way, way below where it was prior to the last recession…

Employment Population Ratio

The “employment recovery” (the tiny little bump at the end of the chart) has been so miniscule that it is hardly even worth mentioning.

At the moment, we still have 1.4 million fewer full-time jobs than we did in 2008 even though more than 100,000 people are added to the U.S. population each month.

And a lot of the workers that have lost jobs since the start of the last recession have never been able to find a new one.

According to a brand new survey conducted by Rutgers University, more than 20 percent of all workers that have been laid off in the past five years still have not found a new job.

Meanwhile, the control freak bureaucrats that run this country continue to kill off small businesses.

In recent years we have seen large numbers of small businesses fail, and at this point the rate of small business ownership in the United States is at an all-time low.

As a result of everything that you have just read, the middle class is shrinking and dependence on the government is soaring.

Today, there are 49 million Americans that are dealing with food insecurity, and Americans received more than 2 trillion dollars in benefits from the federal government last year alone.

For many more statistics just like this, please see my previous article entitled “30 stats to show to anyone that does not believe the middle class is being destroyed“.

Without a doubt, things are not that good for the middle class in America these days.

Unfortunately, the next great wave of financial trouble is rapidly approaching, and once it strikes things are going to get substantially worse for the middle class.

Yes, the stock market set record high after record high this summer.  But what we have observed is classic bubble behavior.  So many of the exact same patterns that occurred just prior to previous stock market crashes are happening once again.

And it is interesting to note that September 22nd has marked important market peaks at various times throughout history…

For traders, September 22 is one of those days with a notorious history. UBS’s Art Cashin notes that September 22 marked various market highs in 1873, 1929, 1980, and even as recent as 2008.

Could the coming months be the beginning of the next major stock market decline?

Small-cap stocks are already starting to show signs of real weakness.  In fact, the Russell 2000 just hit a “death cross” for the first time in more than 2 years

The Russell 2000 has been diverging from the broader market over the last several weeks, and now technicians point out it has flashed a bearish signal. For the first time in more than two years, the small-cap index has hit a so-called death cross.

A death cross occurs when a nearer-term 50-day moving average falls below a longer-term, 200-day moving average. Technicians argue that a death cross can be a bearish sign.

None of us knows what the market is going to do tomorrow, but a lot of the “smart money” is getting out of the market right now while the getting is good.

So where is the “smart money” putting their assets?

In a previous article, I discussed how sales of gold bars to wealthy clients is way up so far this year.

And CNBC has just reported that the ultra-wealthy “are holding mountains of cash” right now…

Billionaires are holding mountains of cash, offering the latest sign that the ultra-wealthy are nervous about putting more money into today’s markets.

According to the new Billionaire Census from Wealth-X and UBS, the world’s billionaires are holding an average of $600 million in cash each—greater than the gross domestic product of Dominica.

Why are they doing this?

Are they concerned about the potential of a market crash?

And if we do see another market crash like we witnessed back in 2008, what is that going to mean for the rest of us?

2008 certainly did not destroy our economy.

But it did cause an immense amount of damage that we have never recovered from.

Now the next wave is approaching, and most people don’t even see it coming.

37 Statistics Which Show How Four Years Of Obama Have Wrecked The U.S. Economy

37 Statistics Which Show How Four Years Of Obama Have Wrecked The U.S. EconomyThe mainstream media covered the inauguration of Barack Obama with breathless anticipation on Monday, but should we really be celebrating another four years of Obama?  The truth is that the first four years of Obama were an absolute train wreck for the U.S. economy.  Over the past four years, the percentage of working age Americans with a job has fallen, median household income has declined by more than $4000, poverty in the U.S. has absolutely exploded and our national debt has ballooned to ridiculous proportions.  Of course all of the blame for the nightmarish performance of the economy should not go to Obama alone.  Certainly much of what we are experiencing today is the direct result of decades of very foolish decisions by Congress and previous presidential administrations.  And of course the Federal Reserve has more influence over the economy than anyone else does.  But Barack Obama steadfastly refuses to criticize anything that the Federal Reserve has done and he even nominated Ben Bernanke for another term as Fed Chairman despite his horrific track record of failure, so at a minimum Barack Obama must be considered to be complicit in the Fed’s very foolish policies.  Despite what the Obama administration tells us, the U.S. economy has been in decline for a very long time, and that decline has accelerated in many ways over the past four years.  Just consider the statistics that I have compiled below.  The following are 37 statistics which show how four years of Obama have wrecked the U.S. economy…

1. During Obama’s first term, the number of Americans on food stamps increased by an average of about 11,000 per day.

2. At the beginning of the Obama era, 32 million Americans were on food stamps.  Today, more than 47 million Americans are on food stamps.

3. According to one calculation, the number of Americans on food stamps now exceeds the combined populations of “Alaska, Arkansas, Connecticut, Delaware, District of Columbia, Hawaii, Idaho, Iowa, Kansas, Maine, Mississippi, Montana, Nebraska, Nevada, New Hampshire, New Mexico, North Dakota, Oklahoma, Oregon, Rhode Island, South Dakota, Utah, Vermont, West Virginia, and Wyoming.”

4. The number of Americans receiving money directly from the federal government each month has grown from 94 million in the year 2000 to more than 128 million today.

5. According to the U.S. Census Bureau, more than 146 million Americans are either “poor” or “low income” at this point.

6. The unemployment rate in the United States is exactly where it was (7.8 percent) when Barack Obama first entered the White House in January 2009.

7. When Barack Obama first entered the White House, 60.6 percent of all working age Americans had a job.  Today, only 58.6 percent of all working age Americans have a job.

8. During the first four years of Obama, the number of Americans “not in the labor force” soared by an astounding 8,332,000.  That far exceeds any previous four year total.

9. During Obama’s first term, the number of Americans collecting federal disability insurance rose by more than 18 percent.

10. The Obama years have been absolutely devastating for small businesses in America.  According to economist Tim Kane, the following is how the number of startup jobs per 1000 Americans breaks down by presidential administration

Bush Sr.: 11.3

Clinton: 11.2

Bush Jr.: 10.8

Obama: 7.8

11. Median household income in America has fallen for four consecutive years.  Overall, it has declined by over $4000 during that time span.

12. The economy is not producing nearly enough jobs for the hordes of young people now entering the workforce.  Approximately 53 percent of all U.S. college graduates under the age of 25 were either unemployed or underemployed in 2011.

13. According to a report from the National Employment Law Project, 58 percent of the jobs that have been created since the end of the recession have been low paying jobs.

14. Back in 2007, about 28 percent of all working families were considered to be among “the working poor”.  Today, that number is up to 32 percent even though our politicians tell us that the economy is supposedly recovering.

15. According to the Center for Economic and Policy Research, only 24.6 percent of all of the jobs in the United States are “good jobs” at this point.

16. According to the U.S. Census Bureau, the middle class is taking home a smaller share of the overall income pie than has ever been recorded before.

17. According to the Economic Policy Institute, the United States is losing half a million jobs to China every single year.

18. The United States has fallen in the global economic competitiveness rankings compiled by the World Economic Forum for four years in a row.

19. According to the World Bank, U.S. GDP accounted for 31.8 percent of all global economic activity in 2001.  That number declined steadily over the course of the next decade and was only at 21.6 percent in 2011.

20. The United States actually has plenty of oil and we should not have to import oil from the Middle East.  We need to drill for more oil, but Obama has been very hesitant to do that.  Under Bill Clinton, the number of drilling permits approved rose by 58 percent.  Under George W. Bush, the number of drilling permits approved rose by 116 percent.  Under Barack Obama, the number of drilling permits approved actually decreased by 36 percent.

21. When Barack Obama took office, the average price of a gallon of gasoline was $1.84.  Today, the average price of a gallon of gasoline is $3.26.

22. Under Barack Obama, the United States has lost more than 300,000 education jobs.

23. For the first time ever, more than a million public school students in the United States are homeless.  That number has risen by 57 percent since the 2006-2007 school year.

24. Families that have a head of household under the age of 30 now have a poverty rate of 37 percent.

25. More than three times as many new homes were sold in the United States in 2005 as were sold in 2012.

26. Electricity bills in the United States have risen faster than the overall rate of inflation for five years in a row.

27. Health insurance costs have risen by 29 percent since Barack Obama became president.

28. Today, 77 percent of all Americans live paycheck to paycheck at least part of the time.

29. It is being projected that Obamacare will add 16 million more Americans to the Medicaid rolls.

30. The total amount of money that the federal government gives directly to the American people has grown by 32 percent since Barack Obama became president.

31. The Obama administration has been spending money on some of the most insane things imaginable.  For example, in 2011 the Obama administration spent $592,527 on a study that sought to figure out once and for all why chimpanzees throw poop.

32. U.S. taxpayers spend more than 20 times as much on the Obamas as British taxpayers spend on the royal family.

33. The U.S. government has run a budget deficit of well over a trillion dollars every single year under Barack Obama.

34. When Barack Obama was first elected, the U.S. debt to GDP ratio was under 70 percent.  Today, it is up to 103 percent.

35. During Obama’s first term, the federal government accumulated more debt than it did under the first 42 U.S presidents combined.

36. As I wrote about yesterday, when you break it down the amount of new debt accumulated by the U.S. government during Obama’s first term comes to approximately $50,521 for every single household in the United States.  Are you ready to contribute your share?

37. If you started paying off just the new debt that the U.S. has accumulated during the Obama administration at the rate of one dollar per second, it would take more than 184,000 years to pay it off.

But despite all of these numbers, the mainstream media and the left just continue to shower Barack Obama with worship and praise.  Newsweek recently heralded Obama’s second term as “The Second Coming“, and at Obama’s pre-inauguration church service Reverand Ronald Braxton openly compared Obama to Moses…

At Metropolitan African Methodist Episcopal Church, Braxton reportedly crafted his speech around Obama’s personal political slogan: “Forward!”

Obama, said Braxton, was just like Moses facing the Red Sea: “forward is the only option … The people couldn’t turn around. The only thing that they could do was to go forward.” Obama, said Braxton, would have to overcome all obstacles – like opposition from Republicans, presumably, or the bounds of the Constitution. Braxton continued, “Mr. President, stand on the rock,” citing to Moses standing on Mount Horeb as his people camped outside the land of Israel.

But it wasn’t enough to compare Obama with the founder of Judaism and the prophet of the Bible. Braxton added that Obama’s opponents were like the Biblical enemies of Moses, and that Obama would have to enter the battle because “sometimes enemies insist on doing it the hard way.”

So what do you think the next four years of Obama will bring?

Please feel free to post a comment with your thoughts below…

Obama Inauguration

It Is Not Just Your Imagination – American Families ARE Getting Poorer

Did you know that median household income in the United States is lower today than it was when the last recession supposedly ended?  If we are in the middle of an “economic recovery”, how can this possibly be happening?  Stunning new statistics compiled by Sentier Research show that the U.S. economy is not nearly as healthy as we have been led to believe.  According to the study that Sentier Research has just released, median household income in the United States was sitting at $55,470 back in January 2000.  In December 2007, when the recession began, it was sitting at $54,916.  In June 2009, when the recession supposedly ended, it was sitting at $53,508.  Today, it is sitting at $50,964.  This is a long-term trend that is definitely going in the wrong direction.  The fact that median household income in the U.S. is now 4.8 percent lower than it was when the last recession ended is incredibly disturbing, especially since all of the things that we buy on a regular basis just keep going up in price.  Food, gas, electricity, car insurance and health insurance all cost a whole lot more today than they did back in the year 2000, and yet median household income has dropped 8.1 percent since that time.  So what does all of this mean?  It means that American families ARE getting poorer.

Yes, the stock market has been soaring, corporate profits have set all-time records in recent years and the big Wall Street banks that were showered with bailout money are absolutely thriving.

But there has been no economic recovery on “Main Street”.

According to the Sentier Research report mentioned above, incomes have been declining in all geographic regions of the country and in all sectors of the economy….

-Median household income for the self-employed has fallen 9.4 percent since June 2009.

-Median household income for private sector employees has fallen 4.5 percent since June 2009.

-Median household income for government workers has fallen 3.5 percent since June 2009.

-Median household income for Americans living in the West has fallen 8.5 percent since June 2009.

-Median household income for Americans living in the Northeast has fallen 4.9 percent since June 2009.

-Median household income for Americans living in the South has also fallen 4.9 percent since June 2009.

-Median household income for Americans living in the Midwest has fallen 1.1 percent since June 2009.

Remember, the recession supposedly ended in June 2009.

Since that time we have supposedly been in a “recovery”.

So if it has seemed to you that American families have been getting poorer it has not just been your imagination.

In a previous article, I detailed 84 statistics that prove that the middle class in America is being systematically destroyed.  If you have not read it yet, I encourage you to go check it out.  At this point it is absolutely undeniable that the middle class in America is declining.  The following are just a couple of the numbers from my recent article….

1. According to the Pew Research Center, 61 percent of all Americans were “middle income” back in 1971.  Today, only 51 percent of all Americans are.

2. The Pew Research Center has also found that 85 percent of middle class Americans say that it is harder to maintain a middle class standard of living today compared with 10 years ago.

3. 62 percent of middle class Americans say that they have had to reduce household spending over the past year.

4. The average net worth of a middle class family in America was $129,582 in 2001.  By 2010 that figure had dropped to $93,150.

5. According to the Federal Reserve, the median net worth of all families in the United States declined “from $126,400 in 2007 to $77,300 in 2010“.

You can find 79 more statistics just like this right here.

At the same time that our incomes are going down, the cost of living just continues to rise steadily.

Thanks Ben Bernanke.

American families are being increasingly stretched financially, and if major changes are not made this is going to get even worse in the years ahead.

Another thing that we aren’t being told on the nightly news is that the percentage of working age Americans that have jobs is lower today than when the last recession ended.

So let’s summarize….

-A smaller percentage of Americans have jobs today compared to June 2009.

-Median household income has declined by 4.8 percent since June 2009.

-American families are far less wealthy than they were just a few years ago.

Are we sure that we are in an economic recovery?

Just look at what is happening to our cities.

The rest of the world once looked at Detroit in awe.

Now it is a global joke.

You can see some incredible photographs of the devastation in Detroit right here.

This kind of thing is happening on the east coast as well.  I have written many times about how horrible life has become in places such as Camden, New Jersey.

Well, now the entire Camden police force is being disbanded, and the policing of the city is going to be turned over to the county.

We are a mess, and it is time to admit that.

Sadly, most Americans simply have no idea how close our economic system really is to total system failure.

Only 24.6 percent of the jobs in this country are “good jobs” at this point, the velocity of money in our economy has plunged to a post-World War II low, unemployment is rampant, more than half of all Americans are at least partially financially dependent on the government and our national debt is crossing the 16 trillion dollar mark.

We don’t need someone to come in and “tweak” the economy.

We need radical reconstructive surgery.

But most Americans do not understand this.

Most Americans do not seem to grasp these things until economic hardship touches them personally.

After all, if you still have a good job and the mainstream media is telling you that everything is going to be okay it is really easy to pretend that we aren’t heading for an economic disaster of unimaginable proportions.

A massive problem that we are facing right now is something known as “normalcy bias”. This is how Wikipedia defines “normalcy bias”….

The normalcy bias, or normality bias, refers to a mental state people enter when facing a disaster. It causes people to underestimate both the possibility of a disaster occurring and its possible effects. This often results in situations where people fail to adequately prepare for a disaster, and on a larger scale, the failure of governments to include the populace in its disaster preparations. The assumption that is made in the case of the normalcy bias is that since a disaster never has occurred then it never will occur. It also results in the inability of people to cope with a disaster once it occurs. People with a normalcy bias have difficulties reacting to something they have not experienced before. People also tend to interpret warnings in the most optimistic way possible, seizing on any ambiguities to infer a less serious situation.

Doesn’t that sound exactly like the vast majority of Americans right now?

Most Americans just assume that since we have always recovered from every other economic downturn in the past that we will always be able to easily handle whatever the future throws at us.

If only that was true.

We are heading into a time that will be unlike anything any of us have ever experienced before, and many people that have blind faith in the system are going to be absolutely devastated when this coming crisis blindsides them.

Our economy has been collapsing, it is continuing to collapse, and the collapse is going to accelerate dramatically in the coming years.

You can have blind faith in the system, or you can get prepared for what is coming.

The choice is up to you.