BLACK MONDAY: The First Time EVER The Dow Has Dropped By More Than 500 Points On Two Consecutive Days

New York City Empire State Building - Public Domain
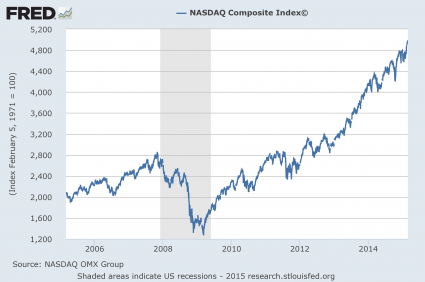
On Monday, the Dow Jones Industrial Average plummeted 588 points. It was the 8th worst single day stock market crash in U.S. history, and it was the first time that the Dow has ever fallen by more than 500 points on two consecutive days. But the amazing thing is that the Dow actually performed better than almost every other major global stock market on Monday.  In the U.S., the S&P 500 and the Nasdaq both did worse than the Dow. In Europe, almost every major index performed significantly worse than the Dow.  Over in Asia, Japanese stocks were down 895 points, and Chinese stocks experienced the biggest decline of all (a whopping 8.46 percent). On June 25th, I was not kidding around when I issued a “red alert” for the last six months of 2015. I had never issued a formal alert for any other period of time, and I specifically stated that “a major financial collapse is imminent“. But you know what? As the weeks and months roll along, things will eventually be even worse than what any of the experts (including myself) have been projecting. The global financial system is now unraveling, and you better pack a lunch because this is going to be one very long horror show.

Our world has not seen a day quite like Monday in a very, very long time. Let’s start our discussion where the carnage began…

Asian Markets

For weeks, the Chinese government has been taking unprecedented steps to try to stop Chinese stocks from crashing, but nothing has worked. As most Americans slept on Sunday night, the markets in China absolutely imploded

As Europe and North America slept on Sunday night, Chinese markets went through the floor — the Shanghai Composite index of stocks fell by 8.49%, the biggest single-day collapse since 2007.

It wasn’t alone. Hong Kong’s Hang Seng fell 5.17%, and Japan’s Nikkei fell 4.61%. Stocks in Taiwan, the Philippines, Singapore, and Thailand also tumbled.

Things would have been even worse in China if trading had not been stopped in most stocks. Trading was suspended for an astounding 2,200 stocks once they hit their 10 percent decline limits.

Overall, the Shanghai Composite Index is now down close to 40 percent from the peak of the market, and the truth is that Chinese stocks are still massively overvalued when compared to the rest of the world.

That means that they could very easily fall a lot farther.

European Markets

The selling momentum in Asia carried over into Europe once the European markets opened. On a percentage basis, all of the major indexes on the continent declined even more than the Dow did

In Europe, the bloodbath from Friday continued unabated. The German Dax plunged 4.7%, the French CAC 40 5.4%, UK’s FTSE 100 dropped 4.7%. Euro Stoxx 600, which covers the largest European companies, was down 5.3%.

But wait… Europe is where the omnipotent ECB and other central banks have imposed negative deposit rates. The ECB is engaged in a massive ‘whatever it takes” QE program to inflate stock markets. But it’s not working. Omnipotence stops functioning once people stop believing in it.

U.S. Markets

Even before U.S. markets opened on Monday morning, the New York Stock Exchange was already warning that trading would be halted if things got too far out hand, and it almost happened

The thousands of companies listed by the New York Stock Exchange and Nasdaq Stock Market will pause for 15 minutes if the Standard & Poor’s 500 Index plunges 7 percent before 3:25 p.m. New York time. The benchmark got close earlier, falling as much as 5.3 percent.

There were other circuit breakers in place for later in the day if too much panic selling ensued, but fortunately none of those were triggered either. Here is more from Bloomberg

Another circuit breaker kicks in if the S&P 500 extends its losses to 13 percent before 3:25 p.m. If the plunge reaches 20 percent at any point during today’s session, the entire stock market will shut for the rest of the day.

When the U.S. markets did open, the Dow plunged 1,089 points during the opening minutes of trading. If the Dow would have stayed at that level, it would have been the worst single day stock market crash in U.S. history by a wide margin.

Instead, by the end of the day it only turned out to be the 8th worst day ever.

And in case you are wondering, yes, investors are losing a staggering amount of money. According to MarketWatch, the total amount of money lost is now starting to approach 2 trillion dollars

As of March 31, households and nonprofits held $24.1 trillion in stocks. That’s both directly, and through mutual funds, pension funds and the like. That also includes the holdings of U.S.-based hedge funds, though you’d have to think that most hedge funds are held by households.

Using the Dow Jones Total Stock Market index DWCF, -4.21% through midmorning trade, that number had dropped to $22.32 trillion.

In other words, a cool $1.8 trillion has been lost between now and the first quarter — and overwhelmingly, those losses occurred in the last few days.

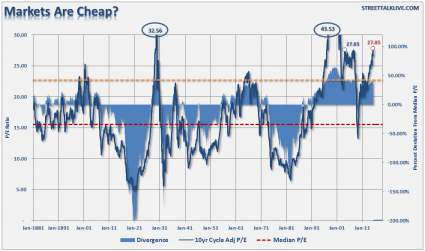
Unfortunately, U.S. stock prices are still nowhere near where they should be. If they were to actually reflect economic reality, they would have to fall a lot, lot lower.

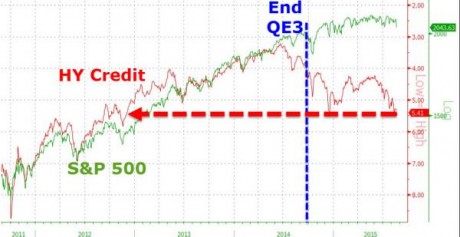
For example, there is usually a very strong correlation between commodity prices and the S&P 500, but in recent times we have seen a very large divergence take place. Just check out the chart in this article. At this point the S&P 500 would have to fall another 30 to 40 percent or commodities would have to rise 30 or 40 percent in order to close the gap. I think that the following bit of commentary sums up where we are quite nicely

“Markets are afraid of further economic weakness in China, further pain in global commodity markets and uncertain about Fed and PBoC policy — what they will do and what the impact will be,” Societe Generale’s Kit Juckes wrote on Monday. “The divergence between global commodity prices and equities is not a new theme but the danger now is that they begin to re-correlate – as they did when the dotcom bubble burst in 2000 and what had previously been an emerging market crisis became a US recession.”

And commodities were absolutely hammered once again on Monday.

For instance, the price of U.S. oil actually fell below 38 dollars a barrel at one point.

What we are watching unfold is incredible.

Of course the mainstream media is bringing on lots of clueless experts that are talking about what a wonderful “buying opportunity” this is. Even though those of us that saw this coming have been giving a detailed play by play account of the unfolding crisis for months, the talking heads on television still seem as oblivious as ever.

What is happening right now just doesn’t seem to make any sense to the “experts” that most people listen to. I love this headline from an article that Business Insider posted on Monday: “None of the theories for the Black Monday market crash add up“. Yes, if you are willingly blind to the long-term economic and financial trends which are destroying us, I guess these market crashes wouldn’t make sense.

And if stocks go up tomorrow (which they probably should), all of those same “experts” will be proclaiming that the “correction” is over and that everything is now fine.

But don’t be fooled by that. Just because stocks go up on any particular day does not mean that everything is fine. We are in the midst of a financial meltdown that is truly global in scope. This is going to take time to fully play out, and there will be good days and there will be bad days.  The three largest single day increases for the Dow were right in the middle of the financial crisis of 2008. So one very good day for stocks is not going to change the long-term analysis one bit.

It isn’t complicated. Those that follow my writing regularly know that I have repeatedly explained how things were setting up in textbook fashion for another global financial crisis, and now one is unfolding right in front of our eyes.

At this point, everyone should be able to very clearly see what is happening, and yet most are still blind.

Why is that?

We Have Already Witnessed The First 1300 Points Of The Stock Market Crash Of 2015

New York Stock Exchange - Photo from Wikimedia CommonsWhat has been happening on Wall Street the past few days has been nothing short of stunning.  On Thursday, the Dow Jones Industrial Average plummeted 358 points.  It was the largest single day decline in a year and a half, and investors are starting to panic.  Overall, the Dow is now down more than 1300 points from the peak of the market.  Just yesterday, I wrote about all of the experts that are warning about a stock market crash in 2015, and after today I am sure that a lot more people will start jumping on the bandwagon.  In particular, tech stocks are getting absolutely hammered lately.  The Nasdaq has fallen close to 3.5% over the past two days alone, and it has dropped below its 200-day moving average.  The Russell 2000 (a small-cap stock market index) is also now trading below its 200-day moving average.  What all of this means is that the stock market crash of 2015 has already begun.  The only question left to answer at this point is how bad it will ultimately turn out to be.

When stocks were booming, tech stocks were leading the way up.

But now that the market has turned, tech stocks are starting to lead the way down

The Dow and the S&P 500 are negative for the year. The so-called “FANG” stocks – Facebook, Apple, Netflix, and Google – were some of the biggest losers, and helped send the Nasdaq more than 2% lower. Biotechs also suffered big losses; the iShares Nasdaq Biotechnology ETF fell 4% to a three-month low. The Vix, which gauges market expectations for near-term shifts in the S&P 500, surged more than 21%.

And Twitter is absolutely imploding.  It has fallen below its IPO price, and at this point it is now down 65 percent from the peak.

Of course it was inevitable that Twitter and these tech stocks would start falling eventually.  I specifically warned my readers about Twitter’s stock price nearly two years ago.  I hope people listened to what I was saying and got out in time.

This current market crash is happening in the context of a full-blown global financial meltdown.  Stock markets all over the planet are collapsing, and currencies are being devalued left and right.  The following comes from a recent piece by Wolf Richter

Hot money is already fleeing emerging markets. Higher rates in the US will drain more capital out of countries that need it the most. It will pressure emerging market currencies and further increase the likelihood of a debt crisis in countries whose governments, banks, and corporations borrow in a currency other than their own.

This scenario would be bad enough for the emerging economies. But now China has devalued the yuan to stimulate its exports and thus its economy at the expense of others. And one thing has become clear on Wednesday: these struggling economies that compete with China are going to protect their exports against Chinese encroachment.

Hence a currency war.

Two more major shots in the currency war were fired on Thursday by Kazakhstan and Vietnam

Hit by sharp declines in crude prices, the oil-producing nation of Kazakhstan introduced a freely floating exchange rate for the tenge, which subsequently lost more than a quarter of its value.

The State Bank of Vietnam (SBV) devalued the dong (VND) by 1 percent against the dollar on Wednesday—its third adjustment so far this year—and simultaneously widened the trading band to 3 percent from 2 percent previously, the second increase in six days.

A quarter of its value?

Now that is a devaluation.

In the coming days, we are likely to see even more emerging markets devalue their currencies in a global “race to the bottom”.  But this “race to the bottom” presents a great danger to financial markets.  As I have written about previously, there are 74 trillion dollars in derivatives globally that are tied to the value of currencies.  As foreign exchange rates start flying around all over the place, there are going to be financial institutions out there that are going to be losing obscene amounts of money.

I cannot say the “d word” enough.  Derivatives are going to play a starring role during this financial collapse, and so that is a word that you will want to be listening for very carefully in the weeks and months to come.

The meltdown that has already been affecting much of the rest of the planet is now starting to affect us.  And it was inevitable that it would.  I like how Clive P. Maund put it recently…

Many lesser markets around the world are toppling, but somehow the big Western markets of Europe, Japan and the US are staying aloft. If you have ever made a sand castle on the beach and watched what happened when the tide comes in, you will recall that it is the weaker outer ramparts and smaller turrets that collapse first, and the big central towers that hold out the longest. The weaker outer ramparts and smaller turrets are the Emerging Markets which are already crumbling, and it won’t be long until the big central towers – the big Western Markets, go the same way – everything is pointing to it.

The funny thing is that even though all of the signs are pointing to a nightmarish global financial crisis, the mainstream media continues to insist that everything is going to be just fine.

In fact, CNBC says that the recent dip in stock prices is a “bull indicator” and they are encouraging everyone to pour lots more money into stocks.

But of course the truth is that what financial conditions are really telling us is that stocks have much, much farther to fall.

For instance, high yield credit is starting to crash just like it did prior to the stock market crash of 2008.  Stocks and high yield credit usually tend to track one another quite closely, and so when there is a divergence that is a huge red flag.  And as this chart from Zero Hedge demonstrates, a very large divergence has developed in recent months…

HY Credit And S&P 500 - Zero Hedge

Sadly, the 358 point plunge for the Dow on Thursday was just the beginning.

Yes, there will be up days and down days, but we are now officially entering the “danger zone” as we roll into the months of September and October.

So will 2015 soon be mentioned along with the famous market crashes of 1929, 1987, 2001 and 2008?

Please feel free to share what you think by posting a comment below…

11 Signs That We Are Entering The Next Phase Of The Global Economic Crisis

Earth Puzzle - Public DomainWell, the Nasdaq finally did it.  It has climbed all the way back to where it was at the peak of the dotcom bubble.  Back in March 2000, the Nasdaq set an all-time record high of 5,048.62.  On Thursday, after all these years, that all-time record was finally eclipsed.  The Nasdaq closed at 5056.06, and Wall Street greatly rejoiced.  So if you invested in the Nasdaq at the peak of the dotcom bubble, you are just finally breaking even 15 years later.  Unfortunately, the truth is that stocks have not been soaring because the U.S. economy is fundamentally strong.  Just like the last two times, what we are witnessing is an irrational financial bubble.  Sometimes these irrational bubbles can last for a surprisingly long time, but in the end they always burst.  And even now there are signs of economic trouble bubbling to the surface all around us.  The following are 11 signs that we are entering the next phase of the global economic crisis…

#1 It is being projected that half of all fracking companies in the United States will be “dead or sold” by the end of this year.

#2 The rig count just continues to fall as the U.S. oil industry implodes.  Incredibly, the number of rigs in operation in the United States has fallen for 19 weeks in a row.

#3 McDonald’s has announced that it will be closing 700 “poor performing” restaurants in 2015.  Why would McDonald’s be doing this if the economy was actually getting better?

#4 As I wrote about the other day, we could be right on the verge of a Greek debt default.  In fact, we learned on Thursday that the Greek government has been “running on empty” for months…

Greece warned it will go bankrupt next week after failing to stump up enough cash to pay millions of public sector workers and its international debts.

Deputy finance minister Dimitras Mardas set alarm bells ringing yesterday when he declared the country had been ‘running on empty’ since February.

With a debt repayment deadline looming on May 1, Greece faces the deeply damaging prospect of having to snub its own employees to make a €200m payment to the International Monetary Fund.

#5 Coal accounts for approximately 40 percent of all electrical generation on the entire planet.  When the price of coal starts to drop, that is a sign that economic activity is slowing down.  Just prior to the last financial crisis in 2008, the price of coal shot up dramatically and then crashed really hard.  Well, guess what?  The price of coal has been crashing again, and it is already lower than it was at any point during the last recession.

#6 The price of iron ore has been crashing as well.  It is down 35 percent in the last nine months, and David Stockman believes that this is because of a major deflationary crisis that is brewing in China…

There is no better measure of the true contraction underway in China than the price of iron ore. The Wall Street stock peddlers will tell you not to be troubled by the 70% plunge from the 2012 highs and the 35% drop just in the last nine months. According to them, its all the fault of the big global miners who went overboard opening up massive new iron ore pits and mining infrastructure.

#7 At this point, China accounts for more total global trade than anyone else in the world.  That is why it is so alarming that Chinese imports and exports are both absolutely collapsing

China’s monthly trade data shows exports fell in March from a year ago by 14.6% in yuan terms, compared to expectations for a rise of more than 8%.

Imports meanwhile fell 12.3% in yuan terms compared to forecasts for a fall of more than 11%.

#8 The number of publicly traded companies in the United States that filed for bankruptcy during the first quarter of 2015 was more than double the number that filed for bankruptcy during the first quarter of 2014.

#9 New home sales in the United States just declined at their fastest pace in almost two years.

#10 U.S. manufacturing data has been shockingly weak lately…

On the heels of weak PMIs from Europe and Asia, Markit’s US Manufacturing PMI plunged to 54.2 in April (from 55.7). Against expectations of a rise to 55.6, this is the biggest miss on record. Of course, this is ‘post-weather’ so talking-heads will need to find another excuse as New Orders declined for the first time since Nov 2014.

#11 When priced according to “the average blue-collar hourly wage“, U.S. stocks are the most expensive that they have ever been in history right now.  To say that this financial bubble is overdue to burst is a massive understatement.

For a long time, I have been pointing to 2015 as a major “turning point” for the global financial system, and I still feel that way.

But for the first four months of this year, things have been surprisingly quiet – at least on the surface.

So what is going on?

Well, I believe that what we are experiencing right now is the proverbial “calm before the storm”.  There is all sorts of turmoil brewing just beneath the surface, but for the moment things seem like they are running along just fine to most people.  Unfortunately, this period of quiet is not going to last much longer.

And those that are “in the know” are already moving their money in anticipation of what is coming.  For example, consider the words of  Snapchat founder and CEO Evan Spiegel

Fed has created abnormal market conditions by printing money and keeping interest rates low. Investors are looking for growth anywhere they can find it and tech companies are good targets – at these values, however, all tech stocks are expensive – even looking at 5+ years of revenue growth down the road. This means that most value-driven investors have left the market and the remaining 5-10%+ increase in market value will be driven by momentum investors. At some point there won’t be any momentum investors left buying at higher prices, and the market begins to tumble. May be 10-20% correction or something more significant, especially in tech stocks.

It may not happen next week, or even next month, but big financial trouble is coming.

And when it finally arrives, it is going to shock the world, even though anyone with any sense can see the coming crisis approaching from a mile away.

7 Signs That A Stock Market Peak Is Happening Right Now

Stock Market Crash - Public DomainIs this the end of the last great run for the U.S. stock market?  Are we witnessing classic “peaking behavior” that is similar to what occurred just before other major stock market crashes?  Throughout 2014 and for the early stages of 2015, stocks have been on quite a tear.  Even though the overall U.S. economy continues to be deeply troubled, we have seen the Dow, the S&P 500 and the Nasdaq set record after record.  But no bull market lasts forever – particularly one that has no relation to economic reality whatsoever.  This false bubble of financial prosperity has been enjoyable, and even I wish that it could last much longer.  But there comes a time when we all must face reality, and the cold, hard facts are telling us that this party is about to end.  The following are 7 signs that a stock market peak is happening right now…

#1 Just before a stock market crash, price/earnings ratios tend to spike, and that is precisely what we are witnessing.  The following commentary and chart come from Lance Roberts

The chart below shows Dr. Robert Shiller’s cyclically adjusted P/E ratio. The problem is that current valuations only appear cheap when compared to the peak in 2000. In order to put valuations into perspective, I have capped P/E’s at 30x trailing earnings. The dashed orange line measures 23x earnings which has been the level where secular bull markets have previously ended. I have noted the peak valuations in periods that have exceeded that 30x earnings.

markets are cheap - StreetTalkLive

At 27.85x current earning the markets are currently at valuation levels where previous bull markets have ended rather than continued. Furthermore, the markets have exceeded the pre-financial crisis peak of 27.65x earnings. If earnings continue to deteriorate, market valuations could rise rapidly even if prices remain stagnant.

#2 The average bull market lasts for approximately 3.8 years. The current bull market has already lasted for six years.

#3 The median total gain during a bull market is 101.5 percent.  For this bull market, it has been 213 percent.

#4 Usually before a stock market crash we see a divergence between the relative strength index and the stock market itself.  This happened prior to the bursting of the dotcom bubble, it happened prior to the crash of 2008, and it is happening again right now

The first technical warning sign that we should heed is marked by a significant divergence between the relative strength index (RSI) and the market itself. This is noted by a declining pattern of lower highs in the RSI as stocks continue to make higher highs, a sign that the market is “topping out”. In the late ‘90s this divergence persisted for many years as the tech bubble reached epic valuation levels. In 2007 this divergence lasted over a much shorter period (6 months) before the market finally peaked and succumbed to massive selling. With last month’s strong rally to new records, we now have a confirmed divergence between the long-term relative strength index and the market’s price action.

#5 In the past, peaks in margin debt have been very closely associated with stock market peaks.  The following chart comes from Doug Short, and I included it in a previous article

Margin Debt

#6 As I have discussed previously, we usually witness a spike in 10 year Treasury yields just about the time that the stock market is peaking right before a crash.

Well, according to Business Insider, we just saw the largest 5 week rate rally in two decades…

Lots of guys and gals went home this past weekend thinking about the implications of the recent rise in the 10-year Treasury bond’s yield.

Chris Kimble notes it was the biggest 5-week rate rally in twenty years!

#7 A lot of momentum indicators seem to be telling us that we are rapidly approaching a turning point for stocks.  For example, James Stack, the editor of InvesTech Research, says that the Coppock Guide is warning us of “an impending bear market on the not-too-distant horizon”

A momentum indicator dubbed the Coppock Guide, which serves as “a barometer of the market’s emotional state,” has also peaked, Stack says. The indicator, which, “tracks the ebb and flow of equity markets from one psychological extreme to another,” is also flashing a warning flag.

The Coppock Guide’s chart pattern is flashing a “double top,”  which suggests that “psychological excesses are present” and that “secondary momentum has peaked” in this bull market, according to Stack.

“All of this is just another reason for concern about an impending bear market on the not-too-distant horizon,” Stack writes.

So if we are to see a stock market crash soon, when will it happen?

Well, the truth is that nobody knows for certain.

It could happen this week, or it could be six months from now.

In fact, a whole lot of people are starting to point to the second half of 2015 as a danger zone.  For example, just consider the words of David Morgan

“Momentum is one indicator and the money supply. Also, when I made my forecast, there is a big seasonality, and part of it is strict analytical detail and part of it is being in this market for 40 years. I got a pretty good idea of what is going on out there and the feedback I get. . . . I’m in Europe, I’m in Asia, I’m in South America, I’m in Mexico, I’m in Canada; and so, I get a global feel, if you will, for what people are really thinking and really dealing with. It’s like a barometer reading, and I feel there are more and more tensions all the time and less and less solutions. It’s a fundamental take on how fed up people are on a global basis. Based on that, it seems to me as I said in the January issue of the Morgan Report, September is going to be the point where people have had it.”

Time will tell if Morgan was right.

But without a doubt, lots of economic warning signs are starting to pop up.

One that is particularly troubling is the decline in new orders for consumer goods.  This is something that Charles Hugh-Smith pointed out in one of his recent articles…

The financial news is astonishingly rosy: record trade surpluses in China, positive surprises in Europe, the best run of new jobs added to the U.S. economy since the go-go 1990s, and the gift that keeps on giving to consumers everywhere, low oil prices.

So if everything is so fantastic, why are new orders cratering? New orders are a snapshot of future demand, as opposed to current retail sales or orders that have been delivered.

Posted below is a chart that he included with his recent article.  As you can see, the only time things have been worse in recent decades was during the depths of the last financial crisis…

Charles Hugh-Smith New Orders

To me, it very much appears that time is running out for this bubble of false prosperity that we have been living in.

But what do you think?  Please feel free to contribute to the discussion by posting a comment below…

Stock Market Bubble: Wall Street Is Ecstatic As The NASDAQ Closes Above 5000

Bubble In Hands - Public DomainAre we at the tail end of the stock market bubble to end all stock market bubbles?  Wall Street was full of glee Monday when the Nasdaq closed above 5000 for the first time since the peak of the dotcom bubble in March 2000.  And almost everyone in the financial world seems convinced that things are somehow “different” this time around.  Even though by almost every objective measure stocks are wildly overpriced right now, and even though there are a whole host of signs that economic trouble is on the horizon, the overwhelming consensus is that this bull market is just going to keep charging ahead.  But of course that is what they thought just before the last two stock market crashes in 2001 and 2008 as well.  No matter how many times history repeats, we never seem to learn from it.

Back in October 2002, the Nasdaq hit a post-dotcom bubble low of 1108.  From there, it went on an impressive run.  In late 2007, it briefly moved above 2800 before losing more than half of its value during the stock market crash of 2008.

So the fact that the Nasdaq has now closed above 5000 is a really big deal.  The following is how USA Today described what happened on Monday…

The Nasdaq Composite capped its long march back to 5000 Monday, eclipsing, then closing above the long-hallowed mark for the first time since March 2000.

The arduous climb came on the heels of a 10-day winning streak that ended last week, Nasdaq’s longest since July 2009. That helped fuel the technology-heavy market index to a 7% gain in February, the sixth-largest monthly climb since its 1971 launch.

The chart below shows how the Nasdaq has performed over the past decade.  As you can see, we are coming dangerously close to doubling the peak that was hit just before the last stock market collapse…

NASDAQ since 2005

By looking at that chart, you would be tempted to think that the overall U.S. economy must be doing great.

But of course that is not the case at all.

For example, just take a look at what has happened to the employment-population ratio over the past decade.  The percentage of the working age U.S. population that is currently employed is actually far lower than it used to be…

Employment Population Ratio Since 2005

So why is the stock market doing so well if the overall economy is not?

Well, the truth is that stocks have become completely divorced from economic reality at this point.  Wall Street has been transformed into a giant casino, and trading stocks has been transformed into a high stakes poker game.

And one of the ways that we can tell that a stock market bubble has formed is when people start borrowing massive amounts of money to invest in stocks.  As you can see from the commentary and chart from Doug Short below, margin debt is peaking again just like it did just prior to the last two stock market crashes…

Unfortunately, the NYSE margin debt data is a month old when it is published. Real (inflation-adjusted) debt hit its all-time high in February 2014, after which it margin declined sharply for two months, but by June it had risen to a level about two percent below its high and then oscillated in a relatively narrow range. The latest data point for January is four percent off its real high eleven month ago.

Margin Debt - Doug Short

So why can’t more people see this?

We are in the midst of a monumental stock market bubble and most on Wall Street seem willingly blind to it.

Fortunately, there are a few sober voices in the crowd.  One of them is John Hussman.  He is warning that now is the time to get out of stocks

Unless we observe a rather swift improvement in market internals and a further, material easing in credit spreads – neither which would relieve the present overvaluation of the market, but both which would defer our immediate concerns about downside risk – the present moment likely represents the best opportunity to reduce exposure to stock market risk that investors are likely to encounter in the coming 8 years.

Last week, the cyclically-adjusted P/E of the S&P 500 Index surpassed 27, versus a historical norm of just 15 prior to the late-1990’s market bubble. The S&P 500 price/revenue ratio surpassed 1.8, versus a pre-bubble norm of just 0.8. On a wide range of historically reliable measures (having a nearly 90% correlation with actual subsequent S&P 500 total returns), we estimate current valuations to be fully 118% above levels associated with historically normal subsequent returns in stocks. Advisory bullishness (Investors Intelligence) shot to 59.5%, compared with only 14.1% bears – one of the most lopsided sentiment extremes on record. The S&P 500 registered a record high after an advancing half-cycle since 2009 that is historically long-in-the-tooth and already exceeds the valuation peaks set at every cyclical extreme in history but 2000 on the S&P 500 (across all stocks, current median price/earnings, price/revenue and enterprise value/EBITDA multiples already exceed the 2000 extreme). Equally important, our measures of market internals and credit spreads, despite moderate improvement in recent weeks, continue to suggest a shift toward risk-aversion among investors. An environment of compressed risk premiums coupled with increasing risk-aversion is without question the most hostile set of features one can identify in the historical record.

Everyone knows that the stock market cannot stay detached from economic reality forever.

At some point the bubble is going to burst.

If you want to know what the real economy is like, just ask Alison Norris of Detroit, Michigan

When Alison Norris couldn’t find work in Detroit, she searched past city limits, ending up with a part-time restaurant job 20 miles away, which takes at least two hours to get to using public transportation.

Norris has to take two buses to her job at a suburban mall in Troy, Michigan, using separate city and suburban bus systems.

For many city residents with limited skills and education, Detroit is an employment desert, having lost tens of thousands of blue-collar jobs in manufacturing cutbacks and service jobs as the population dwindled.

Sadly, her story is not an anomaly.  I get emails from readers all the time that are out of work and just can’t seem to find a decent job no matter how hard they try.

It would be one thing if the stock market was soaring because the U.S. economy was thriving.

But we all know that is not true.

So that means the current stock market mania that we are witnessing is artificial.

How long will it last?

Give us your opinion by posting a comment below…

Most People Cannot Even Imagine That An Economic Collapse Is Coming

Thinking - Public DomainThe idea that the United States is on the brink of a horrifying economic crash is absolutely inconceivable to most Americans.  After all, the economy has been relatively stable for quite a few years and the stock market continues to surge to new heights.  On Friday, the Dow and the S&P 500 both closed at brand new all-time record highs.  For the year, the S&P 500 is now up 9 percent and the Nasdaq is now up close to 11 percent.  And American consumers are getting ready to spend more than 600 billion dollars this Christmas season.  That is an amount of money that is larger than the entire economy of Sweden.  So how in the world can anyone be talking about economic collapse?  Yes, many will concede, we had a few bumps in the road back in 2008 but things have pretty much gotten back to normal since then.  Why be concerned about economic collapse when there is so much stability all around us?

Unfortunately, this brief period of stability that we have been enjoying is just an illusion.

The fundamental problems that caused the financial crisis of 2008 have not been fixed.  In fact, most of our long-term economic problems have gotten even worse.

But most Americans have such short attention spans these days.  In a world where we are accustomed to getting everything instantly, news cycles only last for 48 hours and 2008 might as well be an eternity ago.

In the United States today, our entire economic system is based on debt.

Without debt, very little economic activity happens.  We need mortgages to buy our homes, we need auto loans to buy our vehicles and we need our credit cards to do our shopping during the holiday season.

So where does all of that debt come from?

It comes from the banks.

In particular, the “too big to fail banks” are the heart of this debt-based system.

Do you have a mortgage, an auto loan or a credit card from one of these “too big to fail” institutions?  A very large percentage of the people that will read this article do.

And a lot of people might not like to hear this, but without those banks we essentially do not have an economy.

When Lehman Brothers collapsed in 2008, it almost resulted in the meltdown of our entire system.  The stock market collapsed and we experienced an absolutely wicked credit crunch.

Unfortunately, that was just a small preview of what is coming.

Even though a few prominent “experts” such as New York Times columnist Paul Krugman have declared that the “too big to fail” problem is “over”, the truth is that it is now a bigger crisis than ever before.

Compared to five years ago, the four largest banks in the country are now almost 40 percent larger.  The following numbers come from a recent article in the Los Angeles Times

Just before the financial crisis hit, Wells Fargo & Co. had $609 billion in assets. Now it has $1.4 trillion. Bank of America Corp. had $1.7 trillion in assets. That’s up to $2.1 trillion.

And the assets of JPMorgan Chase & Co., the nation’s biggest bank, have ballooned to $2.4 trillion from $1.8 trillion.

At the same time that those banks have been getting bigger, 1,400 smaller banks have completely disappeared from the banking industry.

That means that we are now more dependent on these gigantic banks than ever.

At this point, the five largest banks account for 42 percent of all loans in the United States, and the six largest banks account for 67 percent of all assets in our financial system.

If someone came along and zapped those banks out of existence, our economy would totally collapse overnight.

So the health of this handful of immensely powerful banking institutions is absolutely critical to our economy.

Unfortunately, these banks have become deeply addicted to gambling.

Have you ever known people that allowed their lives to be destroyed by addictions that they could never shake?

Well, that is what is happening to these banks.  They have transformed Wall Street into the largest casino in the history of the world.  Most of the time, their bets pay off and they make lots of money.

But as we saw back in 2008, when they miscalculate things can fall apart very rapidly.

The bets that I am most concerned about are known as “derivatives“.  In essence, they are bets about what will or will not happen in the future.  The big banks use very sophisticated algorithms that are supposed to help them be on the winning side of these bets the vast majority of the time, but these algorithms are not perfect.  The reason these algorithms are not perfect is because they are based on assumptions, and those assumptions come from people.  They might be really smart people, but they are still just people.

If things stay fairly stable like they have the past few years, the algorithms tend to work very well.

But if there is a “black swan event” such as a major stock market crash, a collapse of European or Asian banks, a historic shift in interest rates, an Ebola pandemic, a horrific natural disaster or a massive EMP blast is unleashed by the sun, everything can be suddenly thrown out of balance.

Acrobat Nik Wallenda has been making headlines all over the world for crossing vast distances on a high-wire without a safety net.  Well, that is essentially what our “too big to fail” banks are doing every single day.  With each passing year, these banks have become even more reckless, and so far there have not been any serious consequences.

But without a doubt, someday there will be.

What would you say about a bookie that took $200,000 in bets but that only had $10,000 to cover those bets?

You would certainly call that bookie a fool.

But that is what our big banks are doing.

Right now, JPMorgan Chase has more than 67 trillion dollars in exposure to derivatives but it only has 2.5 trillion dollars in assets.

Right now, Citibank has nearly 60 trillion dollars in exposure to derivatives but it only has 1.9 trillion dollars in assets.

Right now, Goldman Sachs has more than 54 trillion dollars in exposure to derivatives but it has less than a trillion dollars in assets.

Right now, Bank of America has more than 54 trillion dollars in exposure to derivatives but it only has 2.2 trillion dollars in assets.

Right now, Morgan Stanley has more than 44 trillion dollars in exposure to derivatives but it has less than a trillion dollars in assets.

Most people have absolutely no idea how incredibly vulnerable our financial system really is.

The truth is that these “too big to fail” banks could collapse at any time.

And when they fail, our economy will fail too.

So let us hope and pray that this brief period of false stability lasts for as long as possible.

Because when it ends, all hell is going to break loose.

If A Few Ebola Cases Can Make The Stock Market Crash This Much, What Would A Full-Blown Pandemic Mean?

Stock Market Crash Ebola - Public DomainIs Ebola going to cause another of the massive October stock market crashes that Wall Street is famous for?  At one point on Wednesday, the Dow was down a staggering 460 points.  It ultimately closed down just 173 points, but this was the fifth day in a row that the Dow has declined.  And of course Ebola is one of the primary things that is being blamed for this stunning stock market drop.  Since September 19th, we have seen the S&P 500 fall about 7 percent and the Nasdaq fall nearly 10 percent.  The VIX (the most important measure of volatility on Wall Street) shot up an astounding 22 percent on Wednesday.  So many of the ominous signs for the markets that I wrote about on Tuesday are now even worse.  If a handful of Ebola cases in the United States can cause this much panic in the financial world, what would a full-blown pandemic look like?

Of course Ebola is not the only reason why stocks are declining.  Just look at what is happening over in Europe.  The European Stoxx 600 index is already down a whopping 11.4 percent from the high that it hit just 18 days ago.  That is officially considered to be “correction” territory.

And Greece experienced a full-blown stock market collapse on Wednesday

As if the world didn’t have enough to be worried about (ISIS, Ebola, slowing China, Ukraine, slowing Germany, Fed tightening, etc.) now look what’s back: Greece. And in a big way.

The stock market is down over 9% on Wednesday, which is about as big as crashes come.

And the banks are getting absolutely smashed.

In general, markets tend to fall faster than they rise.

When there is a sudden downturn, the price action can be violent.  And just like we saw back in 2008, financial stocks are leading the way.  Just check out what happened to some of the biggest banks in America before the final bell sounded…

Volume leader Bank of America, down 5%, Citigroup, off 5.5%, and JP Morgan, down 4.6%, were particularly hard hit.

And thanks to Ebola fears, airline stocks plummeted as well

Airline stocks were roiled by the prospects of curtailed travel due to the spreading Ebola virus. United Continental fell 4% and American Airlines was off 4.3%. Among tech stocks, Intel lost 3.3%. Apple fell 1.7% and Microsoft slipped 2.3%.

An increasing number of voices are concerned that we could be on the verge of a repeat of what happened back in 2008.

For example, Professor Steve Keen, the head of Economics, History & Politics at Kingston University in London, wrote the following in a piece for CNN entitled “Brace yourself for another financial crash“…

My acceleration indicator has been flagging that the stock market was due for a fall since mid-2013.

It’s a tribute to the power of the Fed’s Quantitative Easing that the market continued to defy the gravity of decelerating debt for so long. QE was really a program to inflate asset prices since, as my colleague Michael Hudson puts it, “the Fed’s helicopter money fell on Wall Street, not Main Street”.

But with QE being unwound, the stock market is now back under the control of the not so tender mercies of excessive private debt.

So welcome to the New Crisis — same as the Old Crisis. The roller coaster ride is likely to continue.

Others are even more pessimistic.  For example, just check out what Daniel Ameduri of Future Money Trends recently told his readers

“If it drops below 15,000 points I would suggest people start buying food and ammo, because this depression is about to turn nasty.”

However, keep in mind that not that much has really changed from a month or two ago.

Yes, we now have had three confirmed cases of Ebola in the United States, but this could be just the beginning.

At first, the fear of Ebola will be worse than the disease.

But if a worst-case scenario does develop in the United States where hundreds of thousands of people are getting the virus, the fear such a pandemic will create will be off the charts.

In the midst of a full-blown Ebola pandemic, we wouldn’t just be talking about a 10 percent, 20 percent or 30 percent stock market decline.

Rather, we would be talking about the greatest stock market collapse in the history of stock market collapses.  In essence, there would not be much of a market at all at that point.

And if Ebola does start spreading wildly in this country, we would have a credit crunch that would make 2008 look like a Sunday picnic.

During times of extraordinary fear, financial institutions do not want to lend money to each other or to consumers.  But our economy is entirely based on debt.  If credit were to stop flowing, we would essentially not have an economy.

That is why we need to pray that this Ebola crisis stops here.  But thanks to the incompetence of Barack Obama and the CDC, there has been a series of very grave errors in trying to contain this disease.  This display of incompetence would be absolutely hilarious if we weren’t talking about a disease that could potentially kill millions of us.

Let us hope for the best, but let us also prepare for the worst.  That means stocking up on the food and supplies that you will need to stay isolated for an extended period of time.  As we have seen so many times in the past, basic essentials fly off of store shelves during any type of an emergency.  During an extended Ebola pandemic, those essentials would be in very short supply and prices on the basics would absolutely skyrocket.  Those that have taken the time to get prepared now will be way ahead of the game.

And if there were dozens or hundreds of people in your community that were contagious, you would definitely not want to go to a grocery store or anywhere else where large numbers of people circulate.

The key during any major pandemic is to keep yourself and your family isolated from the virus.  This is basic common sense, but it is something that Barack Obama does not seem to understand.  As I write this, he still has not done anything to restrict air travel between the United States and West Africa.  Hopefully this very foolish decision will not result in scores of dead Americans.

What In The World Is Happening To The Nasdaq?

NASDAQ MarketSite TV studio - Photo by Luis Villa del CampoAll of a sudden, the Nasdaq is absolutely tanking.  On Monday, it fell more than 1 percent after dropping 3.6 percent on Thursday and Friday combined.  At this point, the Nasdaq is off to the worst start to a year that we have seen since 2008, and we all remember what happened back then.  So why is this happening?  In recent years, the Nasdaq has been ground zero for “dotcom bubble 2.0”.  The hottest stocks in the entire world are on the Nasdaq – we are talking about stocks like Yahoo, Netflix, Apple, Tesla, Google and Facebook.  Those stocks have gone to absolutely incredible heights, but now they are starting to fall.  Some are blaming insider selling, and without a doubt the “smart money” is starting to flee the stock market.  Just check out this chart.  Others are blaming low expectations for first-quarter earnings or the tapering of quantitative easing by the Federal Reserve.  But whatever is causing this decline, it is starting to get alarming.  The Nasdaq just experienced its largest three day fall since November 2011.

No stock can resist gravity forever.  What goes up must eventually come down.  This is especially true for stock prices that become grotesquely distorted.

On Wall Street, a price to earnings ratio of 20 to 25 is usually considered fairly normal.  In recent years, the price to earnings ratios for many of these “hot tech stocks” have gone way, way beyond that.  For example, posted below is a screen capture from Bloomberg TV that was featured in a recent Zero Hedge article

Zero Hedge

There is no way in the world that such valuations are justified.

We have been living in another dotcom bubble, and it was inevitable that it was going to burst at some point.

The following is how one financial industry insider described the carnage that we have seen on the Nasdaq over the past few days…

Gary Kaltbaum, president of money-management firm Kaltbaum Capital Management, describes the carnage of once high-flying “growth” names in the Nasdaq composite, that have come crashing down to earth: “The best we can describe what we have been recently seeing in ‘growth-land’ is a 50-car pileup,” Kaltbaum told clients in a morning research note. “Call them what you want … risk areas, growth stocks, froth areas … they are melting away.

And of course it isn’t just the Nasdaq that has been seeing declines over the past few days.  On Monday, some of the biggest names on the Dow also fell precipitiously

Visa, Goldman Sachs and Boeing are among the biggest drags on the Dow Monday, falling 2.1%, 2.9% and 1.4% respectively. Weakness in these stocks is especially problematic since the Dow gives greatest weight to the stocks with the highest per-share prices. And at $203.41, $158.56 and $125.59 respectively, Visa, Goldman and Boeing are the stocks that really matter to the measure.

And the trouble in these stocks isn’t just today. So far this year, Visa is down 8.7%, Goldman is off 10.5% and Boeing is down 8.0%.

This recent decline has many analysts groping for answers.

Some believe that it is simply a “rotation” as investors leave growth stocks that have become overvalued and move into safer, more traditional stocks.

Others are pointing their fingers at the Federal Reserve

Peter Boockvar, chief market strategist at Lindsey Group, believes it’s all about the Fed. “I’m still amazed at the complacency with the Fed taper, and a lot of people still don’t think it’s a big deal,” he said. “I just don’t think it’s a coincidence that the high-fliers are getting popped when the Fed is half way done with QE. We’ve got tightening smack in front of your face with the taper.”

In fact, some believe that the really big stock market decline will happen later this year when the Fed starts to wrap up quantitative easing completely

Once the Fed begins to truly reduce its massive bond buying program later this year, markets could see a quarter of their value wiped off the books, a private equity pro told CNBC on Friday.

Jay Jordan, founder of the Jordan Company, issued the dire warning during an interview on CNBC’s “Squawk Box,” saying a 25 percent drop could extend to all asset classes. He blames the monetary policies of former Fed chair Ben Bernanke for artificially inflating asset prices through super-low interest rates.

Yet others point to the fact that we are now moving into earnings season, and it is being projected that corporate earnings will come in at very poor levels.  In fact, it is being estimated that overall earnings for companies in the S&P 500 for the first quarter will be down 1.2 percent.

So what should we expect to see next?

Whether it happens this month or not, at some point a massive stock market correction is coming.  In recent years, the financial markets have become completely and totally divorced from economic reality, and that is a state of affairs that cannot last indefinitely.

Many have compared the current state of affairs to 2008, but to me what is happening right now is eerily reminiscent of 2007.  The Dow soared to record heights quite a few times that year, but there were constant rumblings of economic trouble in the background.  Stocks began to drop steadily late in the year, and 2008 ultimately turned out to be an utter bloodbath.

I believe that what is happening right now is setting the stage for another financial bloodbath.  I truly believe that we will look back on this two year time period and regard it as a major “turning point” for America.

And as I have written about previously, we are in far worse shape as a nation than we were back in 2008.  We have far more debt, the “too big to fail banks” have a much larger share of the banking industry, the derivatives bubble has gotten completely and totally out of control, and our overall economy is far weaker than it was back then.

In other words, we are now even more vulnerable.  When the next great financial crisis strikes us, it is going to be absolutely crippling.

Now is not the time to get complacent.

Now is the time to get prepared, because time is running out.