Foreigners Are Dumping U.S. Debt At A Record Pace And Our $20 Trillion National Debt Is Poised To Become A Major Crisis

Dollar Spiral - Public DomainWhile most of the country has been focused on the inauguration of Donald Trump, a very real crisis has been brewing behind the scenes. Foreigners are dumping U.S. debt at a faster rate than we have ever seen before, and U.S. Treasury yields have been rising. This is potentially a massive problem, because our entire debt-fueled standard of living is dependent on foreigners lending us gigantic mountains of money at ultra-low interest rates. If the average rate of interest on U.S. government debt just got back to 5 percent, which would still be below the long-term average, we would be paying out about a trillion dollars a year just in interest on the national debt. If foreigners keep dumping our debt and if Treasury yields keep climbing, a major financial implosion of historic proportions is absolutely guaranteed within the next four years.

One of the most significant aspects of the “Obama legacy” is the appalling mountain of debt that he has left behind. As I write this article, the U.S. national debt is sitting at 19.944 trillion dollars. During Obama’s eight years, a staggering 9.3 trillion dollars was added to the national debt. When you break that number down, it comes to more than a hundred million dollars every single hour of every single day while Obama was living in the White House. In just two terms, Obama added almost as much to the national debt as all of the other presidents before him combined.

What Obama and the members of Congress that cooperated with him have done to future generations of Americans is beyond criminal.

Unfortunately, hardly anyone is talking about this right now, but the consequences are about to start catching up with us in a major way.

The only possible way that our game of “borrow, spend and stick future generations with the bill” can continue is if the rest of the world participates. In other words, we need them to continue to buy our debt.

Unfortunately for us, a major shift is now taking place. According to Zero Hedge, the most recent numbers that we have show foreigners dumping more than 400 million dollars of U.S. debt over the past 12 months…

The wholesale liquidation of US Treasuries continued in November, when according to the just released TIC data, foreign central banks sold another $936 million in US paper in November 2016, which due to an offset of $892 million in buying one year ago, means that for the 12 month period ended November, foreign central banks have now sold a new all time high of $405 million in the past 12 months, up from a record $403 million in LTM sales as of one month ago.

This isn’t a catastrophic emergency just yet, but if we continue down this road we will eventually get there. The only way that the U.S. government can continue on with business as usual is if it can continue to borrow billions upon billions of dollars at ultra-low interest rates. Now that Treasury yields are rising, some people are beginning to get quite nervous

As we pointed out one month ago, what has become increasingly obvious is that both foreign central banks, sovereign wealth funds, reserve managers, and virtually every other official institution in possession of US paper, is liquidating their holdings at a disturbing pace, something which in light of the recent surge in yields to over 2 year highs, appears to have been a prudent move.

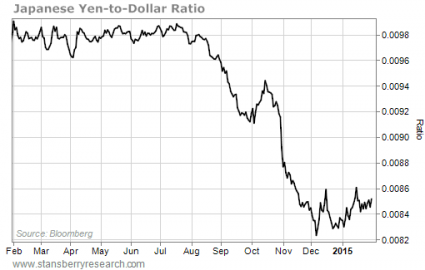
In some cases, like China, this is to offset devaluation pressure; in others such as Saudi Arabia and other petroleum exporting nations, it is to provide the funds needed to offset the drop in the petrodollar, and to backstop the country’s soaring budget deficit. In all cases, it may suggest concerns about a spike in future debt issuance by the US, especially now under the pro-fiscal stimulus Trump administration.

Someday historians are going to look back in horror at what took place during the Obama years.

The amount that was added to the national debt during his years comes to “approximately $75,129 for every person in the United States who had a full-time job in December”. There is no possible justification for this. But because there haven’t been any catastrophic consequences so far, most people assume that this theft from future generations of Americans must be okay.

In a previous article, I explained that government debt greatly stimulates the economy. If we had not borrowed and spent 9.3 trillion dollars over the past eight years, we would be in the worst economic depression in U.S. history right now.

But most people don’t understand this. They don’t get the fact that we are living way, way above our means. And they also don’t get the fact that the only way that Donald Trump can keep the party going is to borrow and spend just like Obama was doing.

And even with all of Obama’s recklessness, he was still the only president in all of U.S. history not to have a single year when U.S. GDP grew by at least three percent. The following comes from the Hill

Despite the trillions of dollars in government spending pumped into the economy every year under Obama, America has never once enjoyed an annual GDP growth rate at 3 percent or higher, making Obama the least successful president—at least when it comes to economics—in modern history.

A historically sluggish GDP isn’t the only concern worth mentioning. Under Obama’s tenure, average annual food stamp enrollment has risen by more than 15 million (compared to 2008). The home ownership rate is the lowest it has been since 1995, the earliest year provided in the U.S. Census Bureau’s most recent report. The Bureau of Labor Statistics reports more than 590,000 Americans say they are not in the labor force because they are discouraged, a figure that’s 26 percent higher than even the worst annual average under George W. Bush. Additionally, the employment-population ratio has been continuously below the 60-percent threshold under Obama; the last time it was this low was 1985.

Now that Donald Trump is president, he is going to have some very hard choices in front of him.

If Donald Trump and the Republicans stop borrowing and spending so much money, the economy will immediately start suffering.

But if they do continue down the same path that Obama put us on, it is a recipe for national suicide.

So either we take our medicine now, or we risk completely destroying the bright future that our children and grandchildren were supposed to enjoy.

Wake up America, because time is running out.

In 1 Out Of Every 5 American Families, Nobody Has A Job

Family Silhouette - Public Domain 2If nobody is working in one out of every five U.S. families, then how in the world can the unemployment rate be close to 5 percent as the Obama administration keeps insisting? The truth, of course, is that the U.S. economy is in far worse condition than we are being told. Last week, I discussed the fact that the Federal Reserve has found that 47 percent of all Americans would not be able to come up with $400 for an unexpected visit to the emergency room without borrowing it or selling something. But Barack Obama and his minions never bring up that number. Nor do they ever bring up the fact that 20 percent of all families in America are completely unemployed. The following comes directly from the Bureau of Labor Statistics

In 2015, the share of families with an employed member was 80.3 percent, up by 0.2 percentage point from 2014. The likelihood of having an employed family member rose in 2015 for Black families (from 76.4 percent to 77.7 percent) and for Hispanic families (from 85.9 percent to 86.4 percent). The likelihood for White and Asian families showed little or no change (80.1 percent and 88.6 percent, respectively).

For purposes of this study, families “are classified either as married-couple families or as families maintained by women or men without spouses present” and they include households without children as well as children under the age of 18.

Digging into the numbers, we find that there were a total of 81,410,000 families in America during the 2015 calendar year.

Of that total, 16,060,000 families did not have a single member employed.

So that means that in 19.7 percent of all families in the United States, nobody has a job.

And of course there are lots more families that are “partially employed”. In other words, maybe the wife has a job but the husband does not.

So based on these numbers, it would appear to me that the true rate of unemployment in this country is vastly higher than 5 percent, and John Williams of shadowstats.com agrees with me. According to his calculations, the broadest measure of unemployment in the U.S. would actually be sitting at 22.9 percent if honest numbers were being used.

But let’s not just focus on where we are.

Let’s take a look at where we are going.

According to Challenger, Gray & Christmas, job cut announcements by big companies in the United States were up 32 percent during the first quarter of 2016 compared to the first quarter of 2015, and it appears that the job losses are going to continue to mount as we roll into the second quarter. For instance, late last week Intel announced that it is going to be laying off 12,000 workers

As it navigates its path into the future, Intel, the 47-year-old corporation best known for making microprocessor chips that power personal computers, has announced significant changes to its business.

On Tuesday, Intel’s CEO Brian Krzanich said in a letter to employees that the company over the next year will cut its 107,300-person global workforce by 12,000 people, or 11 percent.

Those are good middle class jobs, and they are exactly the kind of jobs that we cannot afford to be losing.

Meanwhile, the “retail apocalypse” appears to be accelerating once again.

Bloomberg is reporting that teen clothing chain Aeropostale is preparing to file for bankruptcy.  Aeropostale currently operates more than 800 stores across the nation, and it is unclear if any of them will be able to stay open as this process plays out. But of course it isn’t just Aeropostale that has gone bankrupt lately. Here are a few more examples of major retailers that have recently filed for bankruptcy

April 16, 2016: Vestis Retail Group, the operator of sporting goods retailers Eastern Mountain Sports (camping, hiking, skiing, adventure sports), Bob’s Stores (family clothing and shoes), and Sport Chalet (general sporting goods), filed for Chapter 11 bankruptcy. It will close all 56 stores and stop online sales.

In the filing, it blamed the going-out-of-business sales at “certain Sports Authority locations,” plus the weather, which had been too warm, and trouble with switching to a new software platform. It’s owned by private equity firm Versa Capital Management LLC.

April 7, 2016: Pacific Sunwear of California, clothing retailer with nearly 600 stores and derailed ambitions of skate-and-surf cool, filed for Chapter 11 bankruptcy. PE firm Golden Gate Capital, a lender to the company, agreed to convert over 65% of its loan into equity of the reorganized company and add another $20 million in financing. Wells Fargo agreed to provide $100 million of debtor-in-possession financing.

March 2, 2016: Sports Authority filed for Chapter 11 bankruptcy. It said it would close 140 of its 450 stores, including all stores in Texas.

Just because the stock market has been doing well in recent weeks does not mean that the crisis has passed.

In fact, many experts believe that the crisis of 2016 is just getting started.  Albert Edwards of Societe Generale is one of them

But what I do know is when in the last few weeks I have heard that Janet Yellen sees no bubble in the US, when Ben Bernanke hones and restates his helicopter money speech, and when Mario Draghi says that the ECB’s policy of printing money and negative interest rates was working, I feel utterly depressed (I could also quote similar nonsense from Japan, the UK and China). I have not one scintilla of doubt that these central bankers will destroy the enfeebled world economy with their clumsy interventions and that political chaos will be the ugly result. The only people who will benefit are not investors, but anarchists who will embrace with delight the resulting chaos these policies will bring!

All over the world, the underlying economic fundamentals continue to deteriorate. Here in the U.S., retail sales have been extremely disappointing, total business sales have been steadily falling, corporate revenues and corporate profits continue to plunge, and corporate debt defaults have soared to their highest level since the last financial crisis.

All of these numbers are screaming that a major economic downturn is here, and with each passing week things look even more ominous for the second half of 2016.

*About the author: Michael Snyder is the founder and publisher of The Economic Collapse Blog. Michael’s controversial new book about Bible prophecy entitled “The Rapture Verdict” is available in paperback and for the Kindle on Amazon.com.*

47 Percent Of Americans Cannot Even Come Up With $400 To Cover An Emergency Room Visit

One Dollar Bill - Public DomainIf you had to make a sudden visit to the emergency room, would you have enough money to pay for it without selling something or borrowing the funds from somewhere?  Most Americans may not realize this, but this is something that the Federal Reserve has actually been tracking for several years now.  And according to the Fed, an astounding 47 percent of all Americans could not come up with $400 to pay for an emergency room visit without borrowing it or selling something.  Various surveys that I have talked about in the past have found that more than 60 percent of all Americans are living to paycheck to paycheck, but I didn’t realize that things were quite this bad for about half the country.  If you can’t even come up with $400 for an unexpected emergency room visit, then you are just surviving from month to month by the skin of your teeth.  Unfortunately, about half of us are currently in that situation.

Earlier today someone pointed me toward an excellent article in The Atlantic that discussed this, and I have to admit that The Atlantic is one of the last remaining bastions of old school excellence in journalism that you will find in the mainstream media.  Of course I don’t see eye to eye with them on a lot of things philosophically, but there are some really hard working journalists over there.

The article where I found the 47 percent figure comes from The Atlantic, and it is entitled “The Secret Shame of Middle-Class Americans“.  It was authored by Neal Gabler, and he says that he can identify with the 47 percent of Americans that don’t have $400 for an unexpected emergency room visit because he is one of them

I know what it is like to have to juggle creditors to make it through a week. I know what it is like to have to swallow my pride and constantly dun people to pay me so that I can pay others. I know what it is like to have liens slapped on me and to have my bank account levied by creditors. I know what it is like to be down to my last $5—literally—while I wait for a paycheck to arrive, and I know what it is like to subsist for days on a diet of eggs. I know what it is like to dread going to the mailbox, because there will always be new bills to pay but seldom a check with which to pay them. I know what it is like to have to tell my daughter that I didn’t know if I would be able to pay for her wedding; it all depended on whether something good happened. And I know what it is like to have to borrow money from my adult daughters because my wife and I ran out of heating oil.

To me, this is yet more evidence that the middle class in America is dying.

Last year, it was reported that middle class Americans make up a minority of the population for the very first time in our history.

But back in 1971, 61 percent of all Americans lived in middle class households.

So what happened?

Well, the big corporations started shipping millions of good paying manufacturing jobs overseas.  Millions of other good paying jobs were replaced by technology, and the competition for the good jobs that remained became extremely intense.

During the good times, the U.S. economy still created new jobs, but most of those jobs were low paying service jobs.

At this point, a majority of American workers have jobs that would be considered low paying.  In fact, 51 percent of all American workers make less than $30,000 a year according to the Social Security Administration.

And once you account for inflation, the truth is that our incomes have been going down for years.  According to a study that was released by Pew Charitable Trusts, median household income in the United States decreased by 13 percent between 2004 and 2014.

That isn’t “progress” any way that you slice it.

If you go all the way back to 1970, the middle class took home approximately 62 percent of all income in the United States.

Today, that number has fallen to just 43 percent.

So the fact that 47 percent of Americans can’t even pay for an unexpected emergency room visit is not exactly a surprise.  To be honest, a whole host of other surveys have come up with similar numbers.  Here is more from Neal Gabler

A 2014 Bankrate survey, echoing the Fed’s data, found that only 38 percent of Americans would cover a $1,000 emergency-room visit or $500 car repair with money they’d saved. Two reports published last year by the Pew Charitable Trusts found, respectively, that 55 percent of households didn’t have enough liquid savings to replace a month’s worth of lost income, and that of the 56 percent of people who said they’d worried about their finances in the previous year, 71 percent were concerned about having enough money to cover everyday expenses.

What all of these numbers tell us is that the middle class is disappearing.  I tend to compare it to a game of really bizarre musical chairs.  With each passing month more chairs are being pulled out of the circle, and those members of the middle class that haven’t fallen into poverty yet are just hoping that a chair will still be there for them when the music stops.

Even during the “Obama recovery”, we have seen poverty in America absolutely explode.  In fact, some brand new numbers just came out that are quite startling.  The following comes from another author for The Atlantic named Gillian B. White

Recently, the Brookings Institution published a report looking at the same idea but giving it a different name. The paper, builds on research from the British economist William Beveridge, who in 1942 proposed five types of poverty: squalor, ignorance, want, idleness, and disease. In modern terms, these could be defined as poverty related to housing, education, income, employment, and healthcare, respectively. Analyzing the 2014 American Community Survey, the paper’s co-authors, Richard Reeves, Edward Rodrigue, and Elizabeth Kneebone, found that half of Americans experience at least one of these types of poverty, and around 25 percent suffer from at least two.

To underscore this point, let me just run five quick facts about the growth of poverty in this country by you…

The number of Americans that are living in concentrated areas of high poverty has doubled since the year 2000.

In 2007, about one out of every eight children in America was on food stamps. Today, that number is one out of every five.

46 million Americans use food banks each year, and lines start forming at some U.S. food banks as early as 6:30 in the morning because people want to get something before the food supplies run out.

The number of homeless children in the U.S. has increased by 60 percent over the past six years.

According to Poverty USA, 1.6 million American children slept in a homeless shelter or some other form of emergency housing last year.

That last number really gets me every time.

How can “the wealthiest and most powerful nation on the planet” have more than a million homeless children?

This is one of the reasons why I hammer on our ongoing economic collapse over and over and over.  It is affecting real families with real children that have real hopes and real dreams.

This is not the way our country is supposed to work.

It is supposed to be “the land of opportunity”.

It is supposed to be a place where anyone can live “the American Dream”.

But instead it has become an economic wasteland where the largest and most prosperous middle class in the history of the world is being systematically eviscerated.

So no, the U.S. economy is not doing “just fine” – anyone that tries to tell you that lie is simply peddling fiction.

*About the author: Michael Snyder is the founder and publisher of The Economic Collapse Blog. Michael’s controversial new book about Bible prophecy entitled “The Rapture Verdict” is available in paperback and for the Kindle on Amazon.com.*

Guess What Happened The Last Time The U.S. Dollar Skyrocketed In Value Like This?…

Question Ball - Public DomainOver the past decade, there has been only one other time when the value of the U.S. dollar has increased by so much in such a short period of time.  That was in mid-2008 – just before the greatest financial crash since the Great Depression.  A surging U.S. dollar also greatly contributed to the Latin American debt crisis of the early 1980s and the Asian financial crisis of 1997.  Today, the globe is more interconnected than ever.  Most global trade is conducted in U.S. dollars, and much of the borrowing done by emerging markets all over the planet is denominated in U.S. dollars.  When the U.S. dollar goes up dramatically, this can put a tremendous amount of financial stress on economies all around the world.  It also has the potential to greatly threaten the stability of the 65 trillion dollars in derivatives that are directly tied to the value of the U.S. dollar.  The global financial system is more vulnerable to currency movements than ever before, and history tells us that when the U.S. dollar soars the global economy tends to experience a contraction.  So the fact that the U.S. dollar has been skyrocketing lately is a very, very bad sign.

Most of the people that write about the coming economic collapse love to talk about the coming collapse of the U.S. dollar as well.

But in the initial deflationary stage of the coming financial crisis, we are likely to see the U.S. dollar actually strengthen considerably.

As I have discussed so many times before, we are going to experience deflation first, and after that deflationary phase the desperate responses by the Federal Reserve and the U.S. government to that deflation will cause the inflationary panic that so many have written about.

Yes, someday the U.S. dollar will essentially be toilet paper.  But that is not in our immediate future.  What is in our immediate future is a “flight to safety” that will push the surging U.S. dollar even higher.

This is what we witnessed in 2008, and this is happening once again right now.

Just look at the chart that I have posted below.  You can see the the U.S. dollar moved upward dramatically relative to other currencies starting in mid-2008.  And toward the end of the chart you can see that the U.S. dollar is now experiencing a similar spike…

Dollar Index 2015

At the moment, almost every major currency in the world is falling relative to the U.S. dollar.

For example, this next chart shows what the euro is doing relative to the dollar.  As you can see, the euro is in the midst of a stunning decline…

Euro U.S. Dollar

Instead of focusing on the U.S. dollar, those that are looking for a harbinger of the coming financial crisis should be watching the euro.  As I discussed yesterday, analysts are telling us that if Greece leaves the eurozone the EUR/USD could fall all the way down to 0.90.  If that happens, the chart above will soon resemble a waterfall.

And of course it isn’t just the euro that is plummeting.  The yen has been crashing as well.  The following chart was recently posted on the Crux

Yen Dollar from the Crux

Unfortunately, most Americans have absolutely no idea how important all of this is.  In recent years, growing economies all over the world have borrowed gigantic piles of very cheap U.S. dollars.  But now they are faced with the prospect of repaying those debts and making interest payments using much more expensive U.S. dollars.

Investors are starting to get nervous.  At one time, investors couldn’t wait to pour money into emerging markets, but now this process is beginning to reverse.  If this turns into a panic, we are going to have one giant financial mess on our hands.

The truth is that the value of the U.S. dollar is of great importance to every nation on the face of the Earth.  The following comes from U.S. News & World Report

In the early ’80s, a bullish U.S. dollar contributed to the Latin American debt crisis, and also impacted the Asian Tiger crisis in the late ’90s. Emerging markets typically have higher growth, but carry much higher risk to investors. When the economies are doing well, foreign investors will lend money to emerging market countries by purchasing their bonds.

They also deposit money in foreign banks, which facilitates higher lending. The reason for this is simple: Bond payments and interest rates in emerging markets are much higher than in the U.S. Why deposit cash in the U.S. and earn 0.25 percent, when you could earn 6 percent in Indonesia? With the dollar strengthening, the interest payments on any bond denominated in U.S. dollars becomes more expensive.

Additionally, the deposit in the Indonesian bank may still be earning 6 percent, but that is on Indonesian rupiahs. After converting the rupiahs to U.S. dollars, the extra interest doesn’t offset the loss from the exchange. As investors get nervous, the higher interest on emerging market debt and deposits becomes less alluring, and they flee to safety. It may start slowly, but history tells us it can quickly spiral out of control.

Over the past few months, I have been repeatedly stressing that so many of the signs that we witnessed just prior to previous financial crashes are happening again.

Now you can add the skyrocketing U.S. dollar to that list.

If you have not seen my previous articles where I have discussed these things, here are some places to get started…

Guess What Happened The Last Time The Price Of Oil Crashed Like This?…

Not Just Oil: Guess What Happened The Last Time Commodity Prices Crashed Like This?…

10 Key Events That Preceded The Last Financial Crisis That Are Happening Again RIGHT NOW

The warnings signs are really starting to pile up.

When we look back at past financial crashes, there are recognizable patterns that can be identified.

Anyone with half a brain should be able to see that a large number of those patterns are unfolding once again right before our eyes.

Unfortunately, most people in this world end up believing exactly what they want to believe.

No matter how much evidence you show them, they will not accept the truth until it is too late.

The U.S. Government Is Borrowing About 8 Trillion Dollars A Year

National Debt - Public DomainI know that headline sounds completely outrageous.  But it is actually true.  The U.S. government is borrowing about 8 trillion dollars a year, and you are about to see the hard numbers that prove this.  When discussing the national debt, most people tend to only focus on the amount that it increases each 12 months.  And as I wrote about recently, the U.S. national debt has increased by more than a trillion dollars in fiscal year 2014.  But that does not count the huge amounts of U.S. Treasury securities that the federal government must redeem each year.  When these debt instruments hit their maturity date, the U.S. government must pay them off.  This is done by borrowing more money to pay off the previous debts.  In fiscal year 2013, redemptions of U.S. Treasury securities totaled $7,546,726,000,000 and new debt totaling $8,323,949,000,000 was issued.  The final numbers for fiscal year 2014 are likely to be significantly higher than that.

So why does so much government debt come due each year?

Well, in recent years government officials figured out that they could save a lot of money on interest payments by borrowing over shorter time frames.  For example, it costs the government far more to borrow money for 10 years than it does for 1 year.  So a strategy was hatched to borrow money for very short periods of time and to keep “rolling it over” again and again and again.

This strategy has indeed saved the federal government hundreds of billions of dollars in interest payments, but it has also created a situation where the federal government must borrow about 8 trillion dollars a year just to keep up with the game.

So what happens when the rest of the world decides that it does not want to loan us 8 trillion dollars a year at ultra-low interest rates?

Well, the game will be over and we will be in a massive amount of trouble.

I am about to share with you some numbers that were originally reported by CNS News.  As you can see, far more debt is being redeemed and issued today than back during the middle part of the last decade…

2013

Redeemed: $7,546,726,000,000

Issued: $8,323,949,000,000

Increase: $777,223,000,000

2012

Redeemed: $6,804,956,000,000

Issued: $7,924,651,000,000

Increase: $1,119,695,000,000

2011

Redeemed: $7,026,617,000,000

Issued: $8,078,266,000,000

Increase: $1,051,649,000,000

2010

Redeemed: $7,206,965,000,000

Issued: $8,649,171,000,000

Increase: $1,442,206,000,000

2009

Redeemed: $7,306,512,000,000

Issued: $9,027,399,000,000

Increase: $1,720,887,000,000

2008

Redeemed: $4,898,607,000,000

Issued: $5,580,644,000,000

Increase: $682,037,000,000

2007

Redeemed: $4,402,395,000,000

Issued: $4,532,698,000,000

Increase: $130,303,000,000

2006

Redeemed: $4,297,869,000,000

Issued: $4,459,341,000,000

Increase: $161,472,000,000

The only way that this game can continue is if the U.S. government can continue to borrow gigantic piles of money at ridiculously low interest rates.

And our current standard of living greatly depends on the continuation of this game.

If something comes along and rattles this Ponzi scheme, life in America could change radically almost overnight.

In the United States today, we have a heavily socialized system that hands out checks to nearly half the population.  In fact, 49 percent of all Americans live in a home that gets direct monetary benefits from the federal government each month according to the U.S. Census Bureau.  And it is hard to believe, but Americans received more than 2 trillion dollars in benefits from the federal government last year alone.  At this point, the primary function of the federal government is taking money from some people and giving it to others.  In fact, more than 70 percent of all federal spending goes to “dependence-creating programs”, and the government runs approximately 80 different “means-tested welfare programs” right now.  But the big problem is that the government is giving out far more money than it is taking in, so it has to borrow the difference.  As long as we can continue to borrow at super low interest rates, the status quo can continue.

But a Ponzi scheme like this can only last for so long.

It has been said that when the checks stop coming in, chaos will begin in the streets of America.

The looting that took place when a technical glitch caused the EBT system to go down for a short time in some areas last year and the rioting in the streets of Ferguson, Missouri this year were both small previews of what we will see in the future.

And there is no way that we will be able to “grow” our way out of this problem.

As the Baby Boomers continue to retire, the amount of money that the federal government is handing out each year is projected to absolutely skyrocket.  Just consider the following numbers…

Back in 1965, only one out of every 50 Americans was on Medicaid.  Today, more than 70 million Americans are on Medicaid, and it is being projected that Obamacare will add 16 million more Americans to the Medicaid rolls.

When Medicare was first established, we were told that it would cost about $12 billion a year by the time 1990 rolled around.  Instead, the federal government ended up spending $110 billion on the program in 1990, and the federal government spent approximately $600 billion on the program in 2013.

It is being projected that the number of Americans on Medicare will grow from 50.7 million in 2012 to 73.2 million in 2025.

At this point, Medicare is facing unfunded liabilities of more than 38 trillion dollars over the next 75 years.  That comes to approximately $328,404 for every single household in the United States.

In 1945, there were 42 workers for every retiree receiving Social Security benefits.  Today, that number has fallen to 2.5 workers, and if you eliminate all government workers, that leaves only 1.6 private sector workers for every retiree receiving Social Security benefits.

Right now, there are approximately 63 million Americans collecting Social Security benefits.  By 2035, that number is projected to soar to an astounding 91 million.

Overall, the Social Security system is facing a 134 trillion dollar shortfall over the next 75 years.

The U.S. government is facing a total of 222 trillion dollars in unfunded liabilities during the years ahead.  Social Security and Medicare make up the bulk of that.

Yes, things seem somewhat stable for the moment in America today.

But the same thing could have been said about 2007.  The stock market was soaring, the economy seemed like it was rolling right along and people were generally optimistic about the future.

Then the financial crisis of 2008 erupted and it seemed like the world was going to end.

Well, the truth is that another great crisis is rapidly approaching, and we are in far worse shape financially than we were back in 2008.

Don’t get blindsided by what is ahead.  Evidence of the coming catastrophe is all around you.

29 Incredible Facts Which Prove That Poverty In America Is Absolutely Exploding

Poverty In America - Photo by C.G.P. GreyDid you know that the number of Americans on welfare is higher than the number of Americans that have full-time jobs?  Did you know that 1.2 million public school students in the U.S. are currently homeless?  Anyone that uses the term “economic recovery” to describe what is happening in the United States today is being deeply insulting to the nearly 150 million Americans that are considered to be either “poor” or “low income” at this point.  Yes, things are great in New York City, Washington D.C. and San Francisco, but almost everywhere else economic conditions continue to steadily get worse.  The gap between the wealthy and the poor is at a level that America has never seen before, and this is beginning to create a “Robin Hood mentality” that could cause a tremendous amount of social chaos in the years ahead.  Anger at the “haves” in America continues to rise at a very alarming pace, and the “have nots” are becoming increasingly desperate.  At some point all of this anger is going to boil over, and you won’t want to be anywhere around major population centers when that happens.  Despite unprecedented borrowing by the federal government in recent years, and despite unprecedented money printing by the Federal Reserve, poverty in the United States keeps getting worse with each passing year. The following are 29 incredible facts which prove that poverty in America is absolutely exploding…

1. What can you say about a nation that has more people getting handouts from the federal government than working full-time?  According to the latest numbers from the U.S. Census Bureau, the number of people receiving means-tested welfare benefits is greater than the number of full-time workers in the United States.

2. New numbers have just been released, and they show that the number of public school students in this country that are homeless is at an all-time record high.  It is hard to believe, but right now 1.2 million students that attend public schools in America are homeless.  That number has risen by 72 percent since the start of the last recession.

3. When I was growing up, it seemed like almost everyone was from a middle class home.  But now that has all changed.  One recent study discovered that nearly half of all public students in the United States come from low income homes.

4. How can anyone deny that we are a socialist nation when half the people are getting money from the federal government each month?  According to the most recent numbers from the U.S. Census Bureau, 49.2 percent of all Americans are receiving benefits from at least one government program.

5. Signs of increasing poverty are even showing up in the wealthiest areas of the nation.  According to the New York Post, New York subways are being “overrun with homeless“.

6. According to the U.S. Census Bureau, approximately one out of every six Americans is now living in poverty.  The number of Americans living in poverty is now at a level not seen since the 1960s.

7. The gap between the rich and the poor in the United States is at an all-time record high.  The wealthy may not consider this to be much of a problem, but those at the other end of the spectrum are very aware of this.

8. The “working poor” is one of the fastest growing segments of the U.S. population.  At this point, approximately one out of every four part-time workers in America is living below the poverty line.

9. According to numbers provided by Wal-Mart, more than half of their hourly workers make less than $25,000 a year.

10. A recent Businessweek article mentioned a study that discovered that 300 employees at one Wal-Mart in Wisconsin receive a combined total of nearly a million dollars a year in public assistance…

“A decent wage is their demand—a livable wage, of all things,” said Representative George Miller (D-Calif.). The problem with companies like Wal-Mart is their “unwillingness, not their inability, to pay that wage,” he said. “They hand off the difference to taxpayers.” Miller was referring to a congressional report (PDF) released in May that calculated how much Walmart workers rely on public assistance. The study found that the 300 employees at one Supercenter in Wisconsin required some $900,000 worth of public assistance a year.

11. The stock market may be doing great (for the moment), but incomes for average Americans continue to decline.  In fact, median household income in the United States has fallen for five years in a row.

12. The quality of the jobs in America has been steadily dropping for years.  At this point, one out of every four American workers has a job that pays $10 an hour or less.

13. According to a Gallup poll that was recently released, 20.0% of all Americans did not have enough money to buy food that they or their families needed at some point over the past year.  That is just under the record of 20.4% that was set back in November 2008.

14. Young adults are particularly feeling the sting of poverty these days.  American families that have a head of household that is under the age of 30 have a poverty rate of 37 percent.

15. As I wrote about a few weeks ago, one out of every five households in the United States is on food stamps.  Back in the 1970s, about one out of every 50 Americans was on food stamps.

16. The number of Americans on food stamps now exceeds the entire population of Spain.

17. According to one calculation, the number of Americans on food stamps now exceeds the combined populations of “Alaska, Arkansas, Connecticut, Delaware, District of Columbia, Hawaii, Idaho, Iowa, Kansas, Maine, Mississippi, Montana, Nebraska, Nevada, New Hampshire, New Mexico, North Dakota, Oklahoma, Oregon, Rhode Island, South Dakota, Utah, Vermont, West Virginia, and Wyoming.”

18. We are told that we live in the “wealthiest nation” on the planet, and yet more than one out of every four children in the United States is enrolled in the food stamp program.

19. The average food stamp benefit breaks down to approximately $4 per person per day.

20. It is being projected that approximately 50 percent of all U.S. children will be on food stamps before they reach the age of 18.

21. Today, approximately 17 million children in the United States are facing food insecurity.  In other words, that means that “one in four children in the country is living without consistent access to enough nutritious food to live a healthy life.”

22. It may be hard to believe, but approximately 57 percent of all children in the United States are currently living in homes that are considered to be either “low income” or impoverished.

23. The number of children living on $2.00 a day or less in the United States has grown to 2.8 million.  That number has increased by 130 percent since 1996.

24. In Miami, 45 percent of all children are living in poverty.

25. In Cleveland, more than 50 percent of all children are living in poverty.

26. According to a recently released report, 60 percent of all children in the city of Detroit are living in poverty.

27. According to a Feeding America hunger study, more than 37 million Americans are now being served by food pantries and soup kitchens.

28. The U.S. government has spent an astounding 3.7 trillion dollars on welfare programs over the past five years.

29. It has been reported that 4 out of every 5 adults in the United States “struggle with joblessness, near-poverty or reliance on welfare for at least parts of their lives”.

These poverty numbers keep getting worse year after year no matter what our politicians do.

So is there anyone out there that would still like to argue that we are in an “economic recovery”?

And as I mentioned above, the “have nots” are becoming increasingly angry at the “haves”.  For example, just check out the following excerpt from a recent New York Post article

The maniac who butchered a Brooklyn mom and her four young kids confessed that he did it because he was jealous of their way of life, a police source told The Post on Sunday.

The family had too much. Their income (and) lifestyle was better than his,” the source said.

The bloody suspect was caught holding the kitchen knife he used during the Saturday night rampage inside the Sunset Park apartment where he had been staying with the victims, the source added.

Sadly, this was not an isolated incident.  All over the western world, a “Robin Hood mentality” is growing.  This is something that I am so concerned about that I made it a big part of my new book.  At this point, even wealthy Hollywood-types such as actor Russell Brand are calling for a socialist-style “revolution” and a “massive redistribution of wealth“.

Perhaps Brand does not understand that what he is calling for would mean redistributing most of his own wealth away from him.

When the next major wave of the economic collapse strikes, I fear that all of this anger and frustration that are growing among the poor will boil over in some very frightening ways.  I believe that we will see a huge spike in crime and that we will eventually see communities all over America looted and burning.

But I am not the only one that is thinking along these lines.  A new National Geographic Channel movie entitled “American Blackout” attempts to portray the social chaos that could erupt in the event of an extended national power failure

American Blackout, National Geographic Channel’s two-hour, edge-of-your-seat movie event imagines the story of a national power failure in the United States caused by a cyberattack — told in real time, over 10 days, by those who kept filming on cameras and phones. You’ll learn what it means to be absolutely powerless.

You can view a clip of the film that was made available by NatGeo for the SHTFplan.com community right here.

What would you do if something like that happened to you?

How would you handle desperate, hungry people at your fence asking for food?

And what if those people were armed and were not “asking nicely” for your food?

Don’t ignore what is happening in America right now.  It is setting the stage for some very chaotic times.

Get ready while you still can.

Median Household Income Has Fallen For FIVE YEARS IN A ROW

Five - Photo by woodley wonderworksIf the economy is getting better, then why do incomes keep falling?  According to a shocking new report that was just released by the U.S. Census Bureau, median household income (adjusted for inflation) has declined for five years in a row.  This has happened even though the federal government has been borrowing and spending money at an unprecedented rate and the Federal Reserve has been on the most reckless money printing spree in U.S. history.  Despite all of the “emergency measures” that have been taken to “stimulate the economy”, things just continue to get worse for average American families.  Americans are working harder than ever, but their paychecks are not reflecting that.  Meanwhile, the cost of everything just keeps going up.  The Federal Reserve insists that inflation is “low”, but anyone that goes grocery shopping or that stops at a gas station knows that is a lie.  In fact, if inflation was calculated the exact same way that it was calculated back in 1980, the inflation rate would be somewhere between 8 and 10 percent right now.  Paychecks are being stretched more than ever before, and that is probably the reason why about three-fourths of the entire country is living paycheck to paycheck at this point.

According to the Census report, the high point for median household income in the United States was back in 1999 ($56,080).  It almost got back to that level in 2007 ($55,627), but ever since then there has been a steady decline.  The following figures come directly from the report, and as you can see, median household income has fallen every single year for the past five years…

2007: $55,627

2008: $53,644

2009: $53,285

2010: $51,892

2011: $51,100

2012: $51,017

How far does that number have to go down before we admit that we have a major problem on our hands?

The new Census report also revealed that 46.5 million Americans are living in poverty.  As CNSNews.com noted, this is far higher than when Barack Obama first entered the White House…

During the four years that marked President Barack Obama’s first term in office, the real median income of American households dropped by $2,627 and the number of people on poverty increased by approximately 6,667,000, according to data released today by the Census Bureau.

So why does Obama continue to insist that things are getting better?

Right now, one out of every five households in the United States is on food stamps.

One out of every five.

How bad does it have to get before we acknowledge that what we are doing economically is not working.

Will half of us eventually end up on food stamps?

In addition, the new Census report also says that 48 million Americans are currently without any kind of health insurance whatsoever.

The biggest culprit for this is the stunning decline of employment-based health insurance.  Back in 1999, 64.1 percent of all Americans were covered by employment-based health insurance.  Today, only 54.9 percent are covered by employment-based health insurance.

And of course as I noted yesterday, even more companies are going to be dumping health insurance plans because of Obamacare.

All in all, what we have been witnessing over the past decade and a half is the systematic evisceration of the middle class.

After accounting for inflation, right now 40 percent of all U.S. workers are making less than what a full-time minimum wage worker made back in 1968.

Over the years, our incomes have certainly gone up, but inflation has increased even faster.

Back when I was growing up, $50,000 a year sounded like a whole lot of money.  I thought that anyone should be able to live a very comfortable lifestyle on that amount of money.

Unfortunately, $50,000 a year doesn’t go nearly as far as it once did.

If you take the current median household income ($51,017) and divide it up by 12 months, it comes to just a little bit more than $4000 a month.

And as I noted last year, it is not easy for the average American family to do everything that it needs to do on $4000 a month…

So can an average family of four people make it on just $4000 a month?

Well, first of all you have got to take out taxes.  After accounting for all forms of taxation you will be lucky if you have $3000 remaining.

With that $3000, you have to pay for all of the following…

*Housing

*Power

*Water

*Food

*Phone

*Internet

*At Least One Vehicle

*Gasoline

*Vehicle Repairs

*Car Insurance

*Health Insurance

*Dental Bills

*Home Or Rental Insurance

*Life Insurance

*Student Loan Debt Payments

*Credit Card Payments

*Furniture

*Clothing

*Pets

*Entertainment (although it is hard to imagine any money will be left for that)

Have I left anything out?

The truth is that $3000 does not go as far as it used to.

No wonder American families are feeling so stretched financially these days.

The new Census report also noted that the gap between the wealthiest Americans and the rest of us continues to grow.  There is certainly nothing wrong with making money, but if the economy was working properly all Americans should be able to have the opportunity to better themselves.

According to CNBC, the 400 wealthiest Americans now have more money than the poorest 50 percent of all Americans combined.

So why is this happening?  Well, certainly there are a lot of reasons, but in recent years quantitative easing has definitely played a role.  As I noted in my recent article about the Federal Reserve, quantitative easing has been incredibly good for those with stocks and other forms of financial investments.  All of that liquidity has juiced the financial markets, and the extremely wealthy have been loving it.

Meanwhile, things just continue to get even tougher for most of the rest of the American people, and the frightening thing is that the next major wave of the economic collapse has not even hit us yet.

How bad will things be for average American families once that happens?

And there are certainly lots of troubling signs as we get ready to head into the fall season…

-Total mortgage activity has dropped to the lowest level that we have seen since October 2008.

-One of the largest furniture manufacturers in America was just forced into bankruptcy.

-According to the Wall Street Journal, the 2013 holiday shopping season is already being projected to be the worst that we have seen since 2009.

Hopefully the slow and steady economic decline that we have been experiencing will not accelerate into a full-blown avalanche any time soon.

But I would definitely get prepared just in case.

The U.S. Government Will Borrow Close To 4 Trillion Dollars This Year

DebtWhen you add maturing debt to the new debt that the federal government is accumulating, the total is quite eye catching.  You see, the truth is that the U.S. government must not only borrow enough money to fund government spending for this year, it must also “roll over” existing debt that has reached maturity.  Of course the government never actually pays any of that debt off.  Instead, it essentially takes out new debts to cover the old ones.  So the U.S. government is actually borrowing far more money each year than most Americans realize.  For fiscal year 2013, the U.S. budget deficit will be about $845 billion, but on top of that the government will also have to borrow about 3 trillion dollars to pay off old debt that is maturing.  Overall, the U.S. government will borrow close to 4 trillion dollars this year, and that number will likely be even higher next year.  That is not going to cause a crisis as long as interest rates stay super low, but if interest rates begin to rise substantially, the game will change dramatically.

When the government borrows money, it has to pay it back someday.  Back in the old days, the federal government used to issue lots of debt that would not mature for a very long time.  But in recent years things have been very different

In order to fund the government, the Treasury Department periodically auctions Treasury securities with various maturities ranging from 30-day Treasury bills to 30-year Treasury bonds, with 2-3-5-7-year and 10-year Treasury notes in between. It used to be that the bulk of Treasury borrowing was done in the longer-term instruments with maturities of at least 10 years.

In more recent years, however, this trend has shifted more toward shorter-term Treasury securities. There are pros and cons to both strategies. Generally speaking, the shorter maturities are considered more risky since short-term interest rates can vary frequently. Shorter-term maturities obviously have to be rolled over much more often. That raises the risk that there might not be enough buyers when the government needs them.

At this point, the average maturity of outstanding government debt is only 65 months, and only about 10 percent of all Treasury debt matures outside of a decade.

So what does that mean?

It means that the federal government must constantly roll over massive amounts of debt.  Once again, this is not too much of a problem as long as interest rates stay super low, but as John Cochrane pointed out, if rates start rising back to “normal” levels things could get quite hairy very quickly…

Here’s the nightmare scenario: Suppose that four years from now, interest rates rise 5 percent, i.e. back to normal, and the US has $20 trillion outstanding. Interest costs alone will rise $1 trillion (5% of $20 trillion) – doubling already unsustainable deficits! This is what happened to Italy, Spain, and Portugal. Don’t think it can’t happen to us. It’s even more likely, because fear of inflation – which did not hit them, since they are on the Euro – can hit us.

Sadly, those running things appears to be quite clueless.  For example, retiring U.S. Representative Michele Bachmann recently asked Federal Reserve Chairman Ben Bernanke why the national debt has remained frozen in place for 56 straight days even though we have been borrowing lots of money.  Bernanke seemed to have no idea how to answer that question

As Federal Reserve Chairman Ben Bernanke testified before the House Financial Services Committee Wednesday, Bachmann asked how there could be no increase reported in the total debt when the government is racking up about $4 billion a day in new debt.

“After nearly 10 years as the head of the Federal Reserve, Chairman Bernanke could not answer my question today in Financial Services Committee,” Bachmann told WND.

She wondered if there’s a political motive.

“I asked whether the Treasury Department was cooking the federal government’s books as it was reported that the Feds debt balance sheet remained at $16,699,396,000,000 for 56 days straight, presumably so the Treasury Department wouldn’t officially register that once again the Congress had exceeded its legal borrowing limits.”

For the moment, the federal government is able to recklessly borrow and spend money and investors are rewarding this behavior with super low interest rates.

Unfortunately, this state of affairs is completely and totally unsustainable.  At some point global financial markets will begin to behave rationally, and when that happens it is going to mean a tremendous amount of pain for the United States.

Over the past decade, the U.S. government has added more than 11 trillion dollars to the national debt at a time when the U.S. economy has been steadily declining.  Anyone that thinks that we can continue to pile up more debt like this indefinitely does not know what they are talking about.

The following are some more statistics about the U.S. national debt for you to consider…

-Back in 1980, the U.S. national debt was less than one trillion dollars.  Today, it is rapidly approaching 17 trillion dollars.

During Obama’s first term, the federal government accumulated more debt than it did under the first 42 U.S presidents combined.

The U.S. national debt is now more than 23 times larger than it was when Jimmy Carter became president.

If you started paying off just the new debt that the U.S. has accumulated during the Obama administration at the rate of one dollar per second, it would take more than 184,000 years to pay it off.

If right this moment you went out and started spending one dollar every single second, it would take you more than 31,000 years to spend one trillion dollars.

If you were alive when Jesus Christ was born and you spent one million dollars every single day since that point, you still would not have spent one trillion dollars by now.

Some suggest that “taxing the rich” is the answer.  Well, if Bill Gates gave every single penny of his entire fortune to the U.S. government, it would only cover the U.S. budget deficit for 15 days.

If the federal government used GAAP accounting standards like publicly traded corporations do, the real federal budget deficit for 2011 would have been 5 trillion dollars instead of 1.3 trillion dollars.

The United States already has more government debt per capita than Greece, Portugal, Italy, Ireland or Spain does.

At this point, the United States government is responsible for more than a third of all the government debt in the entire world.

The amount of U.S. government debt held by foreigners is about 5 times larger than it was just a decade ago.

The U.S. national debt is now more than 37 times larger than it was when Richard Nixon took us off the gold standard.

The U.S. national debt is now more than 5000 times larger than it was when the Federal Reserve was first created.

Boston University economist Laurence Kotlikoff is warning that the U.S. government is facing a gigantic tsunami of unfunded liabilities in the coming years that we are counting on our children and our grandchildren to pay.  Kotlikoff speaks of a “fiscal gap” which he defines as “the present value difference between projected future spending and revenue”.  His calculations have led him to the conclusion that the federal government is facing a fiscal gap of 222 trillion dollars in the years ahead.

For the moment everything is fine because interest rates are incredibly low and the mockers in the “deficits don’t matter” fan club are having a field day.

But what is going to happen when interest rates return to rational levels?

How will the U.S. government be able to borrow the trillions of dollars that it needs to borrow every single year?

That is why it is so important to watch interest rates.  When they start skyrocketing, big trouble is ahead.