Dot-Com Bubble 2.0 Is Bursting: Tech Stocks Are Already Down Half A Trillion Dollars Since Mid-2015

Tech Bubble 2.0
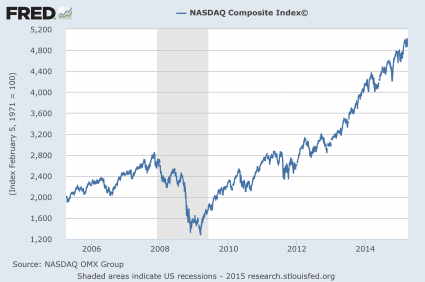
Do you remember how much stocks went down when the first dot-com bubble burst?  Well, it is happening again, and tech stocks are already down more than half a trillion dollars since the middle of 2015.  On Friday, the tech-heavy Nasdaq dropped to its lowest level in more than 15 months, and it has now fallen more than 16 percent from the peak of the market.  But of course some of the biggest names have fallen much more than that.  Netflix is down 37 percent, Yahoo is down 39 percent, LinkedIn is down 60 percent, and Twitter is down more than 70 percent.  If you go back through my previous articles, you will find that I specifically warned about Twitter again and again.  Irrational financial bubbles like this always burst eventually, and many investors that got in at the very top are now losing extraordinary amounts of money.

On Friday, tech stocks got absolutely slammed as the bursting of dot-com bubble 2.0 accelerated once again.  The following is how CNBC summarized the carnage…

The Nasdaq composite fell 3.25 percent, as Apple and the iShares Nasdaq Biotechnology ETF (IBB) dropped 2.67 percent and 3.19 percent, respectively.

Also weighing on the index were Amazon and Facebook, which closed down 6.36 percent and 5.81 percent, respectively.

LinkedIn shares also tanked 43.63 percent after posting weak guidance on their quarterly results.

Overall, LinkedIn is now down a total of 60 percent from the peak of the market.  But they are far from the only ones that have already seen their bubble burst.

Many of the biggest names in the tech world have gotten mercilessly hammered over the past six months of so.  Just look at some of the famous brands that have already lost between 20 and 40 percent of their market caps…

Yahoo (YHOO) shares are off 39%, and Netflix (NFLX), the best-performing stock in the S&P 500 last year, is now off by 37% from its 52-week high.

Likewise, Priceline.com (PCLN) is off 31% and eBay (EBAY), 22%.

But there are other very big tech companies that have seen stock collapses that completely dwarf those numbers.  Here are some more absolutely stunning statistics from USA Today

Twitter and Groupon are the biggest dogs of this boom, both off 70% from 52-week highs and well below their IPO prices.

FitBit shares have collapsed 70%, while Yelp’s valuation has shrunk by two-thirds.

Box, which has the distinction of posting quarterly net losses in excess of revenue, is down by half.

Match.com, the holding company for dating sites owned by parent Interactive Corp. that went public late last year, is down 39% from its high.

When your stock loses 70 percent of its value, that is a complete and utter collapse.

In the past, I have specifically singled out Twitter, Yelp and LinkedIn as tech stocks that were irrationally priced.

Hopefully people listened to those warnings and got out while the getting was good.

At the top of this article, I mentioned that tech stocks have already fallen in value by more than 500 billion dollars.  The financial crisis that began in the middle of last year is now greatly accelerating, and Wall Street is starting to panic.

As stocks crash, many hedge funds are being absolutely pummeled.  The following are just a few of the high profile names that are experiencing massive losses right now

Some of the biggest names to get trounced include:

►Pershing Square Capital Management, the publicly traded investment vehicle of billionaire hedgie Bill Ackman, fell 11% last month following a 20% decline last year, data from the web site shows.

►Larry Robbins’ Glenview Capital, famous for picking stocks that could benefit from Obamacare, dropped 13.65% in January following a decline of 18% last year, according to data from HSBC’s Hedge Weekly report, a copy of which was obtained by USA TODAY.

►Marcato International, a well-known activist fund run by Ackman protege Mick McGuire, fell 12.1% last month following a 9% loss last year, according to HSBC.

When you lose more than 10 percent of your money in a single month, that is not good.

And if I am right, this is just the beginning of our troubles.

And of course I am far from the only one warning that big problems are on the horizon.  In fact, analysts at Citigroup just made international headlines by warning that the global economy was now trapped in a “death spiral”

Some analysts — including those at Citi — have turned bearish on the world economy this year, following an equity rout in January and weaker economic data out of China and the U.S.

The world appears to be trapped in a circular reference death spiral,” Citi strategists led by Jonathan Stubbs said in a report on Thursday.

Stronger U.S. dollar, weaker oil/commodity prices, weaker world trade/petrodollar liquidity, weaker EM (and global growth)… and repeat. Ad infinitum, this would lead to Oilmageddon, a ‘significant and synchronized’ global recession and a proper modern-day equity bear market.”

Signs of a significant economic downturn are all around us, and so many of the exact same patterns that played out during the last two stock market crashes are happening again, and yet most people continue to refuse to acknowledge what is taking place.

If you are waiting for this new dot-com bubble to crash, you can stop waiting, because it has already happened.

When your stock falls by 50, 60 or 70 percent, the game is already over.

But just like 2001 and 2008, many people out there will end up being paralyzed by indecision.  Once again the mainstream media is insisting that there is no reason for panic and that everything will be just fine, and once again millions upon millions of ordinary Americans will be wiped out as the financial markets implode.

This is now the third time this has happened since the turn of the century.

How clueless have we become?  The exact same thing keeps happening to us over and over and yet we still don’t get it.

Only this time around there isn’t going to be any sort of a “recovery” afterwards.

This is essentially our “third strike”, and the years ahead are going to be extremely bitter and painful for most people.

But if you want to believe that one of these politicians is going to come along and save America, you go ahead and keep on believing that.

Most people believe what they want to believe, and the capacity that many Americans have demonstrated for self-delusion is absolutely remarkable.

Is The Stock Market Overvalued?

Stock Market Overvalued - Public DomainAre stocks overvalued?  By just about any measure that you could possibly name, stocks are at historically high prices right now.  From a technical standpoint, the stock market is more overvalued today than it was just prior to the last financial crisis.  The only two moments in U.S. history that even compare to our current state of affairs are the run up to the stock market crash of 1929 and the peak of the hysteria just before the dotcom bubble burst.  It is so obvious that stocks are in a bubble that even Janet Yellen has talked about it, but of course she will never admit that the Federal Reserve has played a key role in creating this bubble.  They say that hindsight is 20/20, but what is happening right in front of our eyes in 2015 is so obvious that everyone should be able to see it.  Just like with all other financial bubbles throughout our history, someday people will look back and talk about how stupid we all were.

Why can’t we ever learn from history?  We just keep on making the same mistakes over and over again.  And without a doubt, some of the smartest members of our society are trying to warn us about what is coming.  For example, Yale economics professor Robert Shiller has repeatedly tried to warn us that stocks are overvalued

I think that compared with history, US stocks are overvalued. One way to assess this is by looking at the CAPE (cyclically adjusted P/E) ratio that I created with John Campbell, now at Harvard, 25 years ago. The ratio is defined as the real stock price (using the S&P Composite Stock Price Index deflated by the CPI) divided by the ten-year average of real earnings per share. We have found this ratio to be a good predictor of subsequent stock market returns, especially over the long run. The CAPE ratio has recently been around 27, which is quite high by US historical standards. The only other times it has been that high or higher were in 1929, 2000, and 2007—all moments before market crashes.

But the CAPE ratio is not the only metric I watch. In my book Irrational Exuberance (3rd Ed., Princeton 2015) I discuss several metrics that help judge what’s going on in the market. These include my stock market confidence indices. One of the indicators in that series is based on a single question that I have asked individual and institutional investors over the years along the lines of, “Do you think the stock market is overvalued, undervalued, or about right?” Lately, what I call “valuation confidence” captured by this question has been on a downward trend, and for individual investors recently reached its lowest point since the stock market peak in 2000.

Other analysts prefer to use different valuation indicators than Shiller does.  But no matter which indicators you use, they all show that stocks are tremendously overvalued in mid-2015.  For instance, just consider the following chart.  It comes from Doug Short, and it shows the average of four of his favorite valuation indicators.  As you can see, there is only one other time in all of our history when stocks have been more overvalued than they are today according to the average of these four indicators…

Four Valuation Indicators - Doug Short

Another danger sign that many analysts are pointing to is the dramatic rise in margin debt that we have seen in recent years.  Investors are borrowing tremendous amounts of money to fund purchases of stock.  This is something that we witnessed during the dotcom bubble, it was something that we witnessed just prior to the financial collapse of 2008, and now it is happening again.  In fact, margin debt just surged to a brand new all-time record high.  Once again, the following chart comes from Doug Short

NYSE Margin Debt - Chart by Doug Short

All of this margin debt has helped drive stocks to ridiculous highs, but it can also serve to drive stock prices down very rapidly when the market turns.  This was noted by Henry Blodget of Business Insider in a recent editorial…

What is “margin debt”?

It’s the amount of money stock investors have collectively borrowed via traditional margin accounts to fund stock purchases.

In a bull market, the growth of margin debt serves as a turbocharger that helps drive stock prices higher.

As with a home mortgage, the more investors borrow, the more house or stock they can buy. So as margin debt grows, collective buying power grows. The borrowed money gets used to fund new stock purchases, which helps drives the prices of those stocks higher. The higher prices, in turn, allow traders to borrow more money to fund additional purchases. And so on.

It’s a self-reinforcing cycle.

The trouble is that it’s a self-reinforcing cycle on the way down, too.

If the overall U.S. economy was absolutely booming, these ultra-high stock prices would not be as much of a concern.  But the truth is that the financial markets have become completely divorced from economic reality.  Right now, corporate profits are actually falling and our exports are way down.  U.S. GDP shrunk during the first quarter, and there are a whole host of economic trouble signs on the horizon.  I am calling this a “recession within a recession“, and I believe that we are heading into another major economic downturn.

Unfortunately, our “leaders” are absolutely clueless about what is coming.  They assure us that everything is going to be just fine – just like they did back in 2008 before everything fell apart.  But the truth is that things are already so bad that even the big banks are sounding the alarm.  For instance, just consider the following words from Deutsche Bank

At issue is whether or not the Fed in particular but the market in general has properly understood the nature of the economic problem. The more we dig into this, the more we are afraid that they do not. So aside from a data revision tsunami, we would suggest that the Fed has the outlook not just horribly wrong, but completely misunderstood.

Ultimately, most people believe what they want to believe.

Our politicians want to believe that the economy is going to get better, and so do the bureaucrats over at the Federal Reserve.  The mainstream media wants to put a happy face on things, and they want all of us to continue to have faith in the system.

Unfortunately for them, the system is failing.  I truly do hope that this bubble can last for a few more months, but I don’t see it going on for much longer than that.

The greatest financial crisis in U.S. history is fast approaching, and it is going to be extraordinarily painful.

When it arrives, it is not just going to destroy faith in the system.  In the end, it is going to destroy the system altogether.

If Anyone Doubts That We Are In A Stock Market Bubble, Show Them This Article

Bubble In Hands - Public DomainThe higher financial markets rise, the harder they fall.  By any objective measurement, the stock market is currently well into bubble territory.  Anyone should be able to see this – all you have to do is look at the charts.  Sadly, most of us never seem to learn from history.  Most of us want to believe that somehow “things are different this time”.  Well, about the only thing that is different this time is that our economy is in far worse shape than it was just prior to the last major financial crisis.  That means that we are more vulnerable and will almost certainly endure even more damage this time around.  It would be one thing if stocks were soaring because the U.S. economy as a whole was doing extremely well.  But we all know that isn’t true.  Instead, what we have been experiencing is clearly artificial market behavior that has nothing to do with economic reality.  In other words, we are dealing with an irrational financial bubble, and all irrational financial bubbles eventually burst.  And as I wrote about yesterday, the way that stocks have moved so far this year is eerily reminiscent of the way that stocks moved in early 2008.  The warning signs are there – if you are willing to look at them.

The first chart that I want to share with you today comes from Doug Short.  It is a chart that shows that the ratio of corporate equities (stocks) to GDP is the second highest that it has been since 1950.  The only other time it has been higher was just before the dotcom bubble burst…

The Buffett Indicator from Doug Short

Does that look like a bubble to you?

It sure looks like a bubble to me.

In order for the corporate equities to GDP ratio to get back to the mean (average) level, stock prices would have to fall nearly 50 percent.

If that happens, people will be calling it a crash, but in truth it would just be a return to normalcy.

This next chart comes from Phoenix Capital Research.  The CAPE ratio (cyclically adjusted price-to-earnings ratio) is considered to be an extremely accurate measure of the true value of stocks…

As I’ve noted before, the single best predictor of stock market performance is the cyclically adjusted price-to-earnings ratio or CAPE ratio.

Corporate earnings are heavily influenced by the business cycle. Typically the US experiences a boom and bust once every ten years or so. As such, companies will naturally have higher P/E’s at some points and lower P/E’s at other. This is based solely on the business cycle and nothing else.

CAPE adjusts for this by measuring the price of stocks against the average of ten years’ worth of earnings, adjusted for inflation. By doing this, it presents you with a clearer, more objective picture of a company’s ability to produce cash in any economic environment.

Based on a study completed Vanguard, CAPE was the single best metric for measuring future stock returns.

When the CAPE ratio is too high, that means that stocks are overpriced and are not a good value.  And right now the CAPE ratio is the 3rd highest that it has been since 1890.  That only times it has been higher than this were in 1929 (we all remember what happened then) and just before the dotcom bubble burst…

CAPE - Phoenix Capital Research

The funny thing is that stocks have continued to rise even as corporate revenues have begun to fall.

According to Wolf Richter, in the first quarter of 2015 corporate revenues are projected to decline at the fastest pace that we have seen since the depths of the last recession…

Week after week, corporations and analysts have been whittling down their estimates. By now, revenues of the S&P 500 companies are expected to decline 2.8% in Q1 from a year ago – the worst year-over-year decline since Q3 of crisis year 2009.

This next chart I want to share with you shows how the Nasdaq has performed over the past decade.  Looking at this chart alone, you would think that the U.S. economy must have been absolutely roaring since the end of the last recession.  But what is really going on is rampant speculation.  Some of the tech companies that make up the Nasdaq are not making any profits at all and yet they are supposedly worth billions of dollars.  If you cannot see a bubble in this chart, you need to get your vision checked…

NASDAQ Chart

And this kind of irrational euphoria is not just happening in the United States.

For example, Chinese stocks are up nearly 80 percent over the past nine months.

Meanwhile, the overall Chinese economy is growing at the slowest pace that we have seen in about 20 years.

Right now, we are in the calm before the storm.  We are right at the door of the next great financial crisis, and most of the people that work in the industry know this.

And once in a while they let the cat out of the bag.

For example, consider what Hans-Jörg Vetter, the CEO of Landesbank Baden-Württemberg in Germany, had to say during one recent press conference

“Risk is no longer priced in,” he said. And these investors aren’t paid for the risks they’re taking. This applies to all asset classes, he said. The stock and the bond markets, he said, are now both seeing “the mother of all bubbles.”

This can’t go on forever. Or for very long. But he couldn’t see the future either and pin down a date, which is what everyone wants to know so that they can all get out in time. “I cannot tell you when it will rumble,” he said, “but eventually it will rumble again.”

By “again” he meant the sort of thing that had taken the bank down last time, the Financial Crisis. It had been triggered by horrendous risk-taking, where risks hadn’t been priced into all kinds of securities. When those securities – mortgage-backed securities, for example, that were hiding the inherent risks under a triple-A rating – blew up, banks toppled.

What Vetter is telling us is what I have been warning about for a long time.

Another great stock market crash is coming.

It is just a matter of time.

11 Predictions Of Economic Disaster In 2015 From Top Experts All Over The Globe

2015 - Public DomainWill 2015 be a year of financial crashes, economic chaos and the start of the next great worldwide depression?  Over the past couple of years, we have all watched as global financial bubbles have gotten larger and larger.  Despite predictions that they could burst at any time, they have just continued to expand.  But just like we witnessed in 2001 and 2008, all financial bubbles come to an end at some point, and when they do implode the pain can be extreme.  Personally, I am entirely convinced that the financial markets are more primed for a financial collapse now than they have been at any other time since the last crisis happened nearly seven years ago.  And I am certainly not alone.  At this point, the warning cries have become a deafening roar as a whole host of prominent voices have stepped forward to sound the alarm.  The following are 11 predictions of economic disaster in 2015 from top experts all over the globe…

#1 Bill Fleckenstein: “They are trying to make the stock market go up and drag the economy along with it. It’s not going to work. There’s going to be a big accident. When people realize that it’s all a charade, the dollar will tank, the stock market will tank, and hopefully bond markets will tank. Gold will rally in that period of time because it’s done what it’s done because people have assumed complete infallibility on the part of the central bankers.”

#2 John Ficenec: “In the US, Professor Robert Shiller’s cyclically adjusted price earnings ratio – or Shiller CAPE – for the S&P 500 is currently at 27.2, some 64pc above the historic average of 16.6. On only three occasions since 1882 has it been higher – in 1929, 2000 and 2007.”

#3 Ambrose Evans-Pritchard, one of the most respected economic journalists on the entire planet: “The eurozone will be in deflation by February, forlornly trying to ignite its damp wood by rubbing stones. Real interest rates will ratchet higher. The debt load will continue to rise at a faster pace than nominal GDP across Club Med. The region will sink deeper into a compound interest trap.”

#4 The Jerome Levy Forecasting Center, which correctly predicted the bursting of the subprime mortgage bubble in 2007: “Clearly the direction of most of the recent global economic news suggests movement toward a 2015 downturn.”

#5 Paul Craig Roberts: “At any time the Western house of cards could collapse. It (the financial system) is a house of cards. There are no economic fundamentals that support stock prices — the Dow Jones. There are no economic fundamentals that support the strong dollar…”

#6 David Tice: “I have the same kind of feel in ’98 and ’99; also ’05 and ’06.  This is going to end badly. I have every confidence in the world.”

#7 Liz Capo McCormick and Susanne Walker: “Get ready for a disastrous year for U.S. government bonds. That’s the message forecasters on Wall Street are sending.”

#8 Phoenix Capital Research: “Just about everything will be hit as well. Most of the ‘recovery’ of the last five years has been fueled by cheap borrowed Dollars. Now that the US Dollar has broken out of a multi-year range, you’re going to see more and more ‘risk assets’ (read: projects or investments fueled by borrowed Dollars) blow up. Oil is just the beginning, not a standalone story.

If things really pick up steam, there’s over $9 TRILLION worth of potential explosions waiting in the wings. Imagine if the entire economies of both Germany and Japan exploded and you’ve got a decent idea of the size of the potential impact on the financial system.”

#9 Rob Kirby: “What this breakdown in the crude oil price is going to spawn another financial crisis.  It will be tied to the junk debt that has been issued to finance the shale oil plays in North America.  It is reported to be in the area of half a trillion dollars worth of junk debt that is held largely on the books of large financial institutions in the western world.  When these bonds start to fail, they will jeopardize the future of these financial institutions.  I do believe that will be the signal for the Fed to come riding to the rescue with QE4.  I also think QE4 is likely going to be accompanied by bank bail-ins because we all know all western world countries have adopted bail-in legislation in their most recent budgets.  The financial elites are engineering the excuse for their next round of money printing . . .  and they will be confiscating money out of savings accounts and pension accounts.  That’s what I think is coming in the very near future.”

#10 John Ing: “The 2008 collapse was just a dress rehearsal compared to what the world is going to face this time around. This time we have governments which are even more highly leveraged than the private sector was.

So this time the collapse will be on a scale that is many magnitudes greater than what the world witnessed in 2008.”

#11 Gerald Celente: “What does the word confidence mean? Break it down. In this case confidence = con men and con game. That’s all it is. So people will lose confidence in the con men because they have already shown their cards. It’s a Ponzi scheme. So the con game is running out and they don’t have any more cards to play.

What are they going to do? They can’t raise interest rates. We saw what happened in the beginning of December when the equity markets started to unravel. So it will be a loss of confidence in the con game and the con game is soon coming to an end. That is when you are going to see panic on Wall Street and around the world.”

If you have been following my website, you know that I have been pointing to 2015 for quite some time now.

For example, in my article entitled “The Seven Year Cycle Of Economic Crashes That Everyone Is Talking About“, I discussed the pattern of financial crashes that we have witnessed every seven years that goes all the way back to the Great Depression.  The last two major stock market crashes began in 2001 and 2008, and now here we are seven years later.

Will the same pattern hold up once again?

In addition, there are many other economic cycles that seem to indicate that we are due for a major economic downturn.  I discussed quite a few of these theories in my article entitled “If Economic Cycle Theorists Are Correct, 2015 To 2020 Will Be Pure Hell For The United States“.

But just like in 2000 and 2007, there are a whole host of doubters that are fully convinced that the party can continue indefinitely.  Even though our economic fundamentals continue to get worse, our debt levels continue to grow and every objective measurement shows that Wall Street is more reckless and more vulnerable to collapse than ever before, they mock the idea that a financial collapse is imminent.

So let’s see what happens in 2015.

I have a feeling that it is going to be an extremely “interesting” year.

9 Ominous Signals Coming From The Financial Markets That We Have Not Seen In Years

Ominous Storm Clouds Gathering - Public DomainIs the stock market about to crash?  Hopefully not, and there definitely have been quite a few “false alarms” over the past few years.  But without a doubt we have been living through one of the greatest financial bubbles in U.S. history, and the markets are absolutely primed for a full-blown crash.  That doesn’t mean that one will happen now, but we are starting to see some ominous things happen in the financial world that we have not seen happen in a very long time.  So many of the same patterns that we witnessed just prior to the bursting of the dotcom bubble and just prior to the 2008 financial crisis are repeating themselves again.  Hopefully we still have at least a little bit more time before stocks completely crash, because when this market does implode it is going to be a doozy.

The following are 9 ominous signals coming from the financial markets that we have not seen in years…

#1 By the time the markets closed on Monday, we had witnessed the biggest three day decline for U.S. stocks since 2011.

#2 On Monday, the S&P 500 moved below its 200 day moving average for the first time in about two years.  The last time this happened after such an extended streak of success, the S&P 500 ended up declining by a total of 22 percent.

#3 This week the put-call ratio actually moved higher than it was at any point during the collapse of Lehman Brothers in 2008.  This is an indication that there is a tremendous amount of fear on Wall Street right now.

#4 Everybody is watching the VIX at the moment.  According to the Economic Policy Journal, the VIX has now risen to the highest level that it has been since the heart of the European debt crisis.  This is another indicator that there is extraordinary fear on Wall Street…

US stock market volatility has jumped to the highest since the eurozone debt crisis, according to a closely watched index, the the CBOE Vix index of implied US share price volatility.

It jumped to 24.6 late on Monday and is up again this morning. On Thursday, it was as low as 15.

That’s a very strong move, but things have been much worse. At height of the recent financial crisis – the Vix index peaked at 80.1 in November 2008.

Could we get there again? Yeah.

#5 The price of oil is crashing.  This also happened in 2008 just before the financial crisis erupted.  At this point, the price of oil is now the lowest that it has been in more than two years.

#6 As Chris Kimble has pointed out, the chart for the Dow has formed a “Doji Star topping pattern”.  We also saw this happen in 2007.  Could this be an indication that we are on the verge of another stock market crash similar to what happened in 2008?

#7 Canadian stocks are actually doing even worse than U.S. stocks.  At this point, Canadian stocks have already dropped more than 10 percent from the peak of the market.

#8 European stocks have also had a very rough month.  For example, German stocks have already dropped about 10 percent since July, and there are growing concerns about the overall health of the German economy.

#9 The wealthy are hoarding cash and precious metals right now.  In fact, one British news report stated that sales of gold bars to wealthy customers are up 243 percent so far this year.

So what comes next?

Some experts are saying that this is the perfect time to buy stocks at value prices.  For example, USA Today published a story with the following headline on Tuesday: “Time to ‘buy’ the fear? One Wall Street pro says yes“.

Other experts, however, believe that this could represent a major turning point for the financial markets.

Just consider what Abigail Doolittle recently told CNBC

Technical strategist Abigail Doolittle is holding tight to her prediction of market doom ahead, asserting that a recent move in Wall Street’s fear gauge is signaling the way.

Doolittle, founder of Peak Theories Research, has made headlines lately suggesting a market correction worse than anyone thinks is ahead. The long-term possibility, she has said, is a 60 percent collapse for the S&P 500.

In early August, Doolittle was warning both of a looming “super spike” in the CBOE Volatility Index as well as a “death cross” in the 10-year Treasury note. The former referenced a sharp move higher in the “VIX,” while the latter used Wall Street lingo for an event that already occurred in which the fixed income benchmark saw its 50-day moving average cross below its 200-day trend line.

Both, she said, served as indicators for trouble ahead.

So what do you think?

Are we about to witness a stock market crash and another major financial crisis?

Or is this just another “false alarm” that will soon fade?

Please feel free to share what you think by posting a comment below…

Bubbles, Bubbles Everywhere

Financial Bubbles - Public DomainIs there any doubt that we are living in a bubble economy?  At this moment in the United States we are simultaneously experiencing a stock market bubble, a government debt bubble, a corporate bond bubble, a bubble in San Francisco real estate, a farmland bubble, a derivatives bubble and a student loan debt bubble.  And of course similar things could be said about most of the rest of the planet as well.  In fact, the total amount of government debt around the world has risen by about 40 percent just since the last recession.  But it is never sustainable when asset prices and debt levels increase much faster than the overall level of economic growth.  History has shown us that all financial bubbles eventually burst.  And when these current financial bubbles in America burst, the pain is going to be absolutely enormous.

You know that things are getting perilous when even the New York Times starts pointing out financial bubbles everywhere.  The following is a short excerpt from a recent NotQuant article

The New York Times points out that just about everything on Earth is expensive by historical standards.   And then asks the seemingly obvious question:  Does that make it a bubble?

Welcome to the Everything Boom — and, quite possibly, the Everything Bubble. Around the world, nearly every asset class is expensive by historical standards. Stocks and bonds; emerging markets and advanced economies; urban office towers and Iowa farmland; you name it, and it is trading at prices that are high by historical standards relative to fundamentals. The inverse of that is relatively low returns for investors.

Quite possibly?”  We’re not sure what definition of the word “bubble” they’re using.   But in our book when the price of literally everything blasts upwards, obliterating the previous ceilings of historical benchmarks, it’s a pretty good indication that you’re in a bubble.

Of course when most people think of financial bubbles the very first thing they think of is the stock market.  And without a doubt we are in a stock market bubble right now.  The Dow has risen more than 10,000 points since the depths of the last recession.  And it is nearly 3,000 points higher than it was at the peak of the last stock market bubble in 2007 when our economy was far stronger than it is now…

Dow Jones Industrial Average 2014

But of course these stock prices do not reflect economic reality in any way whatsoever.  Our economy has not even come close to recovering to the level it was at prior to the last financial crisis, and yet thanks to massive Federal Reserve money printing stock prices have soared to unprecedented heights.

At some point a massive correction is coming.  No stock market bubble lasts forever.  For a whole bunch of technical reasons why serious market turmoil is on the horizon, please see a recent Forbes article entitled “These 23 Charts Prove That Stocks Are Heading For A Devastating Crash“.

The bubbles in the financial markets have become so glaring that even the central bankers are starting to warn us about them.  For example, just consider what the Bank for International Settlements is saying

The Bank for International Settlements has warned that “euphoric” financial markets have become detached from the reality of a lingering post-crisis malaise, as it called for governments to ditch policies that risk stoking unsustainable asset booms.

While the global economy is struggling to escape the shadow of the crisis of 2007-09, capital markets are “extraordinarily buoyant”, the Basel-based bank said, in part because of the ultra-low monetary policy being pursued around the world. Leading central banks should not fall into the trap of raising rates “too slowly and too late”, the BIS said, calling for policy makers to halt the steady rise in debt burdens around the world and embark on reforms to boost productivity.

In its annual report, the BIS also warned of the risks brewing in emerging markets, setting out early warning indicators of possible banking crises in a number of jurisdictions, including most notably China.

“Particularly for countries in the late stages of financial booms, the trade-off is now between the risk of bringing forward the downward leg of the cycle and that of suffering a bigger bust later on,” it said.

Sadly, just like in 2007, most people are choosing not to listen to these warnings.

Another very troubling bubble that is brewing is the massive bubble of consumer credit in the United States.  According to the Wall Street Journal, consumer credit in the United States increased at a 7.4 percent annual rate in May…

The Federal Reserve reported Tuesday that consumer credit—consumer loans excluding real estate debt—in May increased at an annual rate of 7.4% to a record $3.195 trillion. Most of that gain came from a 9.3% increase in nonrevolving credit, the bulk of which is accounted for by auto and student loans. Revolving credit, which is primarily credit-card debt, expanded at a more muted 2.5% rate after jumping 12.3% in May.

That might be okay if our paychecks were increasing at a 7.4% annual rate, but that is not the case at all.  In fact, median household income in America has gone down for five years in a row.  As the quality of our jobs goes down the drain, our paychecks are shrinking even as our bills go up.  This is putting an incredible amount of stress on tens of millions of American families.

And when you look at the overall debt bubble in this country, things become even more frightening.

In a previous article, I shared a chart which shows the incredible growth of total debt in the United States.  Over the past 40 years, it has gone from about 2.2 trillion dollars to nearly 60 trillion dollars

Total Debt


Is this sustainable?

Of course not.

None of these financial bubbles are.

It is not a question of “if” they will burst.  It is only a question of “when”.

And some believe that we are rapidly approaching that point.  In fact, Marc Faber believes that we are seeing signs that it may be starting to happen already…

It’s the question investors everywhere are wrestling with: Are asset prices in a bubble, or do they simply reflect the fact that the global economy is growing once again?

For Marc Faber, editor of the Gloom, Boom & Doom Report, the answer is clear. In fact, he says the bubble may already be bursting.

“I think it’s a colossal bubble in all asset prices, and eventually it will burst, and maybe it has begun to burst already,” Faber said Tuesday on CNBC’s ‘Futures Now‘ as the S&P 500 lost ground for the second-straight session.

So what do you think?

How much time do you believe that we have before these bubbles start to burst?

Please feel free to share your thoughts by posting a comment below…

The Velocity Of Money In The U.S. Falls To An All-Time Record Low

Velocity Of Money M2When an economy is healthy, there is lots of buying and selling and money tends to move around quite rapidly.  Unfortunately, the U.S. economy is the exact opposite of that right now.  In fact, as I will document below, the velocity of M2 has fallen to an all-time record low.  This is a very powerful indicator that we have entered a deflationary era, and the Federal Reserve has been attempting to combat this by absolutely flooding the financial system with more money.  This has created some absolutely massive financial bubbles, but it has not fixed what is fundamentally wrong with our economy.  On a very basic level, the amount of economic activity that we are witnessing is not anywhere near where it should be and the flow of money through our economy is very stagnant.  They can try to mask our problems with happy talk for as long as they want, but in the end it will be clearly evident that none of the long-term trends that are destroying our economy have been addressed.

Discussions about the money supply can get very complicated, and that can cause people to tune out, but it doesn’t have to be that way.

To put it very basically, when there is lots of economic activity, there is lots of money changing hands.

When there is not very much economic activity, the pace at which money circulates through our system slows down.

That is why what is happening in the U.S. right now is so troubling.

First, let’s look at M1, which is a fairly narrow definition of the money supply.  The following is how Investopedia defines M1…

A measure of the money supply that includes all physical money, such as coins and currency, as well as demand deposits, checking accounts and Negotiable Order of Withdrawal (NOW) accounts. M1 measures the most liquid components of the money supply, as it contains cash and assets that can quickly be converted to currency. It does not contain “near money” or “near, near money” as M2 and M3 do.

As you can see from the chart posted below, the velocity of M1 normally declines during a recession.  Just look at the shaded areas in the chart.  But a funny thing has happened since the end of the last recession.  The velocity of M1 has just kept falling and it is now at a nearly 20 year low…

Velocity Of Money M1

Next, let’s take a look at M2.  It includes more things in the money supply.  The following is how Investopedia defines M2…

A measure of money supply that includes cash and checking deposits (M1) as well as near money. “Near money” in M2 includes savings deposits, money market mutual funds and other time deposits, which are less liquid and not as suitable as exchange mediums but can be quickly converted into cash or checking deposits.

In the chart posted below, we can once again see that the velocity of M2 normally slows down during a recession.  And we can also see that the velocity of M2 has continued to slow down in the “post-recession era” and has now dropped to the lowest level ever recorded

Velocity Of Money M2

This is a highly deflationary chart.

It clearly indicates that economic activity in the U.S. has been steadily slowing down.

And if we are honest, we have to admit that we are seeing signs of this all around us.  Major retailers are closing down stores at the fastest pace since the collapse of Lehman Brothers, consumer confidence is down, trading revenues at the big Wall Street banks are way down, and the steady decline in home sales is more than just a little bit alarming.

In addition, the employment situation in this country is much less promising than we have been led to believe.  According to a report put out by the Republicans on the Senate Budget Committee, an all-time record one out of every eight men in their prime working years are not in the labor force

“There are currently 61.1 million American men in their prime working years, age 25–54. A staggering 1 in 8 such men are not in the labor force at all, meaning they are neither working nor looking for work. This is an all-time high dating back to when records were first kept in 1955. An additional 2.9 million men are in the labor force but not employed (i.e., they would work if they could find a job). A total of 10.2 million individuals in this cohort, therefore, are not holding jobs in the U.S. economy today. There are also nearly 3 million more men in this age group not working today than there were before the recession began.”

Never before has such a high percentage of men in their prime years been so idle.

But since they are not counted as part of “the labor force”, the government bureaucrats can keep the “unemployment rate” looking nice and pretty.

Of course if we were actually using honest numbers, the unemployment rate would be in the double digits, our economy would be considered to have been in a recession since about 2005, and everyone would be crying out for an end to “the depression”.

And now we are rapidly approaching another downturn.  In my recent articles entitled “Has The Next Recession Already Begun For America’s Middle Class?” and “27 Huge Red Flags For The U.S. Economy“, I detailed much of the evidence for why this is true.

And those that run the Federal Reserve know all of this.

That is one of the reasons for all of the “quantitative easing” that they have been doing.  The folks at the Fed know that the U.S. economy would probably drift into a deflationary depression if they just sat back and did nothing.  So they flooded the system with money in a desperate attempt to revive economic activity.  But instead, most of the new money just ended up in the pockets of the very wealthy and further increased the divide between those at the top and those at the bottom in this country.

And now Fed officials are slowly scaling back quantitative easing because they apparently believe that the economy is getting “back to normal”.

We shall see.

Many are not quite so optimistic.

For example, the chief market analyst at the Lindsey Group, Peter Boockvar, believes that the S&P 500 could plummet 15 to 20 percent when quantitative easing finally ends.

Others believe that it will be much worse than that.

Since 2008, the size of the Fed balance sheet has grown from less than a trillion dollars to more than four trillion dollars.  This unprecedented intervention was able to successfully delay the coming deflationary depression, but it has also made our long-term problems far worse.

So when the inevitable crash does arrive, it will be much, much worse than it could have been.

Sadly, most Americans do not understand these things.  Most Americans simply trust that our “leaders” know what they are doing.  And so in the end, most Americans will be completely blindsided by what is coming.