The Number Of Working Age Americans Without A Job Has Risen By 27 MILLION Since 2000

Arrow Going UpDid you know that there are nearly 102 million working age Americans that do not have a job right now?  And 20 percent of all families in the United States do not have a single member that is employed.  So how in the world can the government claim that the unemployment rate has “dropped” to “6.3 percent”?  Well, it all comes down to how you define who is “unemployed”.  For example, last month the government moved another 988,000 Americans into the “not in the labor force” category.  According to the government, at this moment there are 9.75 million Americans that are “unemployed” and there are 92.02 million Americans that are “not in the labor force” for a grand total of 101.77 million working age Americans that do not have a job.  Back in April 2000, only 5.48 million Americans were unemployed and only 69.27 million Americans were “not in the labor force” for a grand total of 74.75 million Americans without a job.  That means that the number of working age Americans without a job has risen by 27 million since the year 2000.  Any way that you want to slice that, it is bad news.

Well, what about as a percentage of the population?

Has the percentage of working age Americans that have a job been increasing or decreasing?

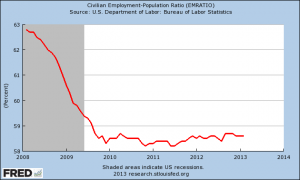
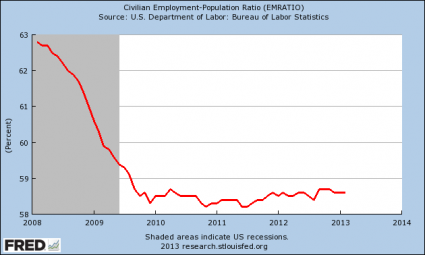
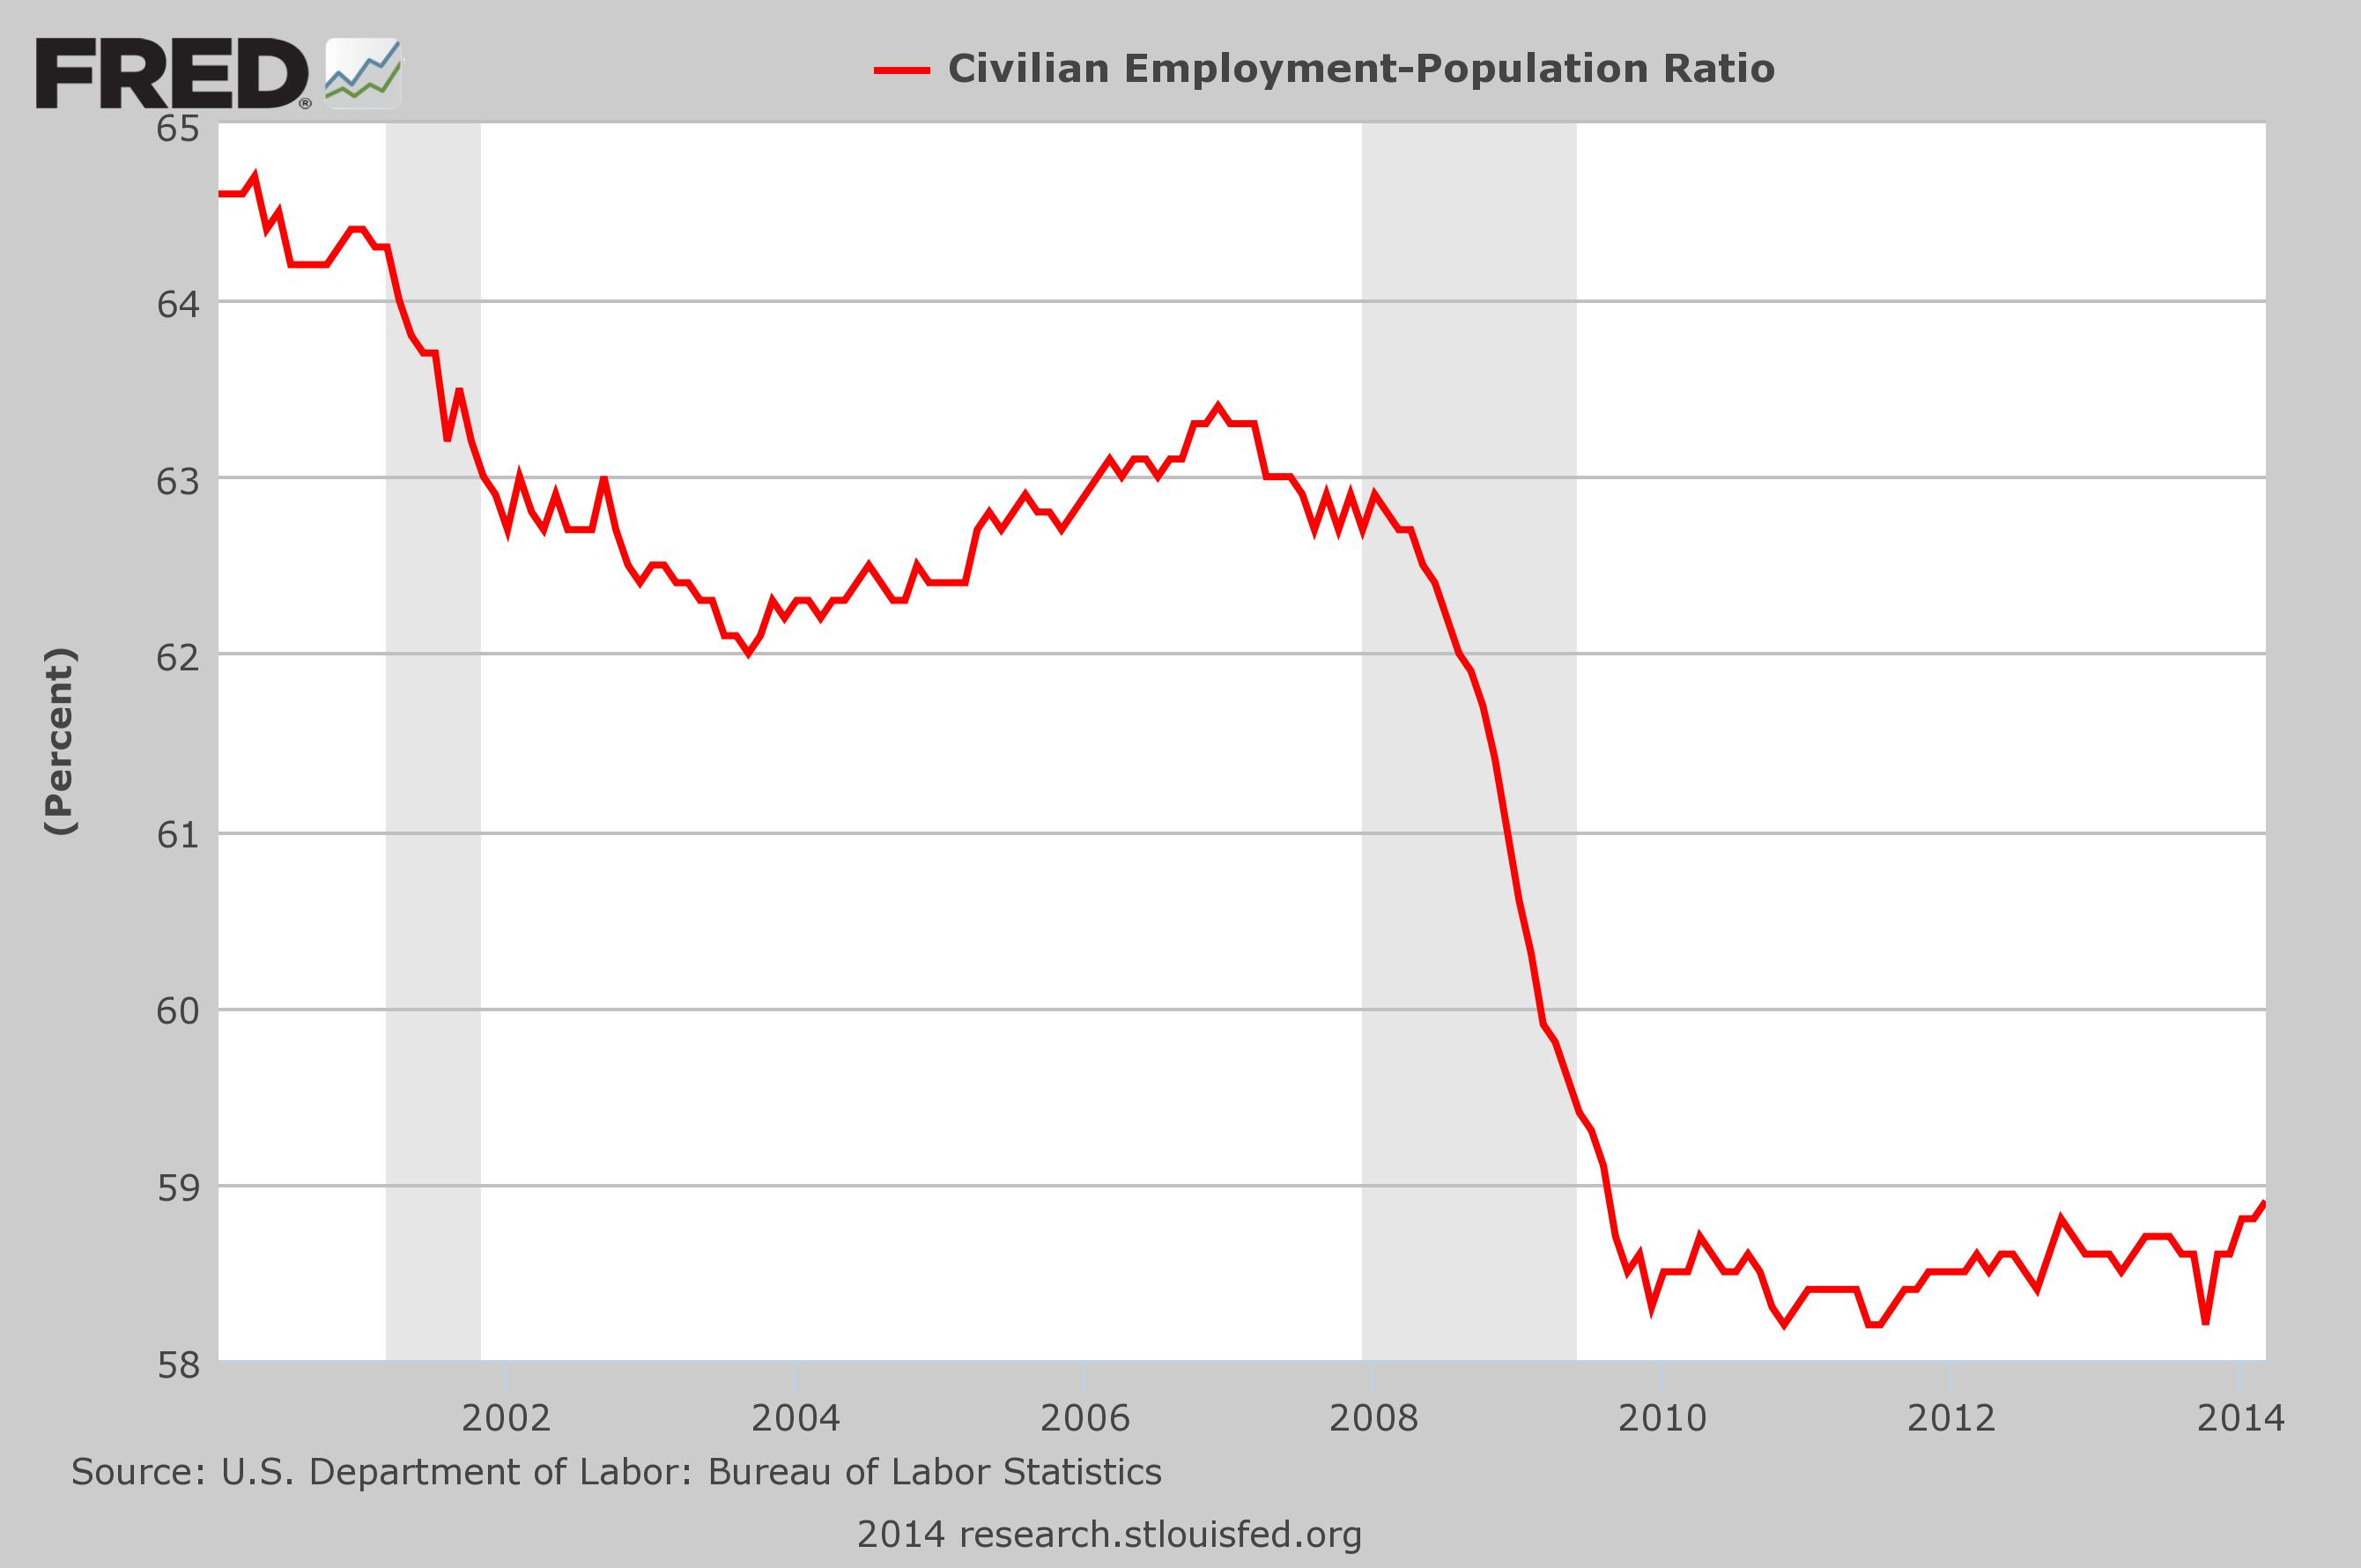
As you can see from the chart posted below, the percentage of working age Americans with a job has been in a long-term downward trend.  As the year 2000 began, we were sitting at 64.6 percent.  By the time the great financial crisis of 2008 struck, we were hovering around 63 percent.  During the last recession, we fell dramatically to under 59 percent and we have stayed there ever since…

Employment Population Ratio April 2014

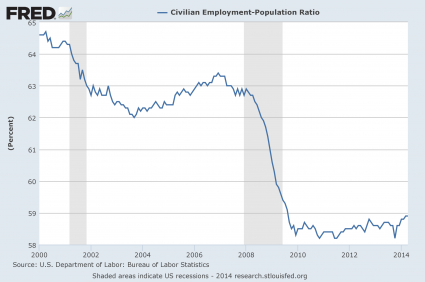
And the numbers behind this chart also show that employment in America did not increase last month.

In March, 58.9 percent of all working age Americans had a job.

In April, 58.9 percent of all working age Americans had a job.

Things are not getting worse (at least for the moment), but things are also definitely not getting better.

The month that Barack Obama entered the White House, we were in the midst of the worst economic downturn since the Great Depression and only 60.6 percent of all working age Americans had a job.

Since only 58.9 percent of all working age Americans have a job now, that means that the employment situation in America is still significantly worse than it was the day Barack Obama took office.

So don’t let anyone fool you with talk of an “employment recovery”.  It simply is not happening.  The official unemployment rate bears so little relation to economic reality at this point that it has essentially become meaningless.

Look, how in the world can we have an “unemployment rate” of just “6.3 percent” when 20 percent of all American families do n0t have a single member that is working?

Here is how that 20 percent figure was arrived at

A family, as defined by the BLS, is a group of two or more people who live together and who are related by birth, adoption or marriage. In 2013, there were 80,445,000 families in the United States and in 16,127,000—or 20 percent–no one had a job.

So if one out of every five families is completely unemployed, then why is the official government unemployment rate not up at Great Depression era levels?

Could it be that the government is manipulating the numbers to make them look much better than they actually are?

Why don’t they just go ahead and get it over with?  They can just define every American that is not working as “not in the labor force” and then we can have “0.0 percent unemployment”.  Then we can all have a giant party and celebrate how wonderful the U.S. economy is.

And don’t be fooled by the “288,000 jobs” that were added to the U.S. economy last month.  For workers under the age of 55, the number of jobs actually dropped by a whopping 259,000.

If we were using honest numbers, the official unemployment rate would look a lot scarier.  John Williams of shadowstats.com has calculated that the unemployment rate should be about 23 percent.  I don’t think that is too far off.

Meanwhile, the quality of the jobs in our economy continues to go down.  The House Ways and Means Committee says that seven out of every eight jobs that have been “added” to the economy under Barack Obama have been part-time jobs.  But you can’t raise a family or plan a career around a part-time job.  To be honest, it is very hard for a single person to even survive on a part-time wage in this economic environment.

As the quality of our jobs goes down, so do our incomes.  The median household income has declined for five years in a row, and the middle class is falling apart.

Without middle class incomes, you can’t have a middle class.  Considering what we have been watching happen, it should be no surprise that the homeownership rate in the United States has dropped to the lowest level in 19 years or that the number of Americans receiving money from the government each month exceeds the number of full-time workers in the private sector by more than 60 million.

For many more statistics like this, please see my previous article entitled “17 Facts To Show To Anyone That Believes That The U.S. Economy Is Just Fine“.

At a gut level, most Americans understand that things are much worse than they used to be.

The Pew Research Center recently asked people what “class” they consider themselves to be.  The results were shocking.

Back in 2008, only 25 percent of all Americans considered themselves to be “lower middle class” or “poor”.

Earlier this year, an astounding 40 percent of all Americans chose one of those designations.

We are in the midst of a long-term economic decline, and no amount of propaganda is going to change that.

But based on the “happy numbers” being trumpeted by the mainstream media, the Federal Reserve is slowly bringing their quantitative easing program to an end.

When quantitative easing is finally totally cut off, we shall see how the financial markets and the U.S. economy perform without artificial life support.

Personally, I don’t think that it is going to be pretty.

17 Facts To Show To Anyone That Believes That The U.S. Economy Is Just Fine

17No, the economy is most definitely not “recovering”.  Despite what you may hear from the politicians and from the mainstream media, the truth is that the U.S. economy is in far worse shape than it was prior to the last recession.  In fact, we are still pretty much where we were at when the last recession finally ended.  When the financial crisis of 2008 struck, it took us down to a much lower level economically.  Thankfully, things have at least stabilized at this much lower level.  For example, the percentage of working age Americans that are employed has stayed remarkably flat for the past four years.  We should be grateful that things have not continued to get even worse.  It is almost as if someone has hit the “pause button” on the U.S. economy.  But things are definitely not getting better, and there are a whole host of signs that this bubble of false stability will soon come to an end and that our economic decline will accelerate once again.  The following are 17 facts to show to anyone that believes that the U.S. economy is just fine…

#1 The homeownership rate in the United States has dropped to the lowest level in 19 years.

#2 Consumer spending for durable goods has dropped by 3.23 percent since November.  This is a clear sign that an economic slowdown is ahead.

#3 Major retailers are closing stores at the fastest pace that we have seen since the collapse of Lehman Brothers.

#4 According to the Bureau of Labor Statistics, 20 percent of all families in the United States do not have a single member that is employed.  That means that one out of every five families in the entire country is completely unemployed.

#5 There are 1.3 million fewer jobs in the U.S. economy than when the last recession began in December 2007.  Meanwhile, our population has continued to grow steadily since that time.

#6 According to a new report from the National Employment Law Project, the quality of the jobs that have been “created” since the end of the last recession does not match the quality of the jobs lost during the last recession…

  • Lower-wage industries constituted 22 percent of recession losses, but 44 percent of recovery growth.
  • Mid-wage industries constituted 37 percent of recession losses, but only 26 percent of recovery growth.
  • Higher-wage industries constituted 41 percent of recession losses, and 30 percent of recovery growth.

#7 After adjusting for inflation, men who work full-time in America today make less money than men who worked full-time in America 40 years ago.

#8 It is hard to believe, but 62 percent of all Americans make $20 or less an hour at this point.

#9 Nine of the top ten occupations in the U.S. pay an average wage of less than $35,000 a year.

#10 The middle class in Canada now makes more money than the middle class in the United States does.

#11 According to one recent study, 40 percent of all Americans could not come up with $2000 right now even if there was a major emergency.

#12 Less than one out of every four Americans has enough money put away to cover six months of expenses if there was a job loss or major emergency.

#13 An astounding 56 percent of all Americans have subprime credit in 2014.

#14 As I wrote about the other day, there are now 49 million Americans that are dealing with food insecurity.

#15 Ten years ago, the number of women in the U.S. that had jobs outnumbered the number of women in the U.S. on food stamps by more than a 2 to 1 margin.  But now the number of women in the U.S. on food stamps actually exceeds the number of women that have jobs.

#16 69 percent of the federal budget is spent either on entitlements or on welfare programs.

#17 The number of Americans receiving benefits from the federal government each month exceeds the number of full-time workers in the private sector by more than 60 million.

Taken individually, those numbers are quite remarkable.

Taken collectively, they are absolutely breathtaking.

Yes, things have been improving for the wealthy for the last several years.  The stock market has soared to new record highs and real estate prices in the Hamptons have skyrocketed to unprecedented heights.

But that is not the real economy.  In the real economy, the middle class is being squeezed out of existence.  The quality of our jobs is declining and prices just keep rising.  This reality was reflected quite well in a comment that one of my readers left on one of my recent articles

It is getting worse each passing month. The food bank I help out, has barely squeaked by the last 3 months. Donors are having to pull back, to take care of their own families. Wages down, prices up, simple math tells you we can not hold out much longer. Things are going up so fast, you have to adopt a new way of thinking. Example I just had to put new tires on my truck. Normally I would have tried to get by to next winter. But with the way prices are moving, I decide to get them while I could still afford them. It is the same way with food. I see nothing that will stop the upward trend for quite a while. So if you have a little money, and the space, buy it while you can afford it. And never forget, there will be some people worse off than you. Help them if you can.

And the false stock bubble that the wealthy are enjoying right now will not last that much longer.  It is an artificial bubble that has been pumped up by unprecedented money printing by the Federal Reserve, and like all bubbles that the Fed creates, it will eventually burst.

None of the long-term trends that are systematically destroying our economy have been addressed, and none of our major economic problems have been fixed.  In fact, as I showed in this recent article, we are actually in far worse shape than we were just prior to the last major financial crisis.

Let us hope that this current bubble of false stability lasts for as long as possible.

That is what I am hoping for.

But let us not be deceived into thinking that it is permanent.

It will soon burst, and then the real pain will begin.

33 Shocking Facts Which Show How Badly The Economy Has Tanked Since Obama Became President

Obama Follow MeBarack Obama has been running around the country taking credit for an “economic recovery”, but the truth is that things have not gotten better under Obama.  Compared to when he first took office, a smaller percentage of the working age population is employed, the quality of our jobs has declined substantially and the middle class has been absolutely shredded.  If we are really in the middle of an “economic recovery”, why is the homeownership rate the lowest that it has been in 18 years?  Why has the number of Americans on food stamps increased by nearly 50 percent while Obama has been in the White House?  Why has the national debt gotten more than 6 trillion dollars larger during the Obama era?  Obama should not be “taking credit” for anything when it comes to the economy.  In fact, he should be deeply apologizing to the American people.

And of course Obama is being delusional if he thinks that he is actually “running the economy”.  The Federal Reserve has far more power over the U.S. economy and the U.S. financial system than he does.  But the mainstream media loves to fixate on the presidency, so presidents always get far too much credit or far too much blame for economic conditions.

But if you do want to focus on “the change” that has taken place since Barack Obama entered the White House, there is no way in the world that you can claim that things have actually gotten better during that time frame.  The cold, hard reality of the matter is that the U.S. economy has been steadily declining for over a decade, and this decline has continued while Obama has been living at 1600 Pennsylvania Avenue.

It is getting very tiring listening to Obama supporters try to claim that Obama has improved the economy.  That is a false claim that is not even remotely close to reality.  The following are 33 shocking facts which show how badly the U.S. economy has tanked since Obama became president…

#1 When Barack Obama entered the White House, 60.6 percent of working age Americans had a job.  Today, only 58.7 percent of working age Americans have a job.

#2 Since Obama has been president, seven out of every eight jobs that have been “created” in the U.S. economy have been part-time jobs.

#3 The number of full-time workers in the United States is still nearly 6 million below the old record that was set back in 2007.

#4 It is hard to believe, but an astounding 53 percent of all American workers now make less than $30,000 a year.

#5 40 percent of all workers in the United States actually make less than what a full-time minimum wage worker made back in 1968.

#6 When the Obama era began, the average duration of unemployment in this country was 19.8 weeks.  Today, it is 36.6 weeks.

#7 During the first four years of Obama, the number of Americans “not in the labor force” soared by an astounding 8,332,000.  That far exceeds any previous four year total.

#8 According to the U.S. Census Bureau, the middle class is taking home a smaller share of the overall income pie than has ever been recorded before.

#9 When Obama was elected, the homeownership rate in the United States was 67.5 percent.  Today, it is 65.0 percent.  That is the lowest that it has been in 18 years.

#10 When Obama entered the White House, the mortgage delinquency rate was 7.85 percent.  Today, it is 9.72 percent.

#11 In 2008, the U.S. trade deficit with China was 268 billion dollars.  Last year, it was 315 billion dollars.

#12 When Obama first became president, 12.5 million Americans had manufacturing jobs.  Today, only 11.9 million Americans have manufacturing jobs.

#13 Median household income in America has fallen for four consecutive years.  Overall, it has declined by over $4000 during that time span.

#14 The poverty rate has shot up to 16.1 percent.  That is actually higher than when the War on Poverty began in 1965.

#15 During Obama’s first term, the number of Americans on food stamps increased by an average of about 11,000 per day.

#16 When Barack Obama entered the White House, there were about 32 million Americans on food stamps.  Today, there are more than 47 million Americans on food stamps.

#17 At this point, more than a million public school students in the United States are homeless.  This is the first time that has ever happened in our history.  That number has risen by 57 percent since the 2006-2007 school year.

#18 When Barack Obama took office, the average price of a gallon of regular gasoline was $1.85.  Today, it is $3.53.

#19 Electricity bills in the United States have risen faster than the overall rate of inflation for five years in a row.

#20 Health insurance costs have risen by 29 percent since Barack Obama became president, and Obamacare is going to make things far worse.

#21 The United States has fallen in the global economic competitiveness rankings compiled by the World Economic Forum for four years in a row.

#22 According to economist Tim Kane, the following is how the number of startup jobs per 1000 Americans breaks down by presidential administration

Bush Sr.: 11.3

Clinton: 11.2

Bush Jr.: 10.8

Obama: 7.8

#23 In 2008, that total amount of student loan debt in this country was 440 billion dollars.  At this point, it has shot up to about a trillion dollars.

#24 According to one recent survey, 76 percent of all Americans are living paycheck to paycheck.

#25 During Obama’s first term, the number of Americans collecting federal disability insurance rose by more than 18 percent.

#26 The total amount of money that the federal government gives directly to the American people has grown by 32 percent since Barack Obama became president.

#27 According to the Survey of Income and Program Participation conducted by the U.S. Census, well over 100 million Americans are enrolled in at least one welfare program run by the federal government.

#28 As I wrote about the other day, American households are now receiving more money directly from the federal government than they are paying to the government in taxes.

#29 Under Barack Obama, the velocity of money (a very important indicator of economic health) has plunged to a post-World War II low.

#30 At the end of 2008, the Federal Reserve held $475.9 billion worth of U.S. Treasury bonds.  Today, Fed holdings of U.S. Treasury bonds have skyrocketed past the 2 trillion dollar mark.

#31 When Barack Obama was first elected, the U.S. debt to GDP ratio was under 70 percent.  Today, it is up to 101 percent.

#32 During Obama’s first term, the federal government accumulated more new debt than it did under the first 42 U.S presidents combined.

#33 When you break it down, the amount of new debt accumulated by the U.S. government during Obama’s first term comes to approximately $50,521 for every single household in the United States.  Are you able to pay your share?

The Chart That Proves That The Mainstream Media Is Lying To You About Unemployment

Employment-Population Ratio 2013The mainstream media is absolutely giddy that the U.S. unemployment rate has hit a “four-year low” of 7.7 percent.  But is unemployment in the United States actually going down?  After all, you would think that it should be.  The Obama administration has “borrowed” more than 6 trillion dollars from future generations of Americans, interest rates have been pushed to all-time lows, and the Federal Reserve has been wildly printing more money in a desperate attempt to “stimulate” the economy.  So have those efforts been successful?  Well, according to the mainstream media, the U.S. unemployment rate is falling steadily.  Headlines all over the nation boldly declared that “236,000 jobs” were added to the economy in February, but what they didn’t tell you was that the number of Americans “not in the labor force” rose by 296,000.  And that is how they are getting the unemployment rate to go down – by pretending that huge numbers of unemployed Americans don’t want jobs.  Sadly, as you will see below, the truth is that the percentage of working age Americans that have a job is just 0.1% higher than it was exactly three years ago.  And we have not even come close to getting back to where we were before the last economic crisis.  For example, more than 146 million Americans were employed back in 2007.  But today, only 142.2 million Americans have a job even though our population has grown steadily since then.  So where in the world is this “economic recovery” that they keep talking about?

At this point, the “unemployment rate” has become so meaningless that it really isn’t even worth paying much attention to.  If you really want to know what the employment picture looks like in the United States, you need to look at the employment-population ratio.

As Wikipedia tells us, many economists consider the employment-population ratio to be far superior to other measurements of employment…

The Organization for Economic Co-operation and Development defines the employment rate as the employment-to-population ratio. The employment-population ratio is many American economist’s favorite gauge of the American jobs picture. According to Paul Ashworth, chief North American economist for Capital Economics, “The employment population ratio is the best measure of labor market conditions.” This is a statistical ratio that measures the proportion of the country’s working-age population (ages 15 to 64 in most OECD countries) that is employed. This includes people that have stopped looking for work.

A chart of the employment-population ratio in the United States over the past several years is posted below…

Employment-Population Ratio 2013

As you can see, the percentage of Americans with a job fell from about 63 percent to below 59 percent during the last economic crisis.  Since that time, it has not risen back above 59 percent.  This is the first time in the post-World War II era that we have not seen the employment rate bounce back following a recession.  At this point, the employment-population ratio has been below 59 percent for 42 months in a row.

Yes, we should be thankful that things have stabilized, but as you can see there has been no recovery.  The percentage of Americans with a job is essentially exactly where it was three years ago.  Despite the trillions of dollars that the U.S. government has borrowed, and despite the reckless money printing that the Federal Reserve has been doing, the employment situation in the U.S. has not turned around.

Data for the employment-population ratio from the beginning of 2008 is posted below…

2008-01-01 62.9
2008-02-01 62.8
2008-03-01 62.7
2008-04-01 62.7
2008-05-01 62.5
2008-06-01 62.4
2008-07-01 62.2
2008-08-01 62.0
2008-09-01 61.9
2008-10-01 61.7
2008-11-01 61.4
2008-12-01 61.0
2009-01-01 60.6
2009-02-01 60.3
2009-03-01 59.9
2009-04-01 59.8
2009-05-01 59.6
2009-06-01 59.4
2009-07-01 59.3
2009-08-01 59.1
2009-09-01 58.7
2009-10-01 58.5
2009-11-01 58.6
2009-12-01 58.3
2010-01-01 58.5
2010-02-01 58.5
2010-03-01 58.5
2010-04-01 58.7
2010-05-01 58.6
2010-06-01 58.5
2010-07-01 58.5
2010-08-01 58.5
2010-09-01 58.5
2010-10-01 58.3
2010-11-01 58.2
2010-12-01 58.3
2011-01-01 58.3
2011-02-01 58.4
2011-03-01 58.4
2011-04-01 58.4
2011-05-01 58.4
2011-06-01 58.2
2011-07-01 58.2
2011-08-01 58.3
2011-09-01 58.4
2011-10-01 58.4
2011-11-01 58.5
2011-12-01 58.6
2012-01-01 58.5
2012-02-01 58.6
2012-03-01 58.5
2012-04-01 58.5
2012-05-01 58.6
2012-06-01 58.6
2012-07-01 58.5
2012-08-01 58.4
2012-09-01 58.7
2012-10-01 58.7
2012-11-01 58.7
2012-12-01 58.6
2013-01-01 58.6
2013-02-01 58.6

So is there anyone out there that still wants to insist that the employment picture in the United States is getting significantly better?

Anyone that wants to claim that “unemployment is going down” should at least wait until the unemployment-population ratio gets back up to 59 percent.  Otherwise they just look foolish.

Yes, the Dow is at an all-time high right now.  But a bubble is always the biggest right before it bursts.

Most Americans understand that the Dow has been pumped up with all of the funny money that the Fed has been printing.  Most Americans understand that the stock market really does not accurately reflect the health of the U.S. economy as a whole.

Just consider these numbers…

-The number of homeless people sleeping in homeless shelters in New York City has increased by 19 percent over the past year.

-The number of Americans on food stamps has risen from 32 million to 47 million while Barack Obama has been in the White House.

-According to the U.S. Census Bureau, more than 146 million Americans are either “poor” or “low income” at this point.

-Median household income in the United States has fallen for four consecutive years.

No, the truth is that everything is most definitely not fine.

If everything is fine, then why did the Federal Reserve inject another 100 billion dollars into foreign banks during the last full week of February?

The U.S. government and the Federal Reserve are desperately trying to prop up the entire global economy.  Unfortunately, the global financial system has been built on a foundation of sand and the tide is coming in.

Back in 2008, a derivatives crisis was one of the primary causes of the worst financial panic since the Great Depression.

So did we learn our lesson?

No, the boys on Wall Street are back at it again as a recent article by Jim Armitage described…

Historically, stock markets, being driven by humans, have tended to have a similar length memory of catastrophes, before making the same dumb mistakes again.

But it hasn’t even been five years since derivatives (on that occasion based on daft mortgages) blew up the world, and yet these exotic creatures have already returned. With a vengeance.

Research from Thomson Reuters declared that banks were creating more derivatives known as asset-backed securities than at any time since before the Lehman Brothers crash. Of those, 22 percent were made up of – and forgive me the alphabet soup here – CDOs and CLOs. The very type of derivatives that exploded last time. At this stage last year, only 6 percent fell into those categories.

In other words, banks are creating more of the riskiest types of the riskiest products.

At some point, we will have another derivatives crisis even worse than the last one.

When that happens, financial markets all over the globe will crash, economic activity will grind to a standstill and unemployment will go skyrocketing once again.

But as you saw above, we have never even come close to recovering from the last crisis.

So you can believe the mind-numbing propaganda that the mainstream media is trying to feed you if you want.  Unfortunately, the reality of the matter is that we have not recovered from the last major economic crisis, and another one is rapidly approaching.

I hope that you are getting ready.

Retail Apocalypse: Why Are Major Retail Chains All Over America Collapsing?

Why Are Major Retail Chains All Over America Collapsing? -  Photo by Gars129If the economy is improving, then why are many of the largest retail chains in America closing hundreds of stores?  When I was growing up, Sears, J.C. Penney, Best Buy and RadioShack were all considered to be unstoppable retail powerhouses.  But now it is being projected that all of them will close hundreds of stores before the end of 2013.  Even Wal-Mart is running into problems.  A recent internal Wal-Mart memo that was leaked to Bloomberg described February sales as a “total disaster”.  So why is this happening?  Why are major retail chains all over America collapsing?  Is the “retail apocalypse” upon us?  Well, the truth is that this is just another sign that the U.S. economy is falling apart right in front of our eyes.  Incomes are declining, taxes are going up, government dependence is at an all-time high, and according to the Bureau of Labor Statistics the percentage of the U.S. labor force that is employed has been steadily falling since 2006.  The top 10% of all income earners in the U.S. are still doing very well, but most U.S. consumers are either flat broke or are drowning in debt.  The large disposable incomes that the big retail chains have depended upon in the past simply are not there anymore.  So retail chains all over the United States are now closing up unprofitable stores.  This is especially true in low income areas.

When you step back and take a look at the bigger picture, the rapid decline of some of our largest retail chains really is stunning.

It is happening already in some areas, but soon half empty malls and boarded up storefronts will litter the landscapes of cities all over America.

Just check out some of these store closing numbers for 2013.  These numbers are from a recent Yahoo Finance article

Best Buy

Forecast store closings: 200 to 250

Sears Holding Corp.

Forecast store closings: Kmart 175 to 225, Sears 100 to 125

J.C. Penney

Forecast store closings: 300 to 350

Office Depot

Forecast store closings: 125 to 150

Barnes & Noble

Forecast store closings: 190 to 240, per company comments

Gamestop

Forecast store closings: 500 to 600

OfficeMax

Forecast store closings: 150 to 175

RadioShack

Forecast store closings: 450 to 550

The RadioShack in a nearby town just closed up where I live.  This is all happening so fast that it is hard to believe.

But the truth is that those store closings are not the entire story.  When you dig deeper you find a lot more retailers that are in trouble.

For example, Blockbuster recently announced that this year they will be closing about 300 stores and eliminating about 3,000 jobs.

Toy manufacturer Hasbro recently announced that they will be reducing the size of their workforce by about 10 percent.

Even Wal-Mart is going through a tough stretch right now.  According to documents that were leaked to Bloomberg, Wal-Mart is having an absolutely disastrous February…

Wal-Mart Stores Inc. had the worst sales start to a month in seven years as payroll-tax increases hit shoppers already battling a slow economy, according to internal e-mails obtained by Bloomberg News.

“In case you haven’t seen a sales report these days, February MTD sales are a total disaster,” Jerry Murray, Wal- Mart’s vice president of finance and logistics, said in a Feb. 12 e-mail to other executives, referring to month-to-date sales. “The worst start to a month I have seen in my ~7 years with the company.”

So what in the world is going on here?

The mainstream media continues to proclaim that we are experiencing a robust “economic recovery”, but at the same time there are a whole host of indications that things are continually getting worse.

Even global cell phone sales actually declined slightly in 2012.  That was the first time that has happened since the last recession.

Perhaps it is time that we faced the truth.  The middle class is shrinking, incomes are declining and there are not nearly as many jobs as there used to be.

Mort Zuckerman pointed this out in a recent article in the Wall Street Journal

The U.S. labor market, which peaked in November 2007 when there were 139,143,000 jobs, now encompasses only 132,705,000 workers, a drop of 6.4 million jobs from the peak. The only work that has increased is part-time, and that is because it allows employers to reduce costs through a diminished benefit package or none at all.

So how can the mainstream media be talking about how “good” things are if we still have 6.4 million fewer jobs than we had back in November 2007?

And sadly, things may soon be getting a lot worse.  If Congress does not do anything about the “sequester”, millions of federal workers may shortly be facing some very painful furloughs according to CNN

Federal workers could start facing furloughs as early as April, according to federal agencies trying to prepare for the worst.

Unless Congress steps in, some $85 billion in massive spending reductions will hit the federal government, doling out furloughs to much of the nation’s 2.1 million federal workforce, experts say.

If you still live in an area of the country where the stores and the restaurants are booming, you should be very thankful because that is not the reality for most of the country.

I often write about the stunning economic decline of major cities such as Detroit, but there are huge sections of rural America that are in even worse shape than Detroit in many ways.

For example, many Indian reservations all over America have been shamefully neglected by the federal government and have become hotbeds for crime, drugs and poverty.

Business Insider recently profiled the Wind River Indian reservation in western Wyoming.  The following is a brief excerpt from that outstanding article

The Wind River Indian Reservation is not an easy place to get to, but I had to see it for myself.

Thirty-five-hundred square miles of prairie and mountains in western Wyoming, the reservation is home to bitter ancestral enemies: the Eastern Shoshone and Northern Arapaho tribes.

Even among reservations, it’s renowned for brutal crime, widespread drug use, and legal dumping of toxic waste.

You can see some amazing photos of the Wind River Indian reservation right here.

It is hard to believe that there are places like that in America, but the truth is that conditions like that are spreading to more U.S. communities with each passing day.

We are a nation that is in an advanced state of decline.  But as long as the financial markets are okay, our leaders don’t seem too concerned about the suffering that everyone else is going through.

In fact, former Federal Reserve Chairman Alan Greenspan essentially admitted as much during a recent interview with CNBC.  The following is how a Zero Hedge article summarized that interview…

Starting at around 1:50, Greenspan states the odds of sequester occurring are very high – in fact, the playdough-faced ex-Chair-head notes, “I find it very difficult to find a scenario in which [the sequester] doesn’t happen” But when asked how this will affect the economy, Awkward Alan is unusually clearly spoken – “the issue is how does it affect the stock market.”

While not so many of our leaders have taken the path to direct truthiness, Greenspan somewhat shocks a Botox’d and babbling Bartiromo when he admits “the stock market is the key player in the game of economic growth.”

Bartiromo shifts uncomfortably in her seat, strokes her imaginary beard and stares blankly as Greenspan explains that while the sequester will have a real effect on the real economy, “if the stock market can hold up through this, then the effect will be rather minor.”

Do you see?

As long as the stock market is moving higher they think that everything is just fine and dandy.

And the Obama administration?

They continue to pursue the same policies that got us into this mess.

Their idea of “economic reform” is to threaten to sue businesses that do not hire ex-convicts.

And of course now that Obama has been re-elected he is putting a tremendous amount of effort into “stimulating the economy”.

For example, he spent this weekend golfing in Florida, and the Obamas recently spent about 20 million taxpayer dollars vacationing in Hawaii.

Meanwhile, the U.S. economy is getting worse with each passing day.

If you doubt that economic conditions are getting worse, please read this article: “Show This To Anyone That Believes That ‘Things Are Getting Better’ In America“.

When you look at the cold, hard numbers, it is undeniable what is happening to America.

And our leaders are not doing anything to fix our problems.  In fact, most of the time they are just making things worse.

So buckle up and get prepared.  We are in for very bumpy ride, and this is only just the beginning.

Store Closed Until Further Notice - Photo by Gryllida

Shocking Numbers That Show The Media Is Lying To You About Unemployment In America

Shocking Numbers That Show The Media Is Lying To You About Unemployment In America - Photo by Larali21Did you know that the percentage of the U.S. labor force that is employed has continually been falling since 2006 according to the Bureau of Labor Statistics?  Did you know that the increase in the number of Americans “not in the labor force” during Barack Obama’s first four years in the White House was more than three times greater than the increase in the number of Americans “not in the labor force” during the entire decade of the 1980s?  The mainstream media would have us believe that 157,000 jobs were added to the U.S. economy in January.  Based on that news, the Dow broke the 14,000 barrier for the first time since October 2007.  But if you actually look at the “non-seasonally adjusted” numbers, the number of Americans with a job actually decreased by 1,446,000 between December and January.  But nowhere in the mainstream media did you hear that the U.S. economy lost more than 1.4 million jobs between December and January.  It is amazing the things that you can find out when you actually take the time to look at the hard numbers instead of just listening to the media spin.  Back in 2007, more than 146 million Americans were employed.  Today, only 141.6 million Americans are employed even though our population has grown steadily since then.  When the government and the media tell you that we are in a “recovery” and that unemployment is lower than it was a couple of years ago, I encourage you to dig deeper.  The truth is that even the government’s own numbers tell us that the percentage of the U.S. labor force that is employed continues to fall and that the U.S. economy is heading into a recession.  The Obama administration and the media have been lying to you about unemployment and about the true condition of our economy.  After you see the numbers that I have compiled in this article, I think that you will agree with me.

First of all, let’s take a look at the percentage of the civilian labor force that has been employed over the past several years.  These numbers come directly from the Bureau of Labor Statistics.  As you can see, this is a number that has been steadily falling since 2006…

2006: 63.1

2007: 63.0

2008: 62.2

2009: 59.3

2010: 58.5

2011: 58.4

In January, only 57.9 percent of the civilian labor force was employed.

Do the numbers above represent a positive trend or a negative trend?

Even a 2nd grader could answer that question.

So how in the world can the Obama administration and the mainstream media claim that the employment picture is getting better and that we are in a “recovery”?

But most Americans believe what they are told.  It is almost as if we are in some kind of a “matrix” where reality is defined by the corporate-controlled propaganda that is relentlessly pumped into our brains.

The only way that the government has been able to show a declining unemployment rate is by dumping massive numbers of Americans into the “not in the labor force” category.

Just check out how the number of Americans “not in the labor force” has absolutely skyrocketed in recent years…

2006: 77,387,000

2007: 78,743,000

2008: 79,501,000

2009: 81,659,000

2010: 83,941,000

2011: 86,001,000

In January, there were supposedly 89,868,000 Americans that were at least 16 years of age that were not in the labor force.

That number has risen by more than 8 million since Barack Obama first entered the White House, and that is highly unusual, because the number of Americans “not in the labor force” only increased by 2,518,000 during the entire decade of the 1980s.

You sure can get the numbers to look more “favorable” if you pretend that millions upon millions of American workers simply “don’t want a job” any longer.  The truth is that if the labor force participation rate was at the same level it was at when Barack Obama was first elected, the official unemployment rate would be well above 10 percent.

But that wouldn’t do at all, would it?  7.9 percent sounds so much nicer.

And of course even if you do have a job that does not mean that you are doing okay.

If you can believe it, in America today 41 percent of all workers make $20,000 a year or less.

To me, that is a mind blowing statistic.  It would be incredibly challenging for anyone to live on $20,000 a year, much less try to support a family.

If you live in Washington D.C. or New York City and you have a “good job” working for the establishment, you may not realize it, but there are tens of millions of American families that are really hurting out there.  According to the U.S. Census Bureau, more than 146 million Americans are either “poor” or “low income” at this point, and most of those people actually do have jobs.

For much more on the “working poor” in the United States, please see my previous article entitled “35 Statistics About The Working Poor In America That Will Blow Your Mind“.

If something is not done, the middle class will continue to disappear and poverty in America will continue to explode.

In a previous article, I noted that during Obama’s first term, the number of Americans on food stamps increased by an average of about 11,000 per day.

How bad do things have to get before people realize that we are living through a nightmare?

Sadly, most Americans still have faith in the system.

Most Americans are still convinced that our politicians will somehow find a way to turn things around.

Most Americans will gather around their television sets this weekend and watch the Super Bowl and laugh at all the funny commercials without even thinking about how America is literally falling apart all around them.

But there is one group of Americans that is acutely aware of how bad things have really gotten.  Small businesses have traditionally been the primary engine of job growth in this country, but right now small business owners all over the nation are facing a tremendous crisis.

Millions of small businesses are on the verge of extinction, and yet our politicians just continue to pile on more taxes, more rules and more regulations.

A recent Gallup poll found that 61 percent of all small business owners in America are “worried about the potential cost of healthcare”, and that an astounding 30 percent of all small business owners in America are not hiring and fear that they will go out of business within the next 12 months.

In a previous article entitled “We Are Witnessing The Death Of Small Business In America“, I detailed how small businesses in America are being systematically wiped out.  Small businesses are dying all around us, and the number of new small businesses continues to decline.

According to economist Tim Kane, the following is how the decline in the number of startup jobs per one thousand Americans breaks down by presidential administration

Bush Sr.: 11.3

Clinton: 11.2

Bush Jr.: 10.8

Obama: 7.8

Is that a good trend or a bad trend?

All of this is so simple that even the family pet should be able to figure it out, and yet most Americans seem oblivious to all of this.  They just keep gobbling up the mainstream media propaganda and they just continue to go out and wildly spend money.

It is almost as if we didn’t learn any lessons from 2008.

Even while household spending in Europe has moderated, household spending in the United States continues to soar.  Just check out the chart in this article.

And guess what?  The infamous “no money down mortgages” are back.  If we wait long enough, perhaps “interest only mortgages” will make a comeback as well.

Unfortunately, I am afraid that time is running out.  we have been living in the biggest debt bubble in the history of the world, and it is only a matter of time until it bursts.

2008 was just a “hiccup” compared to what is coming.  Our politicians and the Federal Reserve were able to keep the house of cards from completely crashing down back then, but they are not going to be able to avert the economic horror show that is rapidly approaching.

I hope that you are getting prepared.  Back in 2008, millions of Americans suddenly lost their jobs, and because many of them did not have any savings, many of them suddenly lost their homes.  One of the most important things that you can do to prepare for the coming crisis is to build up an emergency fund.  If things suddenly go bad, you don’t want to lose your house and everything that you have always worked for.

In addition, anything that you can do to become more self-sufficient and more independent of the system is a good thing, because the system is failing.  The years ahead are going to be much more chaotic than what we are experiencing right now, and when the next crisis strikes you will be very thankful for the time and the energy that you put into preparing.

So what are all of you seeing in your own areas?

Are businesses shutting down?

Are people having a hard time finding good jobs?

Please feel free to post a comment with your thoughts below…

Kitty Scared By Unemployment - Photo by shira gal

The Shocking Truth About Unemployment In America In One Chart

The mainstream media is not telling you the truth about unemployment in the United States.  The percentage of working age Americans that are employed is not increasing.  In March 2010, 58.5 percent of all working age Americans had a job.  In March 2012, 58.5 percent of all working age Americans had a job.  So if the employment rate is exactly the same as it was two years ago, then how in the world can the Obama administration claim that things have gotten significantly better since then?  According to the Bureau of Labor Statistics, the official unemployment rate in the United States was 9.8 percent in March 2010 and it declined to 8.2 percent in March 2012.  So how is this possible if the percentage of working age Americans that have jobs hasn’t moved?  Well, what they do is they claim that there are millions upon millions of Americans that have “left the labor force”.  In other words, they claim that there are millions upon millions of unemployed Americans that don’t want jobs anymore.  Of course that is a total farce, but the mainstream media and most Americans are buying it.  They actually believe that the unemployment rate is going down.  But the truth is that the unemployment crisis in America has not subsided.  In fact, we are pretty much exactly where we were two years ago, and things are about to get a whole lot worse.

If you want to know the shocking truth about unemployment in America, all you need to do is to look at one chart.  The chart posted below shows the change in the employment-population ratio over the past few years.  What the employment-population ratio measures is the percentage of working age Americans that actually have jobs.  As you can see, it fell dramatically during 2008 and 2009, and since then it has been hovering between 58 and 59 percent….

So there has been no employment recovery, and this is very odd because the employment-population ratio always bounces back after a recession.

The chart posted below shows how the employment-population ratio has changed since the late 1940s.  The shaded areas represent recessions.  Please take note that after every single recession (other than the current one) the employment-population ratio has always bounced back substantially.

During the most recent recession, the employment-population ratio fell farther than it had during any other recession in the post-World War II era.

If these were normal economic times, it would have been reasonable to expect a huge surge in hiring by now.

But we have not seen that.

Instead, the employment rate in the United States has been remarkably flat for more than two years.

So Barack Obama should not even begin to say anything at all about a “recovery” until the employment rate at least breaks the 59 percent barrier.

In the past I have written about how fraudulent the employment statistics put out by the federal government are.

Well, fortunately there are some folks up on Capitol Hill that are starting to take notice of this phenomenon as well.  There is a new bill in Congress that would change the way that the unemployment rate is calculated….

A Republican lawmaker is intensifying his push for legislation that would change how the government measures the unemployment rate. 

Rep. Duncan Hunter (R-Calif.) intends to press GOP leaders to move his bill to include the number of individuals who gave up looking for work in the percentage of jobless claims.

Of course there is probably not a chance that such a bill would ever get through the Senate, but at least some lawmakers are trying to get people to notice what is going on.

The sad truth of the matter is that the employment crisis in America is still about as bad as it was a couple of years ago.

Do you remember a couple of months ago when Barack Obama spoke with the wife of an unemployed engineer and asked her to send his resume to the White House?

Well, it turns out that the unemployed engineer still doesn’t have a job….

More than two months after President Barack Obama asked for Darin Wedel’s résumé, the phone is quiet, e-mails are no longer flooding in and the long-sought-after job interviews — which had begun to be scheduled — have petered out.

“Not even recruiting companies are calling anymore,” said Jennifer Wedel, the Fort Worth mother of two who chatted online this year with Obama about her out-of-work husband.

She says his job search has been hurt by a program to hire skilled foreign workers.

But Barack Obama is doing the same thing on a national level.

He is promising all of us that things are improving and that there will be lots of jobs for everyone soon, but it is all a lie.

The truth is that this period of relative stability that has been purchased by unprecedented levels of government debt will soon give way to even more economic trouble.

One of my readers recently brought to my attention a list of some of the major companies that are currently getting rid of workers….

Ford will be laying off 1,200 assembly line workers later on this month.

Pittsburgh-based paint and coating manufacturer PPG has announced that it will be laying off 2,000 workers.

J.C. Penney recently laid off 600 workers and has plans to lay off another 300 workers in July.

Lockheed Martin has announced that it will be laying off hundreds of workers.

Dow Chemical has announced that hundreds of workers are going to be laid off.

Yahoo has formally announced that it will be getting rid of about 2,000 workers.

Sony has announced plans to eliminate 10,000 jobs globally.

Even Oprah Winfrey is laying off workers.  Oprah is reducing the size of the staff at the OWN network by 20 percent.

Meanwhile, our economy continues to bleed jobs at an astounding pace.  At a time when American workers desperately need jobs, millions of them continue to be sent overseas.

In fact, even some jobs that you would think would be impossible to outsource are being given to foreigners.  Just recently, ABC News did a major report on all of the roads and bridges all over the United States that are being built by Chinese companies.  If you have not seen that report yet, you can view it online right here.

If you go into a Wal-Mart or a dollar store and you start turning over products you will find that huge numbers of them are made in China and that very few of them are made in the United States.  China is absolutely dominating us on the global economic stage.  Last year our trade deficit with China was the largest trade deficit that one nation has had with another nation in the history of the world.  Yet we continue to pursue the exact same trade policies year after year.

So how is the American economy ever supposed to recover if we continue to play to lose?

As a nation we spend far more than we make, we consume far more than we produce and our federal government implements thousands of new business-crippling regulations every single year.

If you still have a good job, you should treasure it and you should try to hold on to it for as long as you can.  Soon the next major economic downturn will be upon us and millions more Americans will lose their jobs and their homes.

Things did not have to turn out this way, but we made horribly bad decisions for decades and now the consequences are catching up with us.

You better get ready.