11 Red Flag Events That Just Happened As We Enter The Pivotal Month Of August 2015

Red Flags - Public DomainAre you ready for what is coming in August?  All over America, economic, political and social tensions are building, and the next 30 days could turn out to be pivotal.  In July, we saw things start to turn.  As you will read about below, a major six year trendline for the S&P 500 was finally broken this month, Chinese stocks crashed, commodities crashed, and debt problems started erupting all over the planet.  I fully expect that this next month (August) will be a month of transition as we enter an extremely chaotic time in the fall and winter.  Things are unfolding in textbook fashion for another major global financial crisis in the months ahead, and yet most people refuse to see what is happening.  In their blind optimism, they want to believe that things will somehow be different this time.  Well, the coming months will definitely reveal who was right and who was wrong.  The following are 11 red flag events that just happened as we enter the pivotal month of August 2015…

#1 Puerto Rico is going to default on a 58 million dollar debt payment that is due on Saturday.  Even though this has serious implications for the U.S. financial system, Barack Obama has said that there will be no bailout for “America’s Greece”.

#2 As James Bailey has pointed out, the most important trendline for the S&P 500 has finally been broken after holding up for six years.  This is a critical technical signal that will likely motivate a significant number of investors to sell off their holdings in the weeks ahead.

#3 The IMF is indicating that it will not take part in the new Greek debt deal.  As a result, the whole thing may completely fall apart

Leaked minutes of the fund’s latest board meeting, which took place on Wednesday, showed staff “cannot reach agreement at this stage” on whether to take part in the new €86bn (£60bn) bailout for Greece. The document said there were doubts over the capacity of the Athens Government to implement economic reforms, as well as the over the sustainability of the country’s sovereign debt pile, which is now projected to hit 200 percent of GDP.

The German Chancellor, Angela Merkel, only sanctioned a new Greek deal earlier this month on the condition that the IMF takes part.

#4 Italy is going down the exact same path as Greece, but Italy is going to be a much larger problem for Europe because it has a far, far larger economy.  This week, we learned that youth unemployment in Italy has reached a 38-year high of 44 percent, and Italy’s debt to GDP ratio has now hit 135 percent.

#5 The Canadian economy has officially entered a new recession.  This is something that was not supposed to happen.

#6 The price of oil plummeted close to 20 percent during the month of July.  It was the worst month for the price of oil that we have seen since October 2008, which just happened to be during the height of the last financial crisis.

#7 Commodities just had their worst month in almost four years.  As I have written about previously, we witnessed a collapse in commodity prices just before the stock market crash of 2008 too.

#8 Thanks to Barack Obama, the U.S. coal industry is imploding, and some of the largest coal producers in the entire country have just announced that they are declaring bankruptcy

On Thursday, Bloomberg reported that the biggest American producer of coking coal, Alpha Natural Resources, could file for bankruptcy as soon as Monday.

Competitor Walter Energy filed for bankruptcy earlier this month, and several others have done the same this year.

#9 For the month of July, the Shanghai Composite Index was down 13.4 percent.  Despite unprecedented government intervention to prop up the market, it was the worst month for Chinese stocks since October 2009.

#10 A major red flag that a recession in the United States is fast approaching is the fact that Exxon Mobile just announced their worst earnings for a single quarter since 2009.  Compared to the same time period one year ago, Exxon Mobile’s earnings were down 51 percent.

#11 Chevron is another oil giant that has seen earnings plunge.  In the second quarter of this year, Chevron’s earnings were down an eye-popping 90 percent from a year ago.

And in this list I didn’t even mention the economic chaos that is happening down in South America.  For full coverage of that, please see my previous article entitled “The South American Financial Crisis Of 2015“.

To a certain extent, I can understand why most Americans are not alarmed about the months ahead.  The relative stability of the past several years has lulled most of us into a false sense of security, and the mainstream media is assuring everyone that everything is going to be just fine and that brighter days are ahead.  At this point, many believe that it is patently absurd to suggest that we could see an economic collapse in 2015.  But of course even though the signs were glaringly apparent, very few of us anticipated the financial crisis of 2008 either.

A few weeks ago, I authored a piece entitled “The Last Days Of ‘Normal Life’ In America“, and I stand by every single word of that article.  I truly believe that the era of debt-fueled prosperity that we have been enjoying for so long is coming to an end, and our standard of living will never again get back to this level.

Just yesterday, I had the chance to go over and stock up on some emergency supplies at a dollar store.  It always astounds me what you can still buy for a dollar.  The combined cost of raw materials, manufacturing, packaging, shipping and retailing most of these items shouldn’t be less than a dollar, but thanks to having the reserve currency of the world we are still able to go to these big box stores and fill up our carts with lots and lots of extremely inexpensive merchandise.

Unfortunately, this massively inflated standard of living is going to come crashing to a halt.  This next financial crisis is going to destroy the system that is currently producing such comfortable lifestyles for the vast majority of us, and that will be an extremely painful experience.

So enjoy this summer for as long as it lasts.  Even though August threatens to be pivotal, it is going to be nothing compared to what will follow.

Fall and winter are coming.

Prepare while there is still time to do so.

Guess What Happened The Last Two Times The S&P 500 Was Up More Than 200% In Six Years?

Question Ball - Public DomainJust a few days ago, the bull market for the S&P 500 turned six years old.  This six year period of time has been great for investors, but what comes next?  On March 9th, 2009 the S&P 500 hit a low of 676.53.  Since that day, it has risen more than 200 percent.  As you will see below, there are only two other times within the last 100 years when the S&P 500 performed this well over a six year time frame.  In both instances, the end result was utter disaster. And as you take in this information, I want you to keep in mind what I said in my previous article entitled “7 Signs That A Stock Market Peak Is Happening Right Now“.  What we are witnessing at this moment is classic “peaking behavior”, and there is a long way to go down from here.  So if historical patterns hold up, those with lots of money in the stock market could soon be in for a whole lot of trouble.

According to Societe Generale analyst Andrew Lapthorne, there was an S&P 500 bull market run of more than 200 percent over a six year time period that ended in 1929.

We all know what happened that year.

And there was another S&P 500 bull market run of more than 200 percent over a six year time period that ended in 1999.  In the end, all of those gains were wiped out when the dotcom bubble burst.

And now we are near the end of another great bull market for the S&P 500.  The following is an excerpt from a recent Business Insider article

“Such a strong six year run up in US equities has only been seen twice since 1900, i.e., back in 1929 and 1999, neither of which ended well,” Lapthorne wrote.

It’s anyone’s guess what happens next. But Lapthorne and his colleagues have slanted bearish.

Best Six Year Performance

So how will this current bull market end?

Needless to say, a lot of people are not very optimistic about that right now.

And there was another very interesting bull market that ended in 1987

On Aug. 12, the S&P 500 dipped to 102.42, setting the stage for the third-biggest bull market in stocks since 1929. Inflation and unemployment fell. In 1984, President Reagan would cruise to reelection with an ad telling voters “It’s morning again in America.” By 1987, the stock market had tripled. Shareholders who were able to see beyond the gloom of the early 1980s reaped a huge return.

Of course a lot of those huge stock market returns were eliminated in a single day.  On October 19th, 1987 the Dow declined by more than 22 percent during a single trading session.  That day is still known as “Black Monday” up to this present time.

Markets tend to go down a lot faster than they go up.  So if your stock portfolio has gone up substantially over the past few years, good for you.  But keep in mind that all of your gains can be wiped out very rapidly.  Millions of people experienced this during the last financial crisis, and millions more will experience this during the next one.

And as I keep reminding people, so many of the exact same patterns that we witnessed just prior to the last great stock market collapse are happening once again.

For example, just yesterday I explained that there has been only one other time over the past decade when we have seen the U.S. dollar surge in value in such a short period of time.

That was in 2008, just prior to the last financial crisis.

Another example is what has happened to the price of oil.  Since the middle of last year, the price of oil has fallen by more than 50 dollars a barrel.

In all of history, that has happened only one other time.

That was in 2008, just prior to the last financial crisis.

I could go on and on.  I could talk about margin debt, price/earnings ratios, industrial commodities, etc.

But you know what?  Despite all of the warning signs there are still people out there that are eagerly pouring money into the stock market.

Back in 2005 and 2006, I knew people that were hurrying to buy homes before they got “priced out of the market”.  So they did everything that they could to scrape together down payments and they took on mortgages that were larger than they could really afford.

And in the end they got burned.

Today, people are doing similar things.  For instance, my friend Bob recently sent me an article that I could hardly believe.  It turns out that an “expert” on CNBC is encouraging people “to take out a 7 year loan with a rapidly amortizing asset as collateral in order to buy stocks.”

Yikes!

Let me be clear.  The really, really, really dumb money is jumping into the stock market right now.  Those that are pouring money into stocks today are really going to get hit hard when the crash comes.

And it isn’t just me saying this.

Just consider the words of billionaire hedge fund manager Crispin Odey

Mr Odey is best known for his big macroeconomic calls, including foreseeing the 2008 global credit crisis; piling into insurers in the wake of September 2001 attacks; and picking the recent oil price rout. He famously paid himself £28 million in 2008 after shorting credit crisis casualties, including British lender Bradford & Bingley. Mr Odey’s fund returned 54.8 per cent that year.

“The market’s reaction to all of this is leave it to the professionals, leave it to those great guys, the central bankers, because they saved the day in 2009,” he said. “These guys are kind of relying on central banks pulling a rabbit out of a hat.”

The risk is that this time, monetary policy may be ineffective: “We need the crisis to reformulate policy. Central banks are not all singing and all dancing, they cannot basically avoid the natural consequences of what we are doing.”

An inadequate supply-side response to the plunge in commodity prices as the resources industry declines to reduce production was in effect stimulating supply into falling demand.

“The trouble is today the players, whether they are the miners or the oil companies or the Saudis or anybody else, they are not doing the right things. This is the first time in my career where economics 101 doesn’t work at all.”

But it was also true that the world has not had a major recession for 25 years and thanks to frequent interventions, “there is a sensation we don’t have a business cycle”. Stocks are enjoying a six-year bull market but he also hinted at liquidity issues bubbling under the surface.

I just think that you and I have got grandstand seats here [to an imminent market shock] and my point is having found myself in the second quarter of last year selling a lot of equities and starting to go short, I found out just how illiquid it all was. You never actually see it until people try and get out of these things.”

It was unclear to Mr Odey what central banks could do to prevent a crash.

The warning signs are clear.

Soon the time for warning will be over and the crisis will be here.

I hope that you are getting ready.

7 Signs That A Stock Market Peak Is Happening Right Now

Stock Market Crash - Public DomainIs this the end of the last great run for the U.S. stock market?  Are we witnessing classic “peaking behavior” that is similar to what occurred just before other major stock market crashes?  Throughout 2014 and for the early stages of 2015, stocks have been on quite a tear.  Even though the overall U.S. economy continues to be deeply troubled, we have seen the Dow, the S&P 500 and the Nasdaq set record after record.  But no bull market lasts forever – particularly one that has no relation to economic reality whatsoever.  This false bubble of financial prosperity has been enjoyable, and even I wish that it could last much longer.  But there comes a time when we all must face reality, and the cold, hard facts are telling us that this party is about to end.  The following are 7 signs that a stock market peak is happening right now…

#1 Just before a stock market crash, price/earnings ratios tend to spike, and that is precisely what we are witnessing.  The following commentary and chart come from Lance Roberts

The chart below shows Dr. Robert Shiller’s cyclically adjusted P/E ratio. The problem is that current valuations only appear cheap when compared to the peak in 2000. In order to put valuations into perspective, I have capped P/E’s at 30x trailing earnings. The dashed orange line measures 23x earnings which has been the level where secular bull markets have previously ended. I have noted the peak valuations in periods that have exceeded that 30x earnings.

markets are cheap - StreetTalkLive

At 27.85x current earning the markets are currently at valuation levels where previous bull markets have ended rather than continued. Furthermore, the markets have exceeded the pre-financial crisis peak of 27.65x earnings. If earnings continue to deteriorate, market valuations could rise rapidly even if prices remain stagnant.

#2 The average bull market lasts for approximately 3.8 years. The current bull market has already lasted for six years.

#3 The median total gain during a bull market is 101.5 percent.  For this bull market, it has been 213 percent.

#4 Usually before a stock market crash we see a divergence between the relative strength index and the stock market itself.  This happened prior to the bursting of the dotcom bubble, it happened prior to the crash of 2008, and it is happening again right now

The first technical warning sign that we should heed is marked by a significant divergence between the relative strength index (RSI) and the market itself. This is noted by a declining pattern of lower highs in the RSI as stocks continue to make higher highs, a sign that the market is “topping out”. In the late ‘90s this divergence persisted for many years as the tech bubble reached epic valuation levels. In 2007 this divergence lasted over a much shorter period (6 months) before the market finally peaked and succumbed to massive selling. With last month’s strong rally to new records, we now have a confirmed divergence between the long-term relative strength index and the market’s price action.

#5 In the past, peaks in margin debt have been very closely associated with stock market peaks.  The following chart comes from Doug Short, and I included it in a previous article

Margin Debt

#6 As I have discussed previously, we usually witness a spike in 10 year Treasury yields just about the time that the stock market is peaking right before a crash.

Well, according to Business Insider, we just saw the largest 5 week rate rally in two decades…

Lots of guys and gals went home this past weekend thinking about the implications of the recent rise in the 10-year Treasury bond’s yield.

Chris Kimble notes it was the biggest 5-week rate rally in twenty years!

#7 A lot of momentum indicators seem to be telling us that we are rapidly approaching a turning point for stocks.  For example, James Stack, the editor of InvesTech Research, says that the Coppock Guide is warning us of “an impending bear market on the not-too-distant horizon”

A momentum indicator dubbed the Coppock Guide, which serves as “a barometer of the market’s emotional state,” has also peaked, Stack says. The indicator, which, “tracks the ebb and flow of equity markets from one psychological extreme to another,” is also flashing a warning flag.

The Coppock Guide’s chart pattern is flashing a “double top,”  which suggests that “psychological excesses are present” and that “secondary momentum has peaked” in this bull market, according to Stack.

“All of this is just another reason for concern about an impending bear market on the not-too-distant horizon,” Stack writes.

So if we are to see a stock market crash soon, when will it happen?

Well, the truth is that nobody knows for certain.

It could happen this week, or it could be six months from now.

In fact, a whole lot of people are starting to point to the second half of 2015 as a danger zone.  For example, just consider the words of David Morgan

“Momentum is one indicator and the money supply. Also, when I made my forecast, there is a big seasonality, and part of it is strict analytical detail and part of it is being in this market for 40 years. I got a pretty good idea of what is going on out there and the feedback I get. . . . I’m in Europe, I’m in Asia, I’m in South America, I’m in Mexico, I’m in Canada; and so, I get a global feel, if you will, for what people are really thinking and really dealing with. It’s like a barometer reading, and I feel there are more and more tensions all the time and less and less solutions. It’s a fundamental take on how fed up people are on a global basis. Based on that, it seems to me as I said in the January issue of the Morgan Report, September is going to be the point where people have had it.”

Time will tell if Morgan was right.

But without a doubt, lots of economic warning signs are starting to pop up.

One that is particularly troubling is the decline in new orders for consumer goods.  This is something that Charles Hugh-Smith pointed out in one of his recent articles…

The financial news is astonishingly rosy: record trade surpluses in China, positive surprises in Europe, the best run of new jobs added to the U.S. economy since the go-go 1990s, and the gift that keeps on giving to consumers everywhere, low oil prices.

So if everything is so fantastic, why are new orders cratering? New orders are a snapshot of future demand, as opposed to current retail sales or orders that have been delivered.

Posted below is a chart that he included with his recent article.  As you can see, the only time things have been worse in recent decades was during the depths of the last financial crisis…

Charles Hugh-Smith New Orders

To me, it very much appears that time is running out for this bubble of false prosperity that we have been living in.

But what do you think?  Please feel free to contribute to the discussion by posting a comment below…

10 Key Events That Preceded The Last Financial Crisis That Are Happening Again RIGHT NOW

10 Key Events That Preceded The Last Financial CrisisIf you do not believe that we are heading directly toward another major financial crisis, you need to read this article.  So many of the exact same patterns that preceded the great financial collapse of 2008 are happening again right before our very eyes.  History literally appears to be repeating, but most Americans seem absolutely oblivious to what is going on.  The mainstream media and our politicians are promising them that everything is going to be okay somehow, and that seems to be good enough for most people.  But the signs that another massive financial crisis is on the horizon are everywhere.  All you have to do is open up your eyes and look at them.

Bill Gross, considered by many to be the number one authority on government bonds on the entire planet, made headlines all over the world on Tuesday when he released his January Investment Outlook.  I don’t know if we have ever seen Gross be more negative about a new year than he is about 2015.  For example, just consider this statement

“When the year is done, there will be minus signs in front of returns for many asset classes. The good times are over.”

And this is how he ended the letter

And so that is why – at some future date – at some future Ides of March or May or November 2015, asset returns in many categories may turn negative. What to consider in such a strange new world? High-quality assets with stable cash flows. Those would include Treasury and high-quality corporate bonds, as well as equities of lightly levered corporations with attractive dividends and diversified revenues both operationally and geographically. With moments of liquidity having already been experienced in recent months, 2015 may see a continuing round of musical chairs as riskier asset categories become less and less desirable.

Debt supercycles in the process of reversal are not favorable events for future investment returns. Father Time in 2015 is not the babe with a top hat in our opening cartoon. He is the grumpy old codger looking forward to his almost inevitable “Ides” sometime during the next 12 months. Be cautious and content with low positive returns in 2015. The time for risk taking has passed.

So why are Gross and so many other financial experts being so “negative” right now?

It is because they can see what is happening.

They can see the same patterns that we saw in early 2008 unfolding again right in front of us.  I wanted to put these patterns in a single article so that they will be easy to share with people.  The following are 10 key events that preceded the last financial crisis that are happening again right now…

#1 A really bad start to the year for the stock market.  During the first three trading days of 2015, the S&P 500 was down a total of 2.73 percent.  There are only two times in history when it has declined by more than three percent during the first three trading days of a year.  Those years were 2000 and 2008, and in both years we witnessed enormous stock market declines.

#2 Very choppy financial market behavior.  This is something that I discussed yesterday.  In general, calm markets tend to go up.  When markets get choppy, they tend to go down.  For example, the chart that I have posted below shows how the Dow Jones Industrial Average behaved from the beginning of 2006 to the end of 2008.  As you can see, the Dow was very calm as it rose throughout 2006 and most of 2007, but it got very choppy as 2008 played out…

The Dow 2006 to 2008

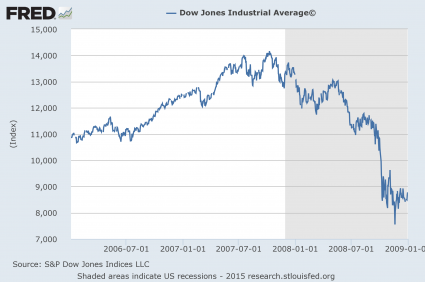
As I also mentioned yesterday, it is important not to get fooled if stocks soar on a particular day.  The three largest single day stock market gains in history were right in the middle of the financial crisis of 2008.  When you start to see big ups and big downs in the market, that is a sign of big trouble ahead.  That is why it is so alarming that global financial markets have begun to become quite choppy in recent weeks.

#3 A substantial decline for 10 year bond yields.  When investors get scared, there tends to be a “flight to safety” as investors move their money to safer investments.  We saw this happen in 2008, and that is happening again right now.

In fact, according to Bloomberg, global 10 year bond yields have already dropped to low levels that are absolutely unprecedented…

Taken together, the average 10-year bond yield of the U.S., Japan and Germany has dropped below 1 percent for the first time ever, according to Steven Englander, global head of G-10 foreign-exchange strategy at Citigroup Inc.

That’s not good news. The rock-bottom rates, which fall below zero when inflation is taken into account, show “that investors think we are going nowhere for a long time,” Englander wrote in a report yesterday.

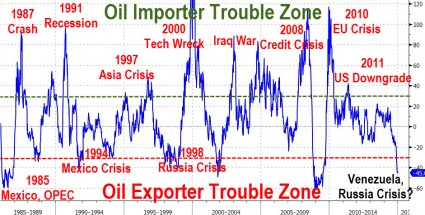
#4 The price of oil crashes.  As I write this, the price of U.S. oil has dipped below $48 a barrel.  But back in June, it was sitting at $106 at one point.  As the chart below demonstrates, there is only one other time in history when the price of oil has declined by more than $50 in less than a year…

Price Of Oil 2015

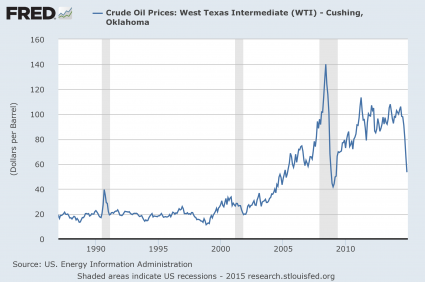
The only other time there has been an oil price collapse of this magnitude we experienced the greatest financial crisis since the Great Depression shortly thereafter.  Are we about to see history repeat?  For much more on this, please see my previous article entitled “Guess What Happened The Last Time The Price Of Oil Crashed Like This?

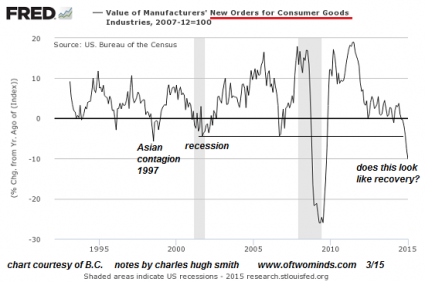
#5 A dramatic drop in the number of oil and gas rigs in operation.  Right now, oil and gas rigs are going out of operation at a frightening pace.  During the fourth quarter of 2014, 93 oil and gas rigs were idled, and it is being projected that another 200 will shut down this quarter.  As this Business Insider article demonstrates, this is also something that happened during the financial crisis of 2008 and it continued well into 2009.

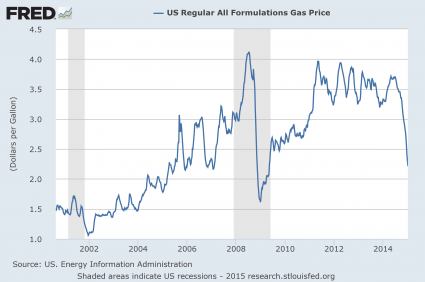
#6 The price of gasoline takes a huge tumble.  Millions of Americans are celebrating that the price of gasoline has plummeted in recent weeks.  But they were also celebrating when it happened back in 2008 as well.  But of course it turned out that there was really nothing to celebrate in 2008.  In short order, millions of Americans lost their jobs and their homes.  So the chart that I have posted below is definitely not “good news”…

Gas Price 2015

#7 A broad range of industrial commodities begin to decline in price.  When industrial commodities go down in price, that is a sign that economic activity is slowing down.  And just like in 2008, that is what we are watching unfold on the global stage right now.  The following is an excerpt from a recent CNBC article

From nickel to soybean oil, plywood to sugar, global commodity prices have been on a steady decline as the world’s economy has lost momentum.

For an extended discussion on this, please see my recent article entitled “Not Just Oil: Guess What Happened The Last Time Commodity Prices Crashed Like This?

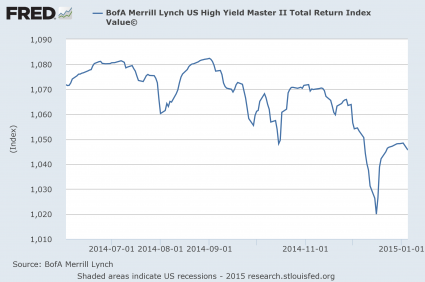
#8 A junk bond crash.  Just like in 2008, we are witnessing the beginnings of a junk bond collapse.  High yield debt related to the energy industry is on the bleeding edge of this crash, but in recent weeks we have seen investors start to bail out of a broad range of junk bonds.  Check out this chart and this chart in addition to the chart that I have posted below…

High Yield Debt 2015

#9 Global inflation slows down significantly.  When economic activity slows down, so does inflation.  This is something that we witnessed in 2008, this is also something that is happening once again.  In fact, it is being projected that global inflation is about to fall to the lowest level that we have seen since World War II

Increases in the prices of goods and services in the world’s largest economies are slowing dramatically. Analysts are predicting that inflation will fall below 2pc in all of the countries that make up the G7 group of advanced nations this year – the first time that has happened since before the Second World War.

Indeed, Japan was the only G7 country whose inflation rate was above 2pc last year. And economists believe that was because its government increased sales tax which had the effect of artificially boosting prices.

#10 A crisis in investor confidence.  Just prior to the last financial crisis, the confidence that investors had that we would be able to avoid a stock market collapse in the next six months began to decline significantly.  And guess what?  That is something else that is happening once again…

Investor confidence that the US will avoid a stock-market crash in the next six months has dropped dramatically since last spring.

The Yale School of Management publishes a monthly Crash Confidence Index. The index shows the proportion of investors who believe we will avoid a stock-market crash in the next six months.

Yale points out that “crash confidence reached its all-time low, both for individual and institutional investors, in early 2009, just months after the Lehman crisis, reflecting the turmoil in the credit markets and the strong depression fears generated by that event, and is plausibly related to the very low stock market valuations then.”

Are you starting to get the picture?

And of course I am not the only one warning about these things.  As I wrote about earlier in the week, there are a whole host of prominent voices that are now warning of imminent financial danger.

Today, I would like to add one more name to the list.  He is respected author James Howard Kunstler, and what he predicts is coming in 2015 is absolutely chilling

*****

Here are my financial forecast particulars for 2015:

  • Early in 2015 the ECB proposes a lame QE program and is laughed out of the room. European markets tank.
  • Greek elections in January produce a government that stands up to the EU and ECB and causes a fatal slippage of faith in the ability of that project to continue.
  • Second half of 2015, the rest of the world gangs up and counter-attacks the US dollar.
  • Bond markets in Europe implode in first half and the contagion spreads to the US as fear and distrust rises about viability of US safe haven status.
  • Derivatives associated with currencies, interest rates, and junk bonds trigger a bloodbath in credit default swaps (CDS) and the appearance of countless black holes through which debt and “wealth” disappear forever.
  • US stock markets continue to bid upward in the first half of 2015, crater in Q3 as faith in paper and pixels erodes. DJA and S & P fall 30 to 40 percent in the initial crash, then further into 2016.
  • Gold and silver slide in the first half, then take off as debt and equity markets craters, faith in abstract instruments evaporates, faith in central bank omnipotence dissolves, and citizens all over the world desperately seek safety from currency war.
  • Goldman Sachs, Citicorp, Morgan Stanley, Bank of America, DeutscheBank, SocGen, all succumb to insolvency. American government and Federal Reserve officials don’t dare attempt to rescue them again.
  • By the end of 2015, central banks everywhere stand in general discredit. In the US, the Federal Reserve’s mandate is publically debated and revised back to its original mission as lender of last resort. It is forbidden to engage in further interventions and a new less-secretive mechanism is drawn up for regulating basic interest rates.
  • Oil prices creep back into the $65 – $70 range by May 2015. It is not enough to halt the destruction in the shale, tar sand, and deepwater sectors. As contraction in the failing global economy accelerates, oil sinks back to the $40 range in October…
  • …unless mischief in the Middle East (in particular, the Islamic State messing with Saudi Arabia) leads to gross and perhaps fatally permanent disruption in world oil markets — and then all bets are off for both the continuity of advanced economies and for peace between nations.

*****

Personally, I don’t agree with Kunstler on all of the particulars and the timing of certain events, but overall I think that we are going to look back when the year is done and say that he was a lot more right than he was wrong.

We are moving into a time of extreme danger for the global economy.  There has never been a time when I have been more concerned about a new year since I began The Economic Collapse Blog back in 2009.

Over the past couple of years, we have been very blessed to be able to enjoy a bubble of relative stability.  But this period of stability also fooled many people into thinking that our economic problems had been fixed, when in reality they have only gotten worse.

We consume far more wealth than we produce, our debt levels are at record highs and we are at the tail end of the largest Wall Street financial bubble in all of history.

It is inevitable that we are heading for a tragic conclusion to all of this.  It is just a matter of time.
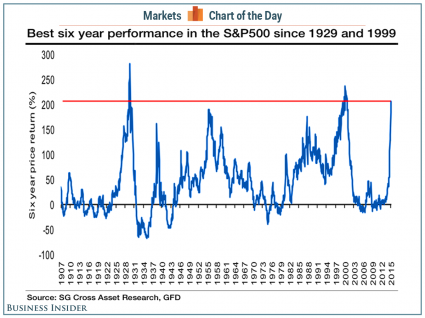
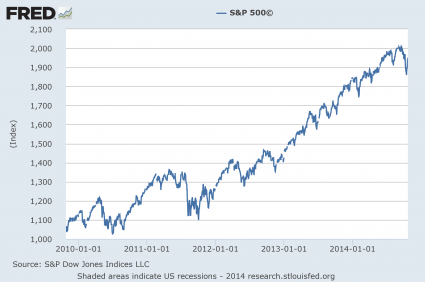
 

Oil Falls Below 50 As Global Financial Markets Begin To Unravel

Crisis Silhouette - Public DomainOn Monday, the price of oil fell below $50 for the first time since April 2009, and the Dow dropped 331 points.  Meanwhile, the stock market declines over in Europe were even larger on a percentage basis, and the euro sank to a fresh nine year low on concerns that the anti-austerity Syriza party will be victorious in the upcoming election in Greece.  These are precisely the kinds of things that we would expect to see happen if a global financial crash was coming in 2015.  Just prior to the financial crisis of 2008, the price of oil collapsed, prices for industrial commodities got crushed and the U.S. dollar soared relative to other currencies.  All of those things are happening again.  And yet somehow many analysts are still convinced that things will be different this time.  And I agree that things will indeed be “different” this time.  When this crisis fully erupts, it will make 2008 look like a Sunday picnic.

Another thing that usually happens when financial markets begin to unravel is that they get really choppy.  There are big ups and big downs, and that is exactly what we have witnessed since October.

So don’t expect the markets just to go in one direction.  In fact, it would not be a surprise if the Dow went up by 300 or 400 points tomorrow.  During the initial stages of a financial crash, there are always certain days when the markets absolutely soar.

For example, did you know that the three largest single day stock market advances in history were right in the middle of the financial crash of 2008?  Here are the dates and the amount the Dow rose each of those days…

October 13th, 2008: +936 points

October 28th, 2008: +889 points

November 13th, 2008: +552 points

Just looking at those three days, you would assume that the fall of 2008 was the greatest time ever for stocks.  But instead, it was the worst financial crash that we have seen since the days of the Great Depression.

So don’t get fooled by the volatility.  Choppy markets are almost always a sign of big trouble ahead.  Calm waters usually mean that the markets are going up.

In order to avoid a major financial crisis in the near future, we desperately need the price of oil to rebound in a substantial way.

Unfortunately, it does not look like that is going to happen any time soon.  There is just way too much oil being produced right now.  The following is an excerpt from a recent CNBC article

The Morgan Stanley strategists say there are new reports of unsold West and North African cargoes, with much of the oil moving into storage. They also note that new supply has entered the global market with additional exports coming from Russia and Iraq, which is reportedly seeing production rising to new highs.

Since June, the price of oil has plummeted close to 55 percent.  If the price of oil stays where it is right now, we are going to see large numbers of small producers go out of business, the U.S. economy will lose millions of jobs, billions of dollars of junk bonds will go bad and trillions of dollars of derivatives will be in jeopardy.

And the lower the price of oil goes, the worse our problems are going to get.  That is why it is so alarming that some analysts are now predicting that the price of oil could hit $40 later this month

Some traders appeared certain that U.S. crude will hit the $40 region later in the week if weekly oil inventory numbers for the United States on Wednesday show another supply build.

‘We’re headed for a four-handle,’ said Tariq Zahir, managing member at Tyche Capital Advisors in Laurel Hollow in New York. ‘Maybe not today, but I’m sure when you get the inventory numbers that come out this week, we definitely will.’

Open interest for $40-$50 strike puts in U.S. crude have risen several fold since the start of December, while $20-$30 puts for June 2015 have traded, said Stephen Schork, editor of Pennsylvania-based The Schork Report.

The only way that the price of oil has a chance to move back up significantly is if global production slows down.  But instead, production just continues to increase in the short-term thanks to projects that were already in the works.  As a result, analysts from Morgan Stanley say that the oil glut is only going to intensify

Morgan Stanley analysts said new production will continue to ramp up at a number of fields in Brazil, West Africa, Canada and in the U.S. Gulf of Mexico as well as U.S. shale production. Also, the potential framework agreement with Iran could mean more Iranian oil on the market.

Yes, lower oil prices mean that we get to pay less for gasoline when we fill up our vehicles.

But as I have written about previously, anyone that believes that lower oil prices are good for the U.S. economy or for the global economy as a whole is crazy.  And these sentiments were echoed recently by Jeff Gundlach

Oil is incredibly important right now. If oil falls to around $40 a barrel then I think the yield on ten year treasury note is going to 1%. I hope it does not go to $40 because then something is very, very wrong with the world, not just the economy. The geopolitical consequences could be – to put it bluntly – terrifying.

If the price of oil does not recover, we are going to see massive financial problems all over the planet and the geopolitical stress that this will create will be unbelievable.

To expand on this point, I want to share an excerpt from a recent Zero Hedge article.  As you can see, a rapid rise or fall in the price of oil almost always correlates with a major global crisis of some sort…

Large and rapid rises and falls in the price of crude oil have correlated oddly strongly with major geopolitical and economic crisis across the globe. Whether driven by problems for oil exporters or oil importers, the ‘difference this time’ is that, thanks to central bank largesse, money flows faster than ever and everything is more tightly coupled with that flow.

Oil Crisis Chart - Zero Hedge

So is the 45% YoY drop in oil prices about to ’cause’ contagion risk concerns for the world?

And without a doubt, we are overdue for another stock market crisis.

Between December 31st, 1996 and March 24th, 2000 the S&P 500 rose 106 percent.

Then the dotcom bubble burst and it fell by 49 percent.

Between October 9th, 2002 and October 9th, 2007 the S&P 500 rose 101 percent.

But then that bubble burst and it fell by 57 percent.

Between March 9th, 2009 and December 31st, 2014 the S&P 500 rose an astounding 204 percent.

When this bubble bursts, how far will it fall this time?


If Everything Is Just Fine, Why Are So Many Really Smart People Forecasting Economic Disaster?

Apocalyptic Disaster - Public DomainThe parallels between the false prosperity of 2007 and the false prosperity of 2014 are rather striking.  If we go back and look at the numbers in the fall of 2007, we find that the Dow set an all-time high in October, margin debt on Wall Street had spiked to record levels, the unemployment rate was below 5 percent and Americans were getting ready to spend a record amount of money that Christmas season.  But then the very next year the worst economic crisis since the Great Depression shook the entire planet and everyone wondered why most people never saw it coming.  Well, now a similar pattern is unfolding right before our eyes.  The Dow and the S&P 500 both hit record highs on Monday, margin debt on Wall Street is hovering near record levels, the unemployment rate has ticked down a little bit and Americans are getting ready to spend more than 600 billion dollars this Christmas season.  The truth is that the economy seems pretty stable for the moment, and most people cannot even imagine that an economic collapse is coming.  So why are so many really smart people forecasting economic disaster in the near future?

For example, just consider what the Jerome Levy Forecasting Center is saying.  This is an organization with a tremendous economic forecasting record that goes all the way back to the Great Depression.  In fact, it predicted ahead of time the financial trouble and the recession that would happen in 2008.  Well, now this company is forecasting that there is a 65 percent chance that there will be a global recession by the end of next year…

In 1929, a businessman and economist by the name of Jerome Levy didn’t like what he saw in his analysis of corporate profits. He sold his stocks before the October crash.

Almost eight decades later, the consultancy company that bears his name declared “the next recession will be caused by the deflating housing bubble.” By February 2007, it predicted problems in the subprime-mortgage market would spread “to virtually all financial markets.” In October 2007, it saw imminent recession — the slump began two months later.

The Jerome Levy Forecasting Center, based in Mount Kisco, New York, and run by Jerome’s grandson David, is again more worried than its peers. Its half-dozen analysts attach a 65 percent probability of a worldwide recession forcing a contraction in the U.S. by the end of next year.

Could they be wrong?

It’s certainly possible.

But I wouldn’t bet against them.

John Hussman is another expert that is warning of financial disaster on the horizon.  He believes that we are experiencing a massive stock market bubble right now and that stocks are approximately double the value that they should be

If you look at corporate profits and especially corporate profit margins, they’re one of the most cyclical and mean-reverting series in economics. Right now, we have corporate profits that are close to about 11% of GDP, but if you look at that series you will find that corporate profits as a share of GDP have always dropped back to about 5.5% or below in every single economic cycle including recent decades, including not only the financial crisis but 2002 and every other economic cycle we have been in.

Right now stocks as a multiple of last year’s expected earnings may look only modestly over valued or modestly richly valued. Really if you look at the measures of valuation that are most correlated to the returns that stocks deliver over time say over seven years or over the next 10 years the S&P 500 in our estimation is about double the level of valuation that would give investors a normal rate of return.

Could you imagine the chaos that would ensue if stocks really did drop by 50 percent?

Well, Hussman says that this is precisely what must happen in order for stock prices to return to historical norms…

Right now, like I say, we are looking at stocks that have been pressed to long-term expected returns that are really dismal. But more important than that, in every market cycle that we’ve seen with the mild exception of 2002, we’ve seen stocks price revert back to normal rates of return. In order to get to that point from here, we would have to have equities drop by about half.

If that does happen, it will make the crisis of 2008 look like a Sunday picnic.

Meanwhile, other very prominent thinkers are also warning that an economic nightmare is rapidly approaching.

Economic cycle theorist Martin Armstrong foresees major economic problems in 2015 which will ultimately lead to “civil unrest”  in 2016

It looks more and more like a serious political uprising will erupt by 2016 once the economy turns down. That is the magic ingredient. Turn the economy down and you get civil unrest and revolution.

And of course there are a whole lot of other economic cycle theorists that are forecasting that we are about to experience a massive economic downturn as well.  For much more on this, please see this article and this article.

What is truly frightening is that we have never even come close to recovering from the last economic crisis.  One poll that was taken just prior to the recent election found that only 28 percent of Americans said that their families were doing better financially.  In addition, here are some more survey numbers about how Americans are feeling about the economy

According to voter exit polls conducted by CNN, 78% said they are worried about the economy, with 69% saying that, in their view, economic conditions are not good. 65% responded that the country is on the wrong track vs. only 31% who believed that it is headed in the right direction.

Even though we are repeating so many of the same patterns that we experienced back in 2007, we are doing so with a fundamentally weaker economy.  The last crisis did a tremendous amount of permanent damage to us.  For an extensive look at this, please see my previous article entitled “12 Charts That Show The Permanent Damage That Has Been Done To The U.S. Economy“.

And there are lots of signs that much of the planet is already entering another major economic slowdown.  In a recent article, Brandon Smith summarized some of these.  He says that we are currently witnessing “the last gasp of the global economy“…

Global exports, and thus consumer demand, are plunging. Germany, the only pillar left to prop up the failing European Union, has experienced a severe decline in exports not seen since 2009.

China, the largest exporter and importer in the world, and Chinese companies, have been caught in a number of instances using fraudulent invoices to artificially inflate their own export numbers, in some cases reporting 50% more exported goods than had actually existed.

China’s manufacturing has also declined for the past five months, exposing the nature of its inflated export stats and indicating a global slowdown.

The Baltic Dry Index, a measure of global shipping rates for raw goods, and thus a measure of demand for shipping, continues to drag along near historic lows.

The U.S. consumer (the only economic asset the U.S. has besides the dollar’s world reserve status), has seen declines in spending as well as wages.

In the meantime, long term jobless Americans continue to fall off welfare rolls by the millions, making unemployment numbers look good, but the overall future picture look terrible as participation rates dissolve into the ether of government statistics.

How is such poverty being hidden? Foodstamps. Plain and simple. Nearly 50 million Americans now subsist on food stamp programs today, and this number shows no signs of dropping. In states like Illinois, two people sign up for food assistance for every citizen that happens to find a job.

From time to time, I get accused of “spreading fear” and of being obsessed with “doom and gloom”.

But that is not the case at all.

I actually want our economy to stay stable for as long as possible.  Many Americans don’t realize this, but even the poorest of us live in luxury compared to much of the rest of the world.  It would be wonderful if we could all live out our lives in peace and quiet and safety.

Unfortunately, it is simply not going to happen.

And it does not take an expert to see what is coming.

Anyone with half a brain should be able to see the economic disaster that is approaching.

There is hope in understanding what is happening and there is hope in getting prepared.  Millions of Americans that are willingly blind to our problems are going to have their lives absolutely destroyed when they get blindsided by the coming crisis.  So please use this brief period of relative stability to get prepared and to warn others.

Once this false bubble of hope runs out, all of our lives are going to dramatically change.

Most People Cannot Even Imagine That An Economic Collapse Is Coming

Thinking - Public DomainThe idea that the United States is on the brink of a horrifying economic crash is absolutely inconceivable to most Americans.  After all, the economy has been relatively stable for quite a few years and the stock market continues to surge to new heights.  On Friday, the Dow and the S&P 500 both closed at brand new all-time record highs.  For the year, the S&P 500 is now up 9 percent and the Nasdaq is now up close to 11 percent.  And American consumers are getting ready to spend more than 600 billion dollars this Christmas season.  That is an amount of money that is larger than the entire economy of Sweden.  So how in the world can anyone be talking about economic collapse?  Yes, many will concede, we had a few bumps in the road back in 2008 but things have pretty much gotten back to normal since then.  Why be concerned about economic collapse when there is so much stability all around us?

Unfortunately, this brief period of stability that we have been enjoying is just an illusion.

The fundamental problems that caused the financial crisis of 2008 have not been fixed.  In fact, most of our long-term economic problems have gotten even worse.

But most Americans have such short attention spans these days.  In a world where we are accustomed to getting everything instantly, news cycles only last for 48 hours and 2008 might as well be an eternity ago.

In the United States today, our entire economic system is based on debt.

Without debt, very little economic activity happens.  We need mortgages to buy our homes, we need auto loans to buy our vehicles and we need our credit cards to do our shopping during the holiday season.

So where does all of that debt come from?

It comes from the banks.

In particular, the “too big to fail banks” are the heart of this debt-based system.

Do you have a mortgage, an auto loan or a credit card from one of these “too big to fail” institutions?  A very large percentage of the people that will read this article do.

And a lot of people might not like to hear this, but without those banks we essentially do not have an economy.

When Lehman Brothers collapsed in 2008, it almost resulted in the meltdown of our entire system.  The stock market collapsed and we experienced an absolutely wicked credit crunch.

Unfortunately, that was just a small preview of what is coming.

Even though a few prominent “experts” such as New York Times columnist Paul Krugman have declared that the “too big to fail” problem is “over”, the truth is that it is now a bigger crisis than ever before.

Compared to five years ago, the four largest banks in the country are now almost 40 percent larger.  The following numbers come from a recent article in the Los Angeles Times

Just before the financial crisis hit, Wells Fargo & Co. had $609 billion in assets. Now it has $1.4 trillion. Bank of America Corp. had $1.7 trillion in assets. That’s up to $2.1 trillion.

And the assets of JPMorgan Chase & Co., the nation’s biggest bank, have ballooned to $2.4 trillion from $1.8 trillion.

At the same time that those banks have been getting bigger, 1,400 smaller banks have completely disappeared from the banking industry.

That means that we are now more dependent on these gigantic banks than ever.

At this point, the five largest banks account for 42 percent of all loans in the United States, and the six largest banks account for 67 percent of all assets in our financial system.

If someone came along and zapped those banks out of existence, our economy would totally collapse overnight.

So the health of this handful of immensely powerful banking institutions is absolutely critical to our economy.

Unfortunately, these banks have become deeply addicted to gambling.

Have you ever known people that allowed their lives to be destroyed by addictions that they could never shake?

Well, that is what is happening to these banks.  They have transformed Wall Street into the largest casino in the history of the world.  Most of the time, their bets pay off and they make lots of money.

But as we saw back in 2008, when they miscalculate things can fall apart very rapidly.

The bets that I am most concerned about are known as “derivatives“.  In essence, they are bets about what will or will not happen in the future.  The big banks use very sophisticated algorithms that are supposed to help them be on the winning side of these bets the vast majority of the time, but these algorithms are not perfect.  The reason these algorithms are not perfect is because they are based on assumptions, and those assumptions come from people.  They might be really smart people, but they are still just people.

If things stay fairly stable like they have the past few years, the algorithms tend to work very well.

But if there is a “black swan event” such as a major stock market crash, a collapse of European or Asian banks, a historic shift in interest rates, an Ebola pandemic, a horrific natural disaster or a massive EMP blast is unleashed by the sun, everything can be suddenly thrown out of balance.

Acrobat Nik Wallenda has been making headlines all over the world for crossing vast distances on a high-wire without a safety net.  Well, that is essentially what our “too big to fail” banks are doing every single day.  With each passing year, these banks have become even more reckless, and so far there have not been any serious consequences.

But without a doubt, someday there will be.

What would you say about a bookie that took $200,000 in bets but that only had $10,000 to cover those bets?

You would certainly call that bookie a fool.

But that is what our big banks are doing.

Right now, JPMorgan Chase has more than 67 trillion dollars in exposure to derivatives but it only has 2.5 trillion dollars in assets.

Right now, Citibank has nearly 60 trillion dollars in exposure to derivatives but it only has 1.9 trillion dollars in assets.

Right now, Goldman Sachs has more than 54 trillion dollars in exposure to derivatives but it has less than a trillion dollars in assets.

Right now, Bank of America has more than 54 trillion dollars in exposure to derivatives but it only has 2.2 trillion dollars in assets.

Right now, Morgan Stanley has more than 44 trillion dollars in exposure to derivatives but it has less than a trillion dollars in assets.

Most people have absolutely no idea how incredibly vulnerable our financial system really is.

The truth is that these “too big to fail” banks could collapse at any time.

And when they fail, our economy will fail too.

So let us hope and pray that this brief period of false stability lasts for as long as possible.

Because when it ends, all hell is going to break loose.

How Will The Stock Market React To The End Of Quantitative Easing?

Stock Market Crash - Public DomainIt is widely expected that the Federal Reserve is going to announce the end of quantitative easing this week.  Will this represent a major turning point for the stock market?  As you will see below, since 2008 stocks have risen dramatically throughout every stage of quantitative easing.  But when the various phases of quantitative easing have ended, stocks have always responded by declining substantially.  The only thing that caused stocks to eventually start rising again was a new round of quantitative easing.  So what will happen this time?  That is a very good question.  What we do know is that the the performance of the stock market has become completely divorced from economic reality, and in recent weeks there have been signs of market turmoil that we have not seen in years.  Could the end of quantitative easing be the thing that finally pushes the financial markets over the edge?

After all this time, many Americans still don’t understand what quantitative easing actually is.  Since the end of 2008, the Federal Reserve has injected approximately 3.5 trillion dollars into the financial system.  Of course the Federal Reserve didn’t actually have 3.5 trillion dollars.  The Fed created all of this money out of thin air and used it to buy government bonds and mortgage-backed securities.

If that sounds like “cheating” to you, that is because it is cheating.  If you or I tried to print money, we would be put in prison.  When the Federal Reserve does it, it is called “economic stimulus”.

But the overall economy has not been helped much at all.  If you doubt this, just look at these charts.

Instead, what all of this “easy money” has done is fuel the greatest stock market bubble in history.

As you can see from the chart below, every round of quantitative easing has driven the S&P 500 much higher.  And when each round of quantitative easing has finally ended, stocks have declined substantially

Chart By DayOnBay

And of course the chart above tells only part of the story.  Since April 2013, the S&P 500 has gone much higher…

S&P 500

If someone from another planet looked at that chart, they would be tempted to think that the U.S. economy must be expanding like crazy.

But of course that is not happening.

This market binge has been solely fueled by reckless money printing by the Federal Reserve.  It is not backed up by economic fundamentals in any way, shape or form.

And now that quantitative easing is ending, many are wondering if the party is over.

For example, just check out what CNN is saying about the matter…

Even in this bull market, all good things must come to an end.

The Federal Reserve is expected to close a chapter in history this week and announce the conclusion of its massive stimulus program. Known as quantitative easing, the program is widely credited with driving investors back into stocks in the aftermath of the financial crisis.

“I think to some extent quantitative easing has provided an assurance to investors that (has) kept them optimistic,” said Bruce McCain, Chief Investment Strategist of Key Private Bank in Cleveland, Ohio. “Now we’re going to have to see whether investors can ride without training wheels.”

Everyone knows that quantitative easing was a massive gift to those that own stocks.

So how will the stock market respond now that the monetary heroin is ending?

We shall see.

Meanwhile, deflationary pressures are already starting to take hold around the rest of the globe.  The following is an excerpt from a recent Reuters report

After months of focus on slack in U.S. labor markets, the Federal Reserve faces a new challenge: the possibility that weak inflation may be so firmly entrenched it upends the return to normal monetary policy.

The soft global inflation backdrop, from sliding oil prices to stagnant wages in advanced economies, has triggered debate over whether the Fed and its peers merely need to wait for a slow-motion business cycle to improve, or face a shift in the underlying nature of inflation after the global recession.

That uncertainty has become the Fed’s chief concern in recent weeks, likely to shape upcoming policy statements and delay even further the moment when interest rates, pinned near zero for nearly six years, will start rising again.

If the Federal Reserve and other global central banks were not printing money like mad, the global economy would have almost certainly entered a deflationary depression by now.

But all the Federal Reserve and other global central banks have done is put off the inevitable and make our long-term problems even worse.

Instead of fixing the fundamental problems that caused the great financial crash of 2008, the central bankers decided to try to paper over our problems instead.  They flooded the global financial system with easy money, but today our financial system is shakier than ever.

In fact, we just learned that 10 percent of the biggest banks in Europe have failed their stress tests and must raise more capital…

The European Central Bank says 13 of Europe’s 130 biggest banks have flunked an in-depth review of their finances and must increase their capital buffers against losses by 10 billion euros ($12.5 billion).

The ECB said 25 banks in all were found to need stronger buffers — but that 12 have already made up their shortfall during the months in which the ECB was carrying out its review. The remaining 13 now have two weeks to tell the ECB how they plan to increase their capital buffers.

Most people do not realize how vulnerable our financial system truly is.  It is essentially a pyramid of debt and credit that could fall apart at any time.

Right now, the “too big to fail” banks account for 42 percent of all loans and 67 percent of all banking assets in the United States.

Without those banks, we essentially do not have an economy.

But instead of being careful, those banks have taken recklessness to unprecedented heights.

At this moment, five of the “too big to fail” banks each have more than 40 trillion dollars of exposure to derivatives.

Most Americans don’t even understand what derivatives are, but when the next great financial crisis strikes we are going to be hearing a whole lot about them.

The big banks have transformed Wall Street into the biggest casino in the history of the planet, and there is no way that this is going to end well.

A great collapse is coming.

It is just a matter of time.