Nearly 102 Million Americans Do Not Have A Job Right Now – Worse Than At Any Point During The Last Recession

Wouldn’t it be horrible if the number of Americans without a job was higher today than it was during the Great Recession of 2008 and 2009?  Well, that is actually true.  As you will see below, nearly 102 million Americans do not have a job right now, and at no point during the last recession did that number ever surpass the 100 million mark.  Of course the U.S. population has grown a bit over the last decade, but as you will see below, the percentage of the population that is engaged in the labor force is only slightly above the depressingly low levels from the last recession.  Sadly, the truth is that the rosy employment statistics that you are getting from the mainstream media are manufactured using smoke and mirrors, and by the time you are done reading this article you will understand what is really going on.

Before we dig into the long-term trends, let’s talk about what we just learned.

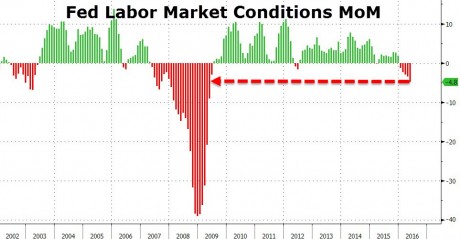
According to CNBC, initial claims for unemployment benefits just rose by the most that we have seen in 19 months

Initial claims for state unemployment benefits jumped 37,000 to a seasonally adjusted 230,000 for the week ended April 20, the Labor Department said on Thursday. The increase was the largest since early September 2017.

And considering all of the other troubling economic signs that we have been witnessing lately, this makes perfect sense.

In addition, we need to remember that over the last decade lawmakers across the country have made it more difficult to apply for unemployment benefits and have reduced the amount of time that unemployed workers can receive them.  In reality, the unemployment situation in this nation is far worse than the mainstream media is telling us.

When a working age American does not have a job, the federal number crunchers put them into one of two different categories.  Either they are categorized as “unemployed” or they are categorized as “not in the labor force”.

But you have to add both of those categories together to get the total number of Americans that are not working.

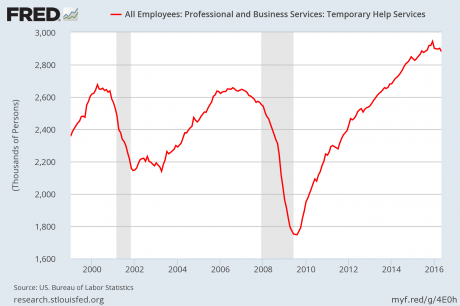
Over the last decade, the number of Americans that are in the “unemployed” category has been steadily going down, but the number of Americans “not in the labor force” has been rapidly going up.

In both cases we are talking about Americans that do not have a job.  It is just a matter of how the federal government chooses to categorize those individuals.

At this moment, we are told that only 6.2 million Americans are officially “unemployed”, and that sounds really, really good.

But that is only half the story.

What the mainstream media rarely mentions is the fact that the number of Americans categorized as “not in the labor force” has absolutely exploded since the last recession.  Right now, that number is sitting at 95.577 million.

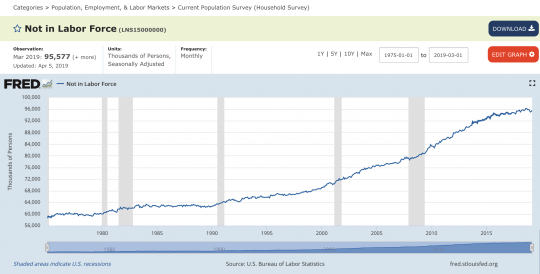
When you add 6.2 million “officially unemployed” Americans to 95.577 million Americans that are categorized as “not in the labor force”, you get a grand total of almost 102 million Americans that do not have a job right now.

If that sounds terrible to you, that is because it is terrible.

Yes, the U.S. population has been growing over the last decade, and that is part of the reason why the number of Americans “not in the labor force” has been growing.

But overall, the truth is that the level of unemployment in this country is not that much different than it was during the last recession.

John Williams of shadowstats.com tracks what the real employment figure would be if honest numbers were being used, and according to him the real rate of unemployment in the United States at the moment is 21.2 percent.

That is down from where it was a few years ago, but not by that much.

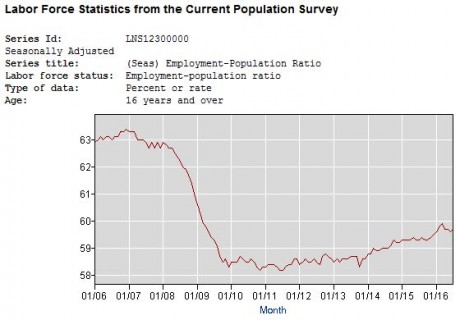
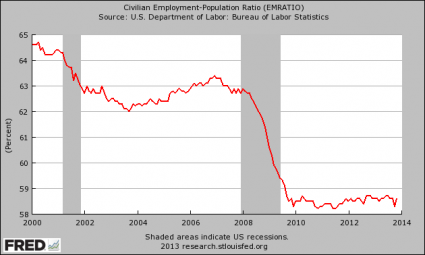
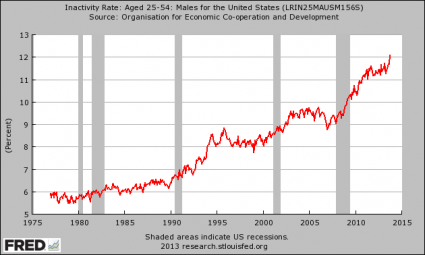
Another “honest” indicator that I like to look at is the civilian labor force participation rate.

In essence, it tells us what percentage of the working age population is actually engaged in the labor force.

Just before the last recession, the civilian labor force participation rate was sitting at about 66 percent, and that was pretty good.

But then the recession hit, and the civilian labor force participation rate fell below 63 percent, and it stayed between 62 percent and 63 percent for an extended period of time.

So where are we today?

At this moment, we are sitting at just 63.0 percent.

Does that look like a recovery to you?

Of course not.

If you would like to claim that we have had a very marginal “employment recovery” since the last recession, that is a legitimate argument to make.  But anything beyond that is simply not being honest.

And now the U.S. economy is rapidly slowing down again, and most Americans are completely and totally unprepared for what is ahead.

The good news is that employment levels have been fairly stable in recent years, but the bad news is that unemployment claims are starting to shoot up again.

A number of the experts that I am hearing from expect job losses to escalate in the months ahead.  Many of those that are currently living on the edge financially suddenly won’t be able to pay their mortgages or their bills.

Just like the last recession, we could potentially see millions of middle class Americans quickly lose everything once economic conditions start getting really bad.

The economy is not going to get any better than it is right now.  As you look forward to the second half of 2019, I would make plans for rough sailing ahead.

Get Prepared NowAbout the author: Michael Snyder is a nationally-syndicated writer, media personality and political activist. He is the author of four books including Get Prepared Now, The Beginning Of The End and Living A Life That Really Matters. His articles are originally published on The Economic Collapse Blog, End Of The American Dream and The Most Important News. From there, his articles are republished on dozens of other prominent websites. If you would like to republish his articles, please feel free to do so. The more people that see this information the better, and we need to wake more people up while there is still time.

Why The Jobs Report Is Not Nearly As Strong As You Are Being Told

Jobs Unemployment Main Street - Public DomainHappy days are here again? On Friday, the mainstream media was buzzing with the news that the U.S. economy had added 255,000 jobs during the month of July. But as you will see below, the U.S. economy did not add 255,000 jobs during the month of July. In fact, without an extremely generous “seasonal adjustment”, the number of jobs added during the month of July would not have even kept up with population growth. But the pretend number sounds so much better than the real number, and so the pretend number is what is being promoted for public consumption.

Why doesn’t the government ever just tell us the plain facts? Unfortunately, we live at a time when “spin” is everything, and just about everyone in the mainstream media seemed quite pleased with the “good jobs report” on Friday. However, as Zero Hedge has pointed out, the truth is that the “unadjusted” numbers tell a very different story…

As Mitsubishi UFJ strategist John Herrmann wrote in a note shortly after the report, the “jobs headline overstates” strength of payrolls. He adds that the unadjusted data show a “middling report” that’s “nowhere as strong as the headline” and adds that private payrolls unadjusted +85k in July vs seasonally adjusted +217k.

In Herrmann’s view, the government applied a “very benign seasonal adjustment factor upon private payrolls to transform a soft private payroll gain into a strong gain.”

He did not provide a reason why the government would do that.

Every month, the U.S. economy must create at least 150,000 new jobs just to keep up with population growth. According to the unadjusted numbers, we did not hit that threshold, and so the employment situation in this country actually got worse last month.

In America today, there are 7.8 million Americans that are considered to be officially unemployed, and another 94.3 million working age Americans that are considered to be “not in the labor force”.

When you add those two numbers together, you get a grand total of 102 million working age Americans that do not have a job right now.

Rather than focusing on the headline “unemployment” figure, we get a much fairer look at the employment crisis in the United States when we examine the employment-population ratio. The following chart comes directly from the Bureau of Labor Statistics, and it shows that the percentage of Americans that are employed has never even come close to getting back to where it was just prior to the last recession…

Employment-Population Ratio 2016

Over the past couple of years we have seen a slight bump in this number, and that is good, but normally after a recession ends the employment-population ratio goes back to at least as high as it was before.  Unfortunately, this has not happened after the last two recessions.  The following comes from Wolf Richter

The ratio always drops during recessions, but before 2001, it always climbed to higher highs during the recoveries. The 2001 recession and subsequent recovery changed this. For the first time, the ratio never fully recovered, never got even close to fully recovering. That was a new phenomenon: employment growth could no longer keep up with population growth.

When the Great Recession hit, the ratio plunged from its lower starting point at the fastest pace on record (going back to 1948). The Fed’s efforts were all focused exclusively on bailing out bondholders, re-inflating the stock market, re-inflating the housing market, and generally creating what had become the official Fed policy at the time, the Wealth Effect (here’s Bernanke himself explaining it). This has re-inflated asset prices – many of them way beyond their prior bubble peaks.

But the Fed’s astounding focus on capital accelerated the already changing dynamics of the economy, at the expense of labor.

Even the Wall Street Journal admits that we are in the weakest “economic recovery” since 1949, and now there are lots of signs that we have entered a brand new economic downturn.  Here are just a few examples from Chad Shoop

  • Ford, GM and Chrysler — three of the U.S.’ largest auto companies — reported sales for July that missed estimates: down 3%, 1.9% and up 0.3%, respectively.
  • Delta Airlines, one of the largest airlines in the world, said revenue fell 7% in July as part of its monthly performance update.
  • Macy’s, the biggest department store company, reported a decline in sales for July, leading to more aggressive markdowns and an industry-wide sell-off.

And lots of ominous signs continue to pop up on Wall Street as well.  For one thing, the Libor rate has surged to the highest level since the last financial crisis.  If you are not familiar with Libor, here is a pretty good explanation of it from Business Insider

The Libor, or London Interbank Offered Rate, measures the interest rate at which banks lend to each other at different durations, and its sharp jump was a harbinger of the financial crisis.

And according to that same article, the Libor rate is now the highest that we have seen since early 2009

In the past month, the Libor rate has spiked to rates not seen since the first quarter of 2009, the heart of the banking meltdown.

Not to mention, the spread between the Libor and the Overnight Index Swap rate, which tracks the lending rate from the Federal Reserve, has widened, another potentially worrying sign.

But of course I have been quoting facts and figures like this for months, and yet U.S. financial markets continue to hold it together.

There are literally dozens of parallels between the global financial crisis of 2008 and what is happening in 2016, but Wall Street continues to defy the laws of economics.

Of course it won’t last forever, but it certainly has been a sight to behold.

And I am certainly not alone in my analysis.  As I noted the other day, DoubleLine Capital CEO Jeffrey Gundlach is entirely convinced that stocks “should be down massively”…

“The artist Christopher Wool has a word painting, ‘Sell the house, sell the car, sell the kids.’ That’s exactly how I feel – sell everything. Nothing here looks good,” Gundlach said in a telephone interview. “The stock markets should be down massively but investors seem to have been hypnotized that nothing can go wrong.”

For the moment, investors continue to pay extremely irrational prices for stocks, and the mainstream media is just giddy about the state of the economy.

So let us enjoy this very strange period of stability for however much longer it lasts, but let us also protect ourselves from the horrible crash that will inevitably follow.

Something Big That Always Happens Right Before The Official Start Of A Recession Has Just Happened

Temporary Help ServicesWhat you are about to see is major confirmation that a new economic downturn has already begun.  Last Friday, the government released the worst jobs report in six years, and that has a lot of people really freaked out.  But when you really start digging into those numbers, you quickly find that things are even worse than most analysts are suggesting.  In particular, the number of temporary jobs in the United States has started to decline significantly after peaking last December.  Why this is so important is because the number of temporary jobs started to decline precipitously right before the last two recessions as well.

You see, when economic conditions start to change, temporary workers are often affected before anyone else is.  Temporary workers are easier to hire than other types of workers, and they are also easier to fire.

In this chart, you can see that the number of temporary workers peaked and started to decline rapidly before we even got to the recession of 2001.  And you will notice that the number of temporary workers also peaked and started to decline rapidly before we even got to the recession of 2008.  This shows why the temporary workforce is considered to be a “leading indicator” for the U.S. economy as a whole.  When the number of temporary workers peaks and then starts to fall steadily, that is a major red flag.  And that is why it is so incredibly alarming that the number of temporary workers peaked in December 2015 and has fallen quite a bit since then…

Temporary Help Services

In May, the U.S. economy lost another 21,000 temporary jobs, and overall we have lost almost 64,000 since December.

If a new economic downturn had already started, this is precisely what we would expect to see.  The following is some commentary from Wolf Richter

Staffing agencies are cutting back because companies no longer need that many workers. Total business sales in the US have been declining since mid-2014. Productivity has been crummy and getting worse. Earnings are down for the fourth quarter in a row. Companies see that demand for their products is faltering, so the expense-cutting has started. The first to go are the hapless temporary workers.

Another indicator which is pointing to big trouble for American workers is the Fed Labor Market Conditions Index.  Just check out this chart from Zero Hedge, which shows that this index has now been falling on a month over month basis for five months in a row.  Not since the last recession have we seen that happen…

Fed Labor Market Conditions MoM

Of course I have been warning about this new economic downturn since the middle of last year.  U.S. factory orders have now been falling for 18 months in a row, job cut announcements at major companies are running 24 percent higher up to this point in 2016 than they were during the same time period in 2015, and just recently Microsoft said that they were going to be cutting 1,850 jobs as the market for smartphones continues to slow down.

As I have been warning for months, the exact same patterns that we witnessed just prior to the last major economic crisis are playing out once again right in front of our eyes.

Perhaps you have blind faith in Barack Obama, the Federal Reserve and our other “leaders”, and perhaps you are convinced that everything will turn out okay somehow, but there are others that are doing what they can to get prepared in advance.

It may surprise you to learn that George Soros is one of them.

According to recent media reports, George Soros has been selling off investments like crazy and has poured tremendous amounts of money into gold and gold stocks

Maybe the best argument in favor of gold is that American legendary investor and billionaire George Soros has recently sold 37% of his stock and bought a lot more gold and gold stocks.

George Soros, who once called gold ‘the ultimate bubble,’ has resumed buying the precious metal after a three-year hiatus. On Monday, the billionaire investor disclosed that in the first quarter he bought 1.05 million shares in SPDR Gold Trust, the world’s biggest gold exchanged-traded fund, valued at about $123.5 million,” Fortune and Reuters reported Tuesday.

George Soros didn’t make his fortune by being a dummy.

Obviously he can see that something big is coming, and so he is making the moves that he feels are appropriate.

If you are waiting for some type of big announcement from the government that a recession has started, you are likely going to be waiting for quite a while.

How it usually works is that we are not told that we are in a recession until one has already been happening for an extended period of time.

For instance, back in mid-2008 Federal Reserve Chairman Ben Bernanke insisted that the U.S. economy was not heading into a recession even though we found out later that we were already in one at the moment Bernanke made that now infamous statement.

On my website, I have been documenting all of the red flags that are screaming that a new recession is here for months.

You can be like Ben Bernanke in 2008 and stick your head in the sand and pretend that nothing is happening, or you can honestly assess the situation at hand and adjust your strategies accordingly like George Soros is doing.

Of course I am not a fan of George Soros at all.  The shady things that he has done to promote the radical left around the globe are well documented.  But they don’t call people like him “the smart money” for no reason.

Down in Venezuela, the economic collapse has already gotten so bad that people are hunting dogs and cats for food.  For most of the rest of the world, things are not nearly that bad, and they won’t be that bad for a while yet.  But without a doubt, the global economy is moving in a very negative direction, and the pace of change is accelerating.

Those that are wise have already been getting prepared, and those that are convinced that everything is going to be just fine somehow have not been getting prepared.

In the end, most people end up believing exactly what they want to believe, and we are not too far away from the time when those choices are going to have very severe consequences.

*About the author: Michael Snyder is the founder and publisher of The Economic Collapse Blog. Michael’s controversial new book about Bible prophecy entitled “The Rapture Verdict” is available in paperback and for the Kindle on Amazon.com.*

Worst Jobs Report In Nearly 6 Years – 102 Million Working Age Americans Do Not Have Jobs

You Are Fired - Public DomainThis is exactly what we have been expecting to happen.  On Friday, the Bureau of Labor Statistics announced that the U.S. economy only added 38,000 jobs in May.  This was way below the 158,000 jobs that analysts were projecting, and it is also way below what is needed just to keep up with population growth.  In addition, the number of jobs created in April was revised down by 37,000 and the number of jobs created in March was revised down by 22,000.  This was the worst jobs report in almost six years, and the consensus on Wall Street is that it was an unmitigated disaster.

The funny thing is that the Obama administration says that the unemployment rate actually went down last month.  Almost every month since Obama has been in the White House, large numbers of Americans that have been unemployed for a very long time are shifted from the “unemployment” category to the “not in the labor force” category.  This has resulted in a steadily falling “unemployment rate” even though the percentage of the population that is actually working has not changed very much at all since the depths of the last recession.

The Bureau of Labor Statistics claims that the number of Americans “not in the labor force” increased by 664,000 from April to May.  If you believe that, I have a giant bridge on the west coast that I would like to sell you.  The labor force participation rate is now down to 62.6, and it is hovering just above a 38 year low.

When you add the number of working age Americans that are “officially unemployed” (7.4 million) to the number of working age Americans that are considered to be “not in the labor force” (an all-time record high of 94.7 million), you get a grand total of 102.1 million working age Americans that do not have a job right now.

This is not a game.

So far in 2016, three members of my own extended family have lost their jobs.

According to Challenger, Gray & Christmas, layoffs at major firms are running 24 percent higher up to this point in 2016 than they were during the same time period in 2015.

It was only a matter of time before those layoffs started showing up in the official employment numbers, and I fully expect that this trend will accelerate in the months ahead.

And here are some other brand new numbers for you to consider…

-Since Barack Obama entered the White House, 14,179,000 Americans have “left the labor force” according to the Bureau of Labor Statistics.

-The quality of our jobs continues to deteriorate.  In May, 59,000 full-time jobs were lost, but 118,000 part-time jobs were gained.

-Since September 2014, 207,000 mining jobs have been lost.

-We just learned that U.S. factory orders have declined once again.  This marks the 18th month in a row that this has taken place, and we have never seen such an extended decline outside of a major recession.

-JPMorgan’s “recession indicators” have just soared to the highest level that we have seen since the last recession.

Needless to say, the financial community is pretty horrified by all of this news.  They were expecting a much better jobs report, and many of them are not hiding their disappointment.  Here is one example from the Wall Street Journal

This was an unqualified dud of a jobs report,” said Curt Long, chief economist at the National Association of Federal Credit Unions, noting “the unemployment rate fell, but for the wrong reason as labor force participation declined for the second consecutive month.”

And here is another example that comes from David Donabedian, the chief investment officer at Atlantic Trust Wealth Management…

We can’t find a positive nugget in today’s job report. If we were looking for signs of strength in this report, there is nothing to hang onto here.”

But of course the mainstream media is doing their best to put a positive spin on these numbers.  For instance, CNN just published a laughable article entitled “America’s economy is stronger than weak jobs report“.

And the White House insists that this new employment report really isn’t that big of a deal

The White House doesn’t get “too disappointed” over the number of unemployed and underemployed Americans.

“I’ve been reacting to jobs numbers here at the White House for more than seven years, and what is true today has been true in the past, which is, we don’t get too excited when jobs numbers are better than expected and we don’t get too disappointed when jobs numbers one-month are lower than expected,” White House Press Secretary Josh Earnest told CNBC.

But of course the truth is that it is a really big deal.  We just received major confirmation that the U.S. economy has slipped into recession mode.

For months, I have been writing about how virtually every other indicator has been screaming that a new economic crisis had already begun.

But the employment numbers had remained fairly decent up until now.  Employment is typically considered to be a “lagging indicator”, which means that it isn’t one of the first places we would expect to see signs of a recession show up.  However, it is inevitable that the official unemployment numbers will reflect an economic downturn eventually, and that is what we are starting to see now.

What this means is that you probably have even less time to get prepared for what is ahead than you may have originally thought.

The U.S. economy has already entered the early chapters of the next great economic crisis, and most of the population is going to be caught totally off guard and will suffer tremendously.

If our leaders had made better decisions since the last crisis, things could have turned out differently.  But instead, they continued to conduct business as usual, and now we will reap what they have sown.

*About the author: Michael Snyder is the founder and publisher of The Economic Collapse Blog. Michael’s controversial new book about Bible prophecy entitled “The Rapture Verdict” is available in paperback and for the Kindle on Amazon.com.*

37 Reasons Why “The Economic Recovery” Is A Giant Lie

37 Sign“If you repeat a lie often enough, people will believe it.”  Sadly, that appears to be the approach that the Obama administration and the mainstream media are taking with the U.S. economy.  They seem to believe that if they just keep telling the American people over and over that things are getting better, eventually the American people will believe that it is actually true.  On Friday, it was announced that the unemployment rate had fallen to “7 percent”, and the mainstream media responded with a mix of euphoria and jubilation.  For example, one USA Today article declared that “with today’s jobs report, one really can say that our long national post-financial crisis nightmare is over.”  But is that actually the truth?  As you will see below, if you assume that the labor force participation rate in the U.S. is at the long-term average, the unemployment rate in the United States would actually be 11.5 percent instead of 7 percent.  There has been absolutely no employment recovery.  The percentage of Americans that are actually working has stayed between 58 and 59 percent for 51 months in a row.  But most Americans don’t understand these things and they just take whatever the mainstream media tells them as the truth.

And of course the reality of the matter is that we should have seen some sort of an economic recovery by now.  Those running our system have literally been mortgaging the future in a desperate attempt to try to pump up our economic numbers.  The federal government has been on the greatest debt binge in U.S. history and the Federal Reserve has been printing money like crazed lunatics.  All of that “stimulus” should have had some positive short-term effects on the economy.

Sadly, all of those “emergency measures” do not appear to have done much at all.  The percentage of Americans that have a job has stayed remarkably flat since the end of 2009, median household income has fallen for five years in a row, and the rate of homeownership in the United States has fallen for eight years in a row.  Anyone that claims that the U.S. economy is experiencing a “recovery” is simply not telling the truth.  The following are 37 reasons why “the economic recovery” is a giant lie…

#1 The only reason that the official unemployment rate has been declining over the past couple of years is that the federal government has been pretending that millions upon millions of unemployed Americans no longer want a job and have “left the labor force”.  As Zero Hedge recently demonstrated, if the labor force participation rate returned to the long-term average of 65.8 percent, the official unemployment rate in the United States would actually be 11.5 percent instead of 7 percent.

#2 The percentage of Americans that are actually working is much lower than it used to be.  In November 2000, 64.3 percent of all working age Americans had a job.  When Barack Obama first entered the White House, 60.6 percent of all working age Americans had a job.  Today, only 58.6 percent of all working age Americans have a job.  In fact, as you can see from the chart posted below, there has been absolutely no “employment recovery” since the depths of the last recession…

Employment-Population Ratio 2013

#3 The employment-population ratio has now been under 59 percent for 51 months in a row.

#4 There are 1,148,000 fewer Americans working today than there was in November 2006.  Meanwhile, our population has grown by more than 16 million people during that time frame.

#5 The “inactivity rate” for men in their prime working years (25 to 54) has just hit a brand new all-time record high.  Does this look like an “economic recovery” to you?…

Inactivity Rate Men

#6 The number of working age Americans without a job has increased by a total of 27 million since the year 2000.

#7 In November 2007, there were 121.9 million full-time workers in the United States.  Today, there are only 116.9 million full-time workers in the United States.

#8 Middle-wage jobs accounted for 60 percent of the jobs lost during the last recession, but they have accounted for only 22 percent of the jobs created since then.

#9 Only about 47 percent of all adults in America have a full-time job at this point.

#10 The ratio of wages to corporate profits in the United States just hit a brand new all-time low.

#11 It is hard to believe, but in America today one out of every ten jobs is now filled by a temp agency.

#12 Approximately one out of every four part-time workers in America is living below the poverty line.

#13 In this economic environment, there is intense competition even for the lowest paying jobs.  Wal-Mart recently opened up two new stores in Washington D.C., and more than 23,000 people applied for just 600 positions.  That means that only about 2.6 percent of the applicants were ultimately hired.  In comparison, Harvard offers admission to 6.1 percent of their applicants.

#14 According to the Social Security Administration, 40 percent of all U.S. workers make less than $20,000 a year.

#15 When Barack Obama took office, the average duration of unemployment in this country was 19.8 weeks.  Today, it is 37.2 weeks.

#16 According to the New York Times, long-term unemployment in America is up by 213 percent since 2007.

#17 Thanks to Obama administration policies which are systematically killing off small businesses in the United States, the percentage of self-employed Americans is at an all-time low today.

#18 According to economist Tim Kane, the following is how the number of startup jobs per 1000 Americans breaks down by presidential administration

Bush Sr.: 11.3

Clinton: 11.2

Bush Jr.: 10.8

Obama: 7.8

#19 According to the U.S. Census Bureau, median household income in the United States has fallen for five years in a row.

#20 The rate of homeownership in the United States has fallen for eight years in a row.

#21 Back in 1999, 64.1 percent of all Americans were covered by employment-based health insurance.  Today, only 54.9 percent of all Americans are covered by employment-based health insurance, and thanks to Obamacare millions more Americans are now losing their health insurance plans.

#22 As 2003 began, the average price of a gallon of regular gasoline was about $1.30.  When Barack Obama took office, the average price of a gallon of regular gasoline was $1.85.  Today, it is $3.26.

#23 Total consumer credit has risen by a whopping 22 percent over the past three years.

#24 In 2008, the total amount of student loan debt in this country was sitting at about 440 billion dollars.  Today, it has shot up to approximately a trillion dollars.

#25 Under Barack Obama, the velocity of money (a very important indicator of economic health) has plunged to a post-World War II low.

#26 Back in the year 2000, our trade deficit with China was 83 billion dollars.  In 2008, our trade deficit with China was 268 billion dollars.  Last year, it was 315 billion dollars.  That was the largest trade deficit that one nation has had with another nation in world history.

#27 The gap between the rich and the poor in the United States is at an all-time record high.

#28 Right now, 1.2 million students that attend public schools in the United States are homeless.  That is a brand new all-time record high, and that number has risen by 72 percent since the start of the last recession.

#29 When Barack Obama first entered the White House, there were about 32 million Americans on food stamps.  Today, there are more than 47 million Americans on food stamps.

#30 Right now, approximately one out of every five households in the United States is on food stamps.

#31 According to the Survey of Income and Program Participation conducted by the U.S. Census, well over 100 million Americans are enrolled in at least one welfare program run by the federal government.

#32 In 2000, the U.S. government spent 199 billion dollars on Medicaid.  In 2008, the U.S. government spent 338 billion dollars on Medicaid.  In 2012, the U.S. government spent 417 billion dollars on Medicaid, and now Obamacare is going to add tens of millions more Americans to the Medicaid rolls.

#33 In 2000, the U.S. government spent 219 billion dollars on Medicare.  In 2008, the U.S. government spent 462 billion dollars on Medicare.  In 2012, the U.S. government spent 560 billion dollars on Medicare, and that number is expected to absolutely skyrocket in the years ahead as the Baby Boomers retire.

#34 According to the most recent numbers from the U.S. Census Bureau, an all-time record high 49.2 percent of all Americans are receiving benefits from at least one government program.

#35 The U.S. government has spent an astounding 3.7 trillion dollars on welfare programs over the past five years.

#36 When Barack Obama was first elected, the U.S. debt to GDP ratio was under 70 percent.  Today, it is up to 101 percent.

#37 The U.S. national debt is on pace to more than double during the eight years of the Obama administration.  In other words, under Barack Obama the U.S. government will accumulate more debt than it did under all of the other presidents in U.S. history combined.

Fortunately, it appears that most Americans are not buying into the propaganda.  According to a new CNN survey, the percentage of Americans that believe that the economy is getting worse far exceeds the percentage of Americans that believe that the economy is improving…

Americans views on the state of the nation are turning increasingly sour, according to a new national poll.

And a CNN/ORC International survey released Friday also indicates that less than a quarter of the public says that economic conditions are improving, while nearly four in ten say the nation’s economy is getting worse.

Forty-one percent of those questioned in the poll say things are going well in the country today, down nine percentage points from April, and the lowest that number has been in CNN polling since February 2012. Fifty-nine percent say things are going badly, up nine points from April.

So what do you think?

Do you believe that the U.S. economy is getting better or getting worse?  Please feel free to share what you think by posting a comment below…

A Jobs Report Conspiracy?

Well, isn’t that convenient?  The Obama campaign desperately needed the last employment report to be released before the election to show that the unemployment rate had fallen below 8 percent, and somehow it magically happened.  Even though non-farm payroll employment only increased by 114,000 last month (not enough to even keep up with population growth), the official unemployment rate fell from 8.1 percent to 7.8 percent.  So how did that happen?  Well, the unemployment number is not based on the survey of employers that showed that 114,000 jobs were added to the economy last month.  Rather it is based on a survey of households.  And that survey showed that the total number of Americans employed last month increased by a whopping 873,000 – almost eight times the number that the employer survey showed.  That figure for September (873,000) was the biggest one month increase in 29 years.  And it just happened to come at the exact perfect time for Barack Obama.  So was there a jobs report conspiracy?  Examine the evidence and decide for yourself.

The number of Americans with a job fell by 195,000 in July.

Then it fell by another 119,000 in August.

But somehow in September it miraculously exploded in the other direction and 873,000 jobs were added to the economy?

If you believe that, I have a bridge that I want to sell you.

Somehow, the largest increase in jobs in 29 years happened just when Barack Obama needed it the most.

Nah, that doesn’t sound fishy to me at all.

We are being told that a big reason for the huge increase was the number of Americans working part-time for “economic reasons”.  That number surged from 8.0 million in August to 8.6 million in September.

Why the sudden jump?

Nobody can really explain it.

And if you look at the U6 unemployment rate, nothing has really changed at all.  U6 is still at 14.7 percent just like it was last month.

But the media is not going to talk about the U6 rate.  Instead, all of the headlines are going to be about “7.8 percent”.

According to the survey of employers, the U.S. economy added fewer jobs in September than it did in August, and it added fewer jobs in August than it did in July.

So according to the survey of employers, the employment situation in the United States is getting worse.

But according to the household survey, we just had the greatest month of job creation since the first term of Ronald Reagan.

Something does not add up.

And as I have written about previously, the unemployment rate would actually be up around 11 percent instead of 7.8 percent if not for the millions of workers that the government claims “dropped out of the labor force” over the past few years because they became too discouraged to look for work.

So unemployment in America is still a massive crisis, but the media is boldly proclaiming that things are getting better and that we are on the road to recovery.

Of course Obama looks like the cat who ate the canary today.  He is just thrilled with the “7.8 percent” number.

But the truth is that according to the employer survey, job growth in the United States is actually slower than last year.  The following is from the Calculated Risk blog….

All that said, the economy has only added 1.3 million payroll jobs over the first nine months of the year. At this pace, the economy would only add around 1.8 million private sector jobs in 2012; less than the 2.1 million added in 2011.

Are you starting to see why people are so skeptical of this jobs report?

When the “7.8 percent” figure was released, there was immediately a wave of shock and unbelief throughout the financial world and all over the Internet.

The following is a sampling of skeptical quotes about this jobs report….

Former GE chief Jack Welch

Unbelievable jobs numbers..these Chicago guys will do anything..can’t debate so change numbers

Chapwood Capital Investment Management Managing Partner Ed Butowsky

I feel like I’m watching a movie. There is no way in the world these numbers are accurate.

Neil Irwin of the Washington Post

“Weird that payrolls are exactly on forecast but household survey is far better.”

Conn Carroll, senior editorial writer for the Washington Examiner

While it is highly improbable that BLS conspired to cook the books, there is still a huge 756,000 job gap between the number of jobs employers told the Labor Department they created in September (114k), and the number of Americans who told the labor department that they got new jobs (873k).

U.S. Representative Allen West

I agree with former GE CEO Jack Welch, Chicago style politics is at work here. Somehow by manipulation of data we are all of a sudden below 8 percent unemployment, a month from the Presidential election. This is Orwellian to say the least and representative of Saul Alinsky tactics from the book “Rules for Radicals”- a must read for all who want to know how the left strategize . Trust the Obama administration? Sure, and the spontaneous reaction to a video caused the death of our Ambassador……and pigs fly.

Gluskin Sheff’s David Rosenberg

That the 7.8 percent jobless rate takes it to the level that prevailed when the President took office in January 2009 has raised many an eyebrow. I don’t believe in conspiracy theories. But I don’t believe in the Household Survey either. 

This notoriously volatile indicator has become even more so in recent months. It showed a 195K slide in July and a 119K decline in August, to only then reveal a massive 873K surge in September.

Radio host Laura Ingraham

“Jobs #s from Labor Secretary Hilda Solis are total pro-Obama propaganda–labor force participation rate at 30-yr low. Abysmal!”

Americans for Limited Government

“Either the Federal Reserve, which has its fingers on the pulse of every element of the economy, and the Bureau of Labor Statistics manufacturing survey report are grievously wrong or the number used to calculate the unemployment rate are wrong, or worse manipulated. Given that these numbers conveniently meet Obama’s campaign promises one month before the election, the conclusions are obvious.”

Rick Santelli of CNBC

“I told you they’d get it under 8 percent — they did! You can let America decide how they got there!”

Of course the backlash in the media against skepticism of the jobs report has been very forceful.

Already, those that are doubtful of the legitimacy of the jobs report are being called “truthers” – as if there is something wrong with wanting to know the truth.

Sadly, that is how things work these days.  If you don’t like the viewpoint that some people are expressing, you just label them “conspiracy theorists”.

And when someone is labeled a “conspiracy theorist”, that is code for “that person is so crazy that you should not listen to anything they say”.

But the truth is that we live in a world where often people do things that they are not supposed to be doing.

When something rather strange happens, it is not wrong to investigate and try to figure out what is going on.

And this jobs report seems very, very odd.

It sure does seem rather strange that the household survey is showing almost 8 times as many jobs created as the employer survey does.

It sure does seem rather strange that 873,000 more Americans were working in September (the largest increase in 29 years) after decreases in both July and August.

It sure does seem rather strange that the unemployment rate dropped under 8 percent at the exact moment when Barack Obama needed it the most.

But perhaps all of this is just a coincidence.

What do you think?